[Preprint]. 2024 Oct 21:2024.10.18.619080.
doi: 10.1101/2024.10.18.619080.

Integrin alpha1 beta1 promotes interstitial fibrosis in a mouse model of polycystic kidney disease

Affiliations

Integrin alpha1 beta1 promotes interstitial fibrosis in a mouse model of polycystic kidney disease

C Grenier et al. bioRxiv. .

Abstract

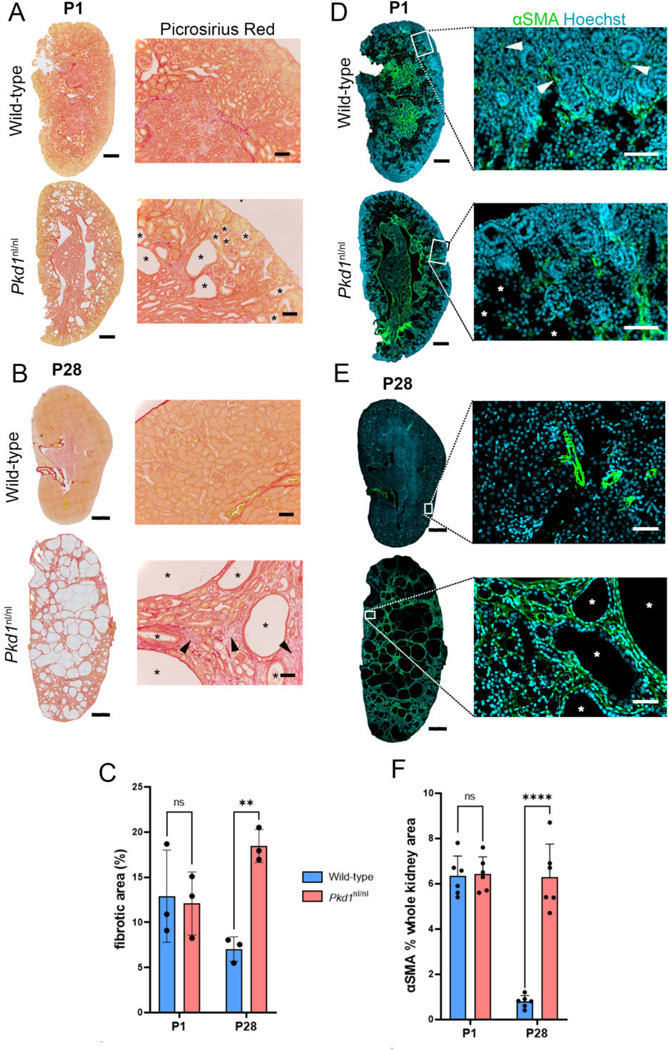
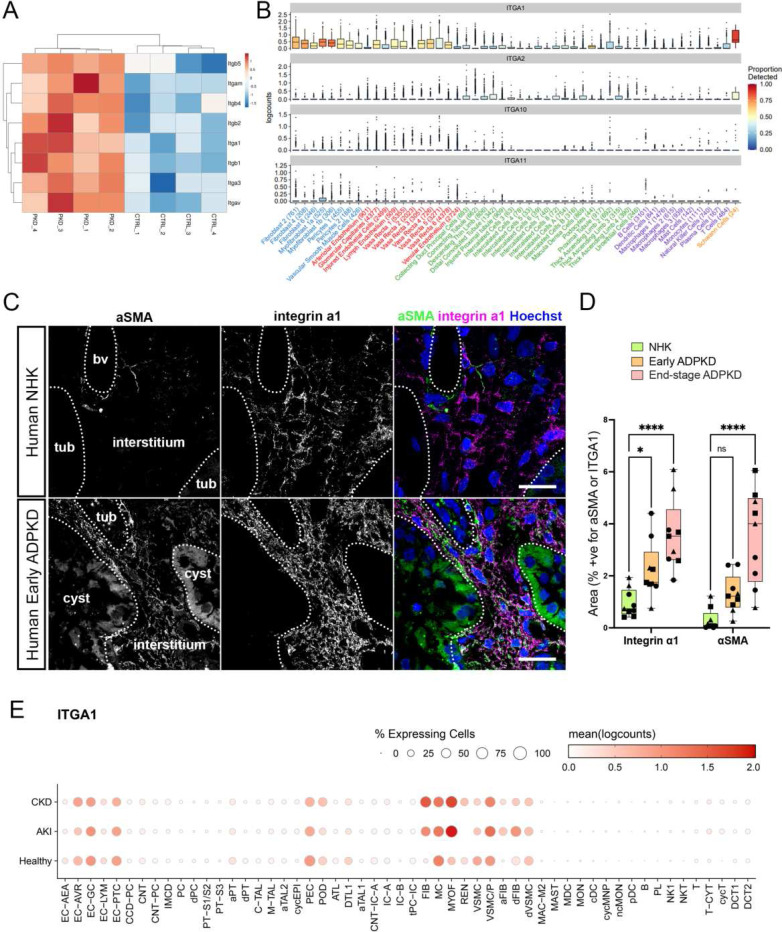
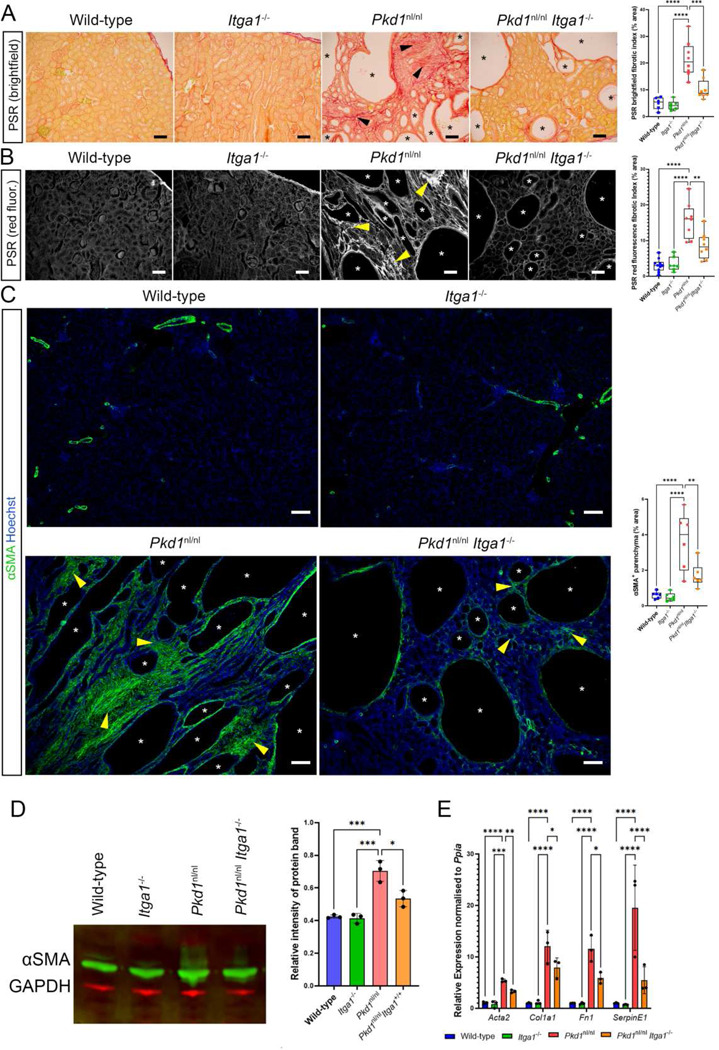
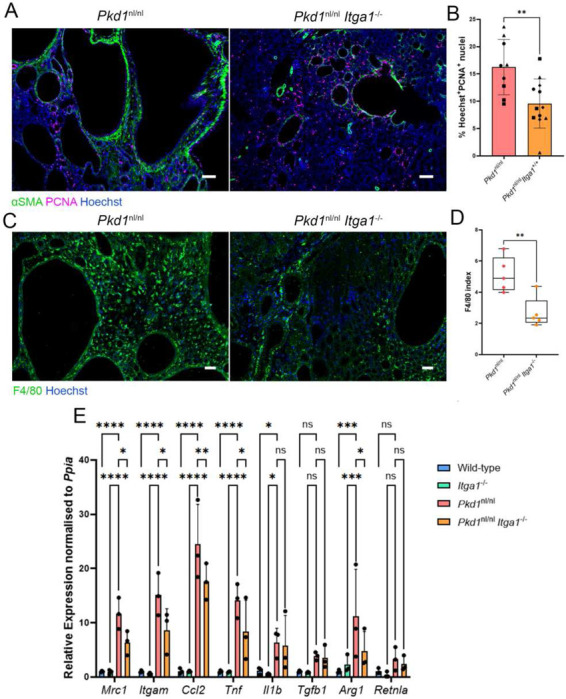
Fibrosis is the cause of end-stage kidney failure in patients with Autosomal Dominant Polycystic Kidney Disease (ADPKD). The molecular and cellular mechanisms involved in fibrosis are complex and anti-fibrotic therapies have so far failed to make an impact on patient welfare. Using unbiased proteomics analysis on the Pkd1 nl/nl mouse, we found that expression of the integrin α1 subunit is increased in this model of ADPKD. In human ADPKD tissue and two single cell RNA kidney disease datasets, ITGA1 was also upregulated. To investigate the functional role of this integrin subunit in ADPKD, we generated a Pkd1 nl/nl Itga1 -/- mouse. We observed a significant reduction in kidney volume and kidney dysfunction in mice lacking the integrin α1 subunit. Kidneys from Pkd1 nl/nl Itga1 -/- mice had smaller cysts and reduced interstitial expansion and tubular atrophy. Picrosirius red staining identified a restriction in collagen staining in the interstitium and the myofibroblast marker α smooth muscle actin was also downregulated. Myofibroblast cell proliferation was reduced in Pkd1 nl/nl Itga1 -/- mice and primary fibroblast cultures demonstrated an abrogated fibrogenic phenotype in integrin α1-depleted fibroblasts. These results highlight a previously unrecognised role for the integrin α1 subunit in kidney fibrosis.


Figures

Figure 1:
Figure 1:. Interstitial fibrosis is established by P28 in Pkd1nl/nl kidneys
A and B) Picrosirius Red (PSR) staining of P1 (A) and P28 (B) kidneys, whole kidney views shown on the left and higher magnification views in right panels. Arrowheads in B highlighting areas of collagen-rich fibrosis, asterisks indicate individual cysts. C) Histogram showing the % fibrotic area (measured from PSR staining) in wild-type and Pkd1nl/nl kidneys at P1 and P28. D and E) Alpha smooth muscle actin (αSMA) staining of P1 (D) and P28 (E) kidneys, whole kidney views shown on the left and higher magnification views in right panels. Arrowheads in D indicate αSMA+ myofibroblasts in the nephrogenic zone of the P1 kidney cortex, asterisks indicate individual cysts. F) Histogram showing the % area of kidney that is αSMA in wild-type and Pkd1nl/nl kidneys at P1 and P28. Scale bars: Whole kidney P1 views in A) and D) 200 μm, whole kidney P28 views in B) and E) 1000 μm, higher magnification panel views in A) and B) 100μm, higher magnification views in D) and E) 50 μm.
Figure 2:
Figure 2:. MS-based proteomics analysis identified significant changes in Pkd1nl/nl adhesome at P28
A) Schematic of experimental plan and sample preparation for proteomics analysis. B) Histogram showing proportion and identification of ECM proteins in the datasets for each sample group. C) Principal component analysis for SF and LSF at P1 and P28. D) Voronoi plot showing Panther analyses for top 100 upregulated proteins in the P28 SF. E) Volcano plots showing the Log2 fold change in protein abundance of MatrisomeDB proteins comparing Pkd1nl/nl (PKD) kidneys to Pkd1+/+ (Control) kidneys for the SF and LSF at P1 and P28. F) Volcano plots showing the Log2 fold change in protein abundance of focal adhesion proteins comparing Pkd1nl/nl (PKD) kidneys to Pkd1+/+ (Control) kidneys for the SF and LSF at P28.
Figure 3:
Figure 3:. Integrin α1 is upregulated in Pkd1nl/nl and human kidneys and is expressed in the interstitial mesenchyme
A) Heat map showing expression of all the integrin subunits detected in the Pkd1nl/nl kidney proteomics dataset. B) Box and violin plots showing human kidney scRNA-seq data for ITGA1, ITGA2, ITGA10 and ITGA11. C) Panels showing super-resolution microscopy images of human normal healthy kidney (top panels) and early stage ADPKD human kidney (bottom panels). Left panels are labelled for αSMA, middle panels are labelled for integrin α1 and right panels show the merge. Scale bar indicates 20 μm. D) Box and violin plots showing the extent of αSMA+ immunostaining (by area) in the indicated groupings. Each symbol represents a biological replicate, for each replicate three random snapshots were taken. E) Dot plot of ITGA1 expression in a scRNAseq dataset published by the kidney precision medicine project. For cell cluster abbreviation definitions, see Methods, MyoF, Myofibroblast; Fb, Fibroblast.
Figure 4:
Figure 4:. Integrin α1 depletion attenuated kidney pathology associated with Pkd1nl/nl mice
A) Schematic showing experimental setup for mouse crossings and tissue collection. B) Photograph of fixed kidneys isolated from mice of indicated genotypes at P28. C)-F) Box and violin plots of % 2 kidney weight to body weight ratio (2KW:BW, C), body weight (grams, D), blood urea nitrogen (mg/dL, E) and urinary albumin to creatinine ratio (uACR, mg/g, F) of indicated genotypes. In dataplots in C)-F), square symbols identify males, circle symbols identify females.
Figure 5:
Figure 5:. Cyst growth is reduced in Pkd1nl/nl mice depleted of integrin α1
A) Haematoxylin and Eosin (H&E) stained whole P28 kidney views of indicated genotypes. Scale bars indicate 1000 μm. B)-E) Box and violin plots of cystic index (B), average cyst area (μm2, C), cyst number (D) and glomerular counts (E) of indicated genotypes. F) Panels showing higher magnification views of H&E-stained kidneys of indicated genotypes. Asterisks indicate cysts, arrowheads highlight areas of interstitial expansion and nephron atrophy. Scale bars indicate 100 μm. In dataplots shown in B)-E), square symbols identify males, circle symbols identify females.
Figure 6:
Figure 6:. Integrin α1 depletion reduced interstitial fibrosis in Pkd1nl/nl kidneys
A) Panels show brightfield views of Picrosirius red (PSR) staining on P28 kidneys of indicated genotypes. Black arrowheads show areas of extensive interstitial fibrosis, asterisks indicate individual cysts. Box and violin plot on the right shows’ quantification of the fibrotic area index for the indicated genotypes. Scale bar indicates 50 μm. B) Panels show red channel fluorescence views of Picrosirius red (PSR) staining on P28 kidneys of indicated genotypes. Yellow arrowheads show areas of extensive interstitial fibrosis, asterisks indicate individual cysts. Box and violin plot on the right shows’ quantification of the fibrotic area index for the indicated genotypes. Scale bar indicates 50 μm. C) Panels show αSMA immunostaining (green) and Hoechst staining (blue) on P28 kidneys of indicated genotypes. Arrowheads show areas of extensive αSMA+ labelling (areas of extensive fibrosis), asterisks indicate individual cysts. Box and violin plot on the right shows’ quantification of the αSMA+ area index for the indicated genotypes. Scale bar indicates 100 μm. D) Panel on right shows Western blot bands for αSMA (green) and GAPDH (red) from lysates generated from indicated genotypes. Histogram on the right shows quantification analysis for Western blots performed on three biological replicates for each genotype. E) Histogram showing qRT-PCR relative expression analysis for transcripts of the indicated genes in the four genotypes used in the study. Ppia was used as the normalising gene. In dataplots shown in A), B) and C), square symbols identify males, circle symbols identify females.
Figure 7:
Figure 7:. Integrin α1 depletion reduced myofibroblast proliferation and numbers of macrophage in Pkd1nl/nl kidneys
A) Panels show triple staining for αSMA (green), PCNA (magenta) and Hoechst (blue) in Pkd1nl/nl (left panel) and Pkd1nl/nlItga1−/− (right panel) kidneys. Scale bar indicates 100 μm. B) Histogram comparing the % of Hoechst+PCNA+ nuclei in αSMA+ regions only of Pkd1nl/nl and Pkd1nl/nlItga1−/− kidneys. Each symbol represents a biological replicate, for each replicate three random snapshots were taken. C) Panels show staining for F4/80 (green) and Hoechst (blue) in Pkd1nl/nl (left panel) and Pkd1nl/nlItga1−/− (right panel) kidneys. Scale bar indicates 100 μm. D) Box and whisker plot showing the F4/80 index in Pkd1nl/nl and Pkd1nl/nlItga1−/− kidneys. E) Histogram showing qRT-PCR relative expression analysis for transcripts of the macrophage markers and inflammatory genes in the four genotypes used in the study. Ppia was used as the normalising gene.
Figure 8:
Figure 8:. Profibrogenic markers were reduced in primary fibroblasts cultures taken from Pkd1nl/nlItga1−/− kidneys
A) Panels show triple staining for αSMA (green), phalloidin (magenta) and Hoechst (blue) in primary fibroblast cultures taken from Pkd1nl/nl (left panel) and Pkd1nl/nlItga1−/− (right panel) kidneys. Scale bar indicates 100 μm. B) and C) Histograms indicating the % of αSMA+ cells (B) and % EdU+ nuclei in primary fibroblast cultures taken from Pkd1nl/nl and Pkd1nl/nlItga1−/− kidneys. D) Histogram showing the contractility of collagen hydrogels seeded with no cells, Pkd1nl/nl primary fibroblasts and Pkd1nl/nlItga1−/− primary fibroblasts. E) Histogram showing qRT-PCR relative expression analysis for transcripts of the fibrotic markers in Pkd1nl/nl versus Pkd1nl/nlItga1−/− primary fibroblasts. Ppia was used as the normalising gene. F) Schematic model for the proposed mechanisms by which integrin α1 promotes kidney fibrosis.

References

    1. Bergmann C., et al., Polycystic kidney disease. Nat Rev Dis Primers, 2018. 4(1): p. 50. - PMC - PubMed
    1. Hughes J., et al., The polycystic kidney disease 1 (PKD1) gene encodes a novel protein with multiple cell recognition domains. Nat Genet, 1995. 10(2): p. 151–60. - PubMed
    1. Shen P.S., et al., The Structure of the Polycystic Kidney Disease Channel PKD2 in Lipid Nanodiscs. Cell, 2016. 167(3): p. 763–773.e11. - PMC - PubMed
    1. Grieben M., et al., Structure of the polycystic kidney disease TRP channel Polycystin-2 (PC2). Nat Struct Mol Biol, 2017. 24(2): p. 114–122. - PubMed
    1. Su Q., et al., Structure of the human PKD1-PKD2 complex. Science, 2018. 361(6406). - PubMed

Publication types

LinkOut - more resources