[Preprint]. 2024 Oct 25:2024.10.22.618529.
doi: 10.1101/2024.10.22.618529.

Comprehensive structure-function analysis reveals gain- and loss-of-function mechanisms impacting oncogenic KRAS activity

Affiliations

Comprehensive structure-function analysis reveals gain- and loss-of-function mechanisms impacting oncogenic KRAS activity

Jason J Kwon et al. bioRxiv. .

Abstract

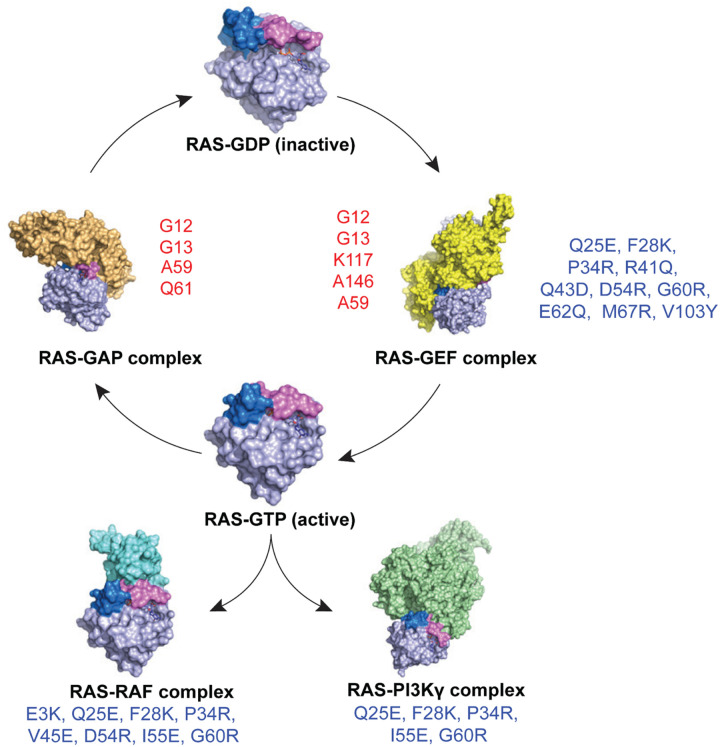
To dissect variant-function relationships in the KRAS oncoprotein, we performed deep mutational scanning (DMS) screens for both wild-type and KRASG12D mutant alleles. We defined the spectrum of oncogenic potential for nearly all possible KRAS variants, identifying several novel transforming alleles and elucidating a model to describe the frequency of KRAS mutations in human cancer as a function of transforming potential, mutational probability, and tissue-specific mutational signatures. Biochemical and structural analyses of variants identified in a KRASG12D second-site suppressor DMS screen revealed that attenuation of oncogenic KRAS can be mediated by protein instability and conformational rigidity, resulting in reduced binding affinity to effector proteins, such as RAF and PI3-kinases, or reduced SOS-mediated nucleotide exchange activity. These studies define the landscape of single amino acid alterations that modulate the function of KRAS, providing a resource for the clinical interpretation of KRAS variants and elucidating mechanisms of oncogenic KRAS inactivation for therapeutic exploitation.

Keywords: KRAS; cancers; cell transformation; deep mutational scanning; structure-function.


Figures

Figure 1.
Figure 1.. Gain-of-function deep mutational scanning screen highlights KRAS mutational frequency as a function of mutational probability, mutational signatures, and phenotypic selection.
(A) Heat map representation of LFC allele enrichment (red) and depletion (blue) showing Log2 Fold Change (LFC) for each allele from KRAS deep mutational scanning (DMS) gain-of-function screen in HA1E cells, comparing Day 0 and Day 7 data. Each column represents an amino acid in KRAS, and each row represents the substituted residue. Grey squares indicate the missing alleles. The secondary structures, the five nucleotide-binding motifs (G1-G5), and the two Switch motifs are annotated on top, followed by a line graph showing the average LFC of all substitutions at each residue in each screen. (B) Mapping of maximal LFC on crystal structure of KRAS per residue position. The color indicated the highest LFC of substitutions at each amino acid and the size correlates with the number of high-ranking putative suppressor mutations at each residue. (C) Scatter plot of KRAS variants with functional score from DMS (x-axis) and observed frequency in clinical patient samples (y-axis). Color indicates the minimum number of nucleotide substitutions from native germline codon sequence to mutant variant, with single nucleotide substitution (SNS – red), double nucleotide substitution (DNS – blue), and triple nucleotide substitution (TNS – green). Relative size of bubble indicates OncoKB annotation of oncogenicity. (D) Poisson distribution model of KRAS single nucleotide substitution (SNS) spectrum as a function of mutational signature and functional impact is presented. Prediction of SNS counts were carried out using the indicated models trained on KRAS single nucleotide variants occurrences in the GENIE dataset and tested on the KRAS SNS variant occurrence from the COSMIC dataset. The mutation-level Pearson correlation coefficient between predicted and observed counts are presented on top.
Figure 2.
Figure 2.. Loss-of-function KRASG12D screen reveals second-site suppressor mutations and destabilizing mutations.
(A) Heat map representation of LFC allele enrichment (red) and depletion (blue) showing LFCs for each allele from deep mutational scanning (DMS) screen anchored on KRASG12D mutant background. The LFC for each variant was calculated based on the Log2 fold change of normalized counts on day 12 compared to Day 0 for HCC827 cells. Each column represents an amino acid in KRAS, and each row represents the substituted residue, and grey squares indicate missing alleles. Secondary structures, the five nucleotide-binding motifs (G1-G5), and two Switch motifs are annotated on top, followed by a line graph showing the average LFC of all substitutions per position. (B) Mapping of maximal LFC on the crystal structure of KRAS per residue position. The color indicated the highest LFC of substitutions at each amino acid and the size correlates with the number of high-ranking putative suppressor mutations at each residue. (C) Scatter plot showing position-level calculated, mean free-energy change upon mutation (intrinsic KRASG12D stability) and corresponding average scaled LFC for fitness in the KRAS DMS screen, with higher ΔΔG values corresponding to greater instability and positive DMS LFC indicating inactivating second-site mutation. (D) Transient expression of indicated KRASG12D suppressor mutant alleles in 293T cells. Both RASG12D and total KRAS were detected. (E) Heatmap of Log2FC of RASG12D levels at indicated timepoints compared to 0 hour following cycloheximide (CHX) treatment in HA1E isogenic cells expressing indicated KRASG12D mutants.
Figure 3.
Figure 3.. Structural insights and mutational tolerance profiles uncover KRASG12D inactivation mechanisms by allosteric and orthosteric impacts on switch-I and -II conformations.
Structural comparison of GDP-bound KRASG12D with (A) G12D/I55E, (B) G12D/F28K, and (C) G12D/D54R shows conformational changes in switch-I and -II caused by suppressor mutation. (D) Binding affinities (KD measured by isothermal titration calorimetry) for relevant KRASG12D inactivating mutants against effector RAF1-RBD, with inactivating mutants labeled in red. (E) Heatmap of KRAS effector binding residue interaction energy predicted by Amber10 force-field-based energy calculation (top) and average LFC of residues that have been grouped according to biophysical characteristics, including negative charge (D/E), positive charge (K/R), hydrophobic-aromatic (F/W/Y/H), hydrophobic-small (G/A/V/L/I/M), polar uncharged (S/T/C/Y/N/Q), and helix breaker (P/G). (F) Global structural view of KRAS and RAF1(RBD-CRD) with KRASG12D residues involved in direct RAF1 binding - V45, and proximal residues - E3 and D54 (stick representation) (PDB: 6XHB). Enlarged view of the KRAS-RAF1(RBD-CRD) interaction interface comparing KRASG12D against (G) V45E, (H) D54R, and (I) E3K.
Figure 4.
Figure 4.. Subset of KRASG12D inactivating mutations that result in increased GDP engagement through conformational locking and reduced SOS1-dependent GDP exchange.
(A) SOS-mediated GDP exchange activity: bar graph of SOS-mediated GDP off-rate of KRASG12D and inactivating mutants. (B, C) Superposition of structures of KRASG12D inactivating mutants P34R (B) and V103Y (C) with HRAS bound at the catalytic site in the HRAS-SOS complex (PDB 1NVW) shows the impact of the inactivating mutation on RAS-SOS interaction. An enlarged view showing the interaction of mutated residues with SOS is shown in the box in each panel. SOS is colored yellow, and regions that undergo significant conformational changes in WT HRAS and KRASG12D inactivating mutant structures are highlighted in blue and green, respectively. Side-chain atoms of inactivating residue are shown in stick representation.
Figure 5.
Figure 5.. Schematic representation illustrating the impact of second-site inactivating mutations of KRASG12D.
Schematic representation of KRAS cycling between its inactive GDP-bound form (RAS-GDP) and active GTP-bound form (RAS-GTP), as well as its interactions with regulatory proteins and effectors. The RAS-GDP state is shown at the top center, transitioning to the RAS-GEF complex (right), which facilitates nucleotide exchange. The GTP-bound RAS engages with downstream effectors, including RAS-RAF and RAS-PI3K. RAS-GAP inactivates RAS by promoting GTP hydrolysis, returning RAS to its GDP-bound state. KRAS gain-of-function mutations (red - G12, G13, A59, K117, A146, and Q61) lead to constitutive activation of RAS. Loss-of-function mutations (blue – E3, Q25, F28, P34, R41, Q43, V45, D54, I55, G60, E62, M67, and V103) disrupt interactions with effectors and regulatory proteins (RasGEFs), resulting in reduced oncogenicity of KRASG12D.

References

    1. Simanshu D. K., Nissley D. V. & McCormick F. RAS Proteins and Their Regulators in Human Disease. Cell 170, 17–33 (2017). - PMC - PubMed
    1. Hingorani S. R. et al. Trp53R172H and KrasG12D cooperate to promote chromosomal instability and widely metastatic pancreatic ductal adenocarcinoma in mice. Cancer Cell 7, 469–483 (2005). - PubMed
    1. Ji H. et al. LKB1 modulates lung cancer differentiation and metastasis. Nature 448, 807–810 (2007). - PubMed
    1. Haigis K. M. et al. Differential effects of oncogenic K-Ras and N-Ras on proliferation, differentiation and tumor progression in the colon. Nat. Genet. 40, 600–608 (2008). - PMC - PubMed
    1. Brummelkamp T. R., Bernards R. & Agami R. A system for stable expression of short interfering RNAs in mammalian cells. Science 296, 550–553 (2002). - PubMed

Publication types