[Preprint]. 2025 May 27:2024.08.27.609993.
doi: 10.1101/2024.08.27.609993.

NeuroSC: Exploring Neurodevelopment via Spatiotemporal Collation of Anatomical Networks

Affiliations

NeuroSC: Exploring Neurodevelopment via Spatiotemporal Collation of Anatomical Networks

Noelle L Koonce et al. bioRxiv. .

Update in

Abstract

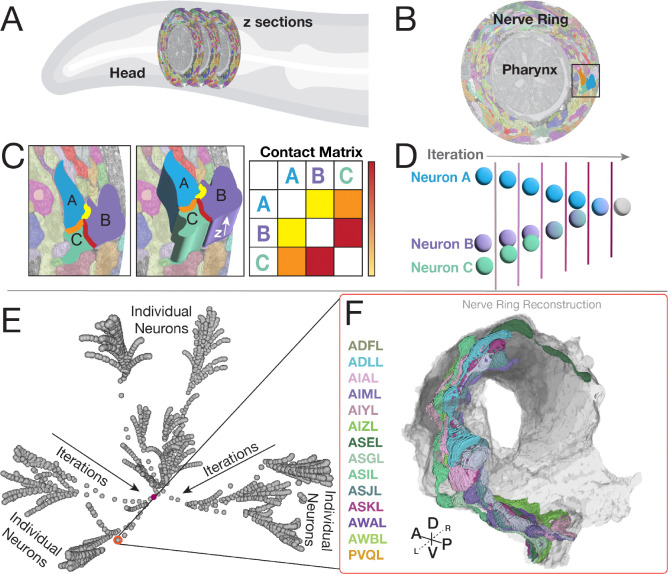
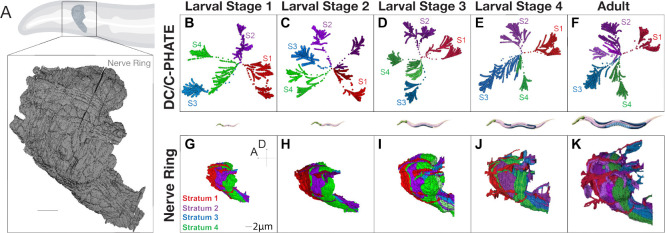
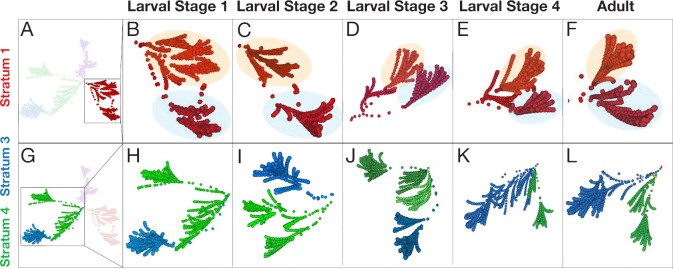
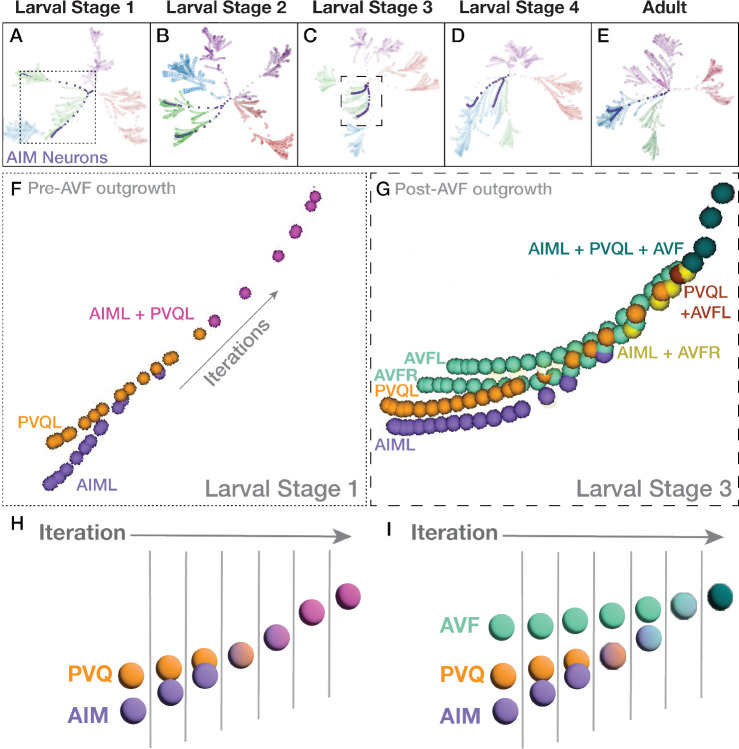
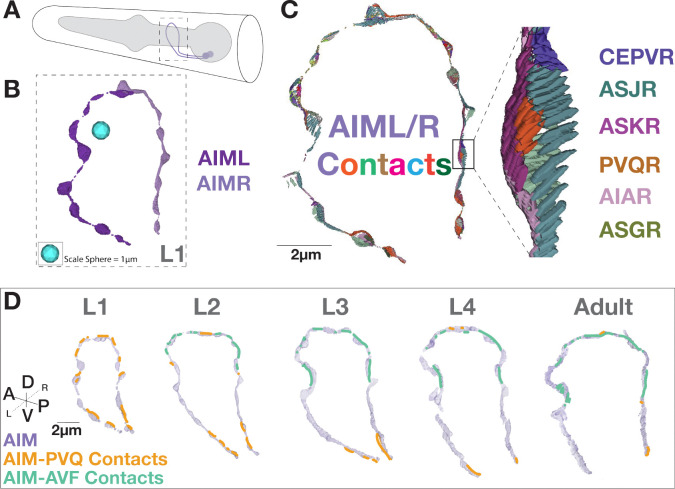
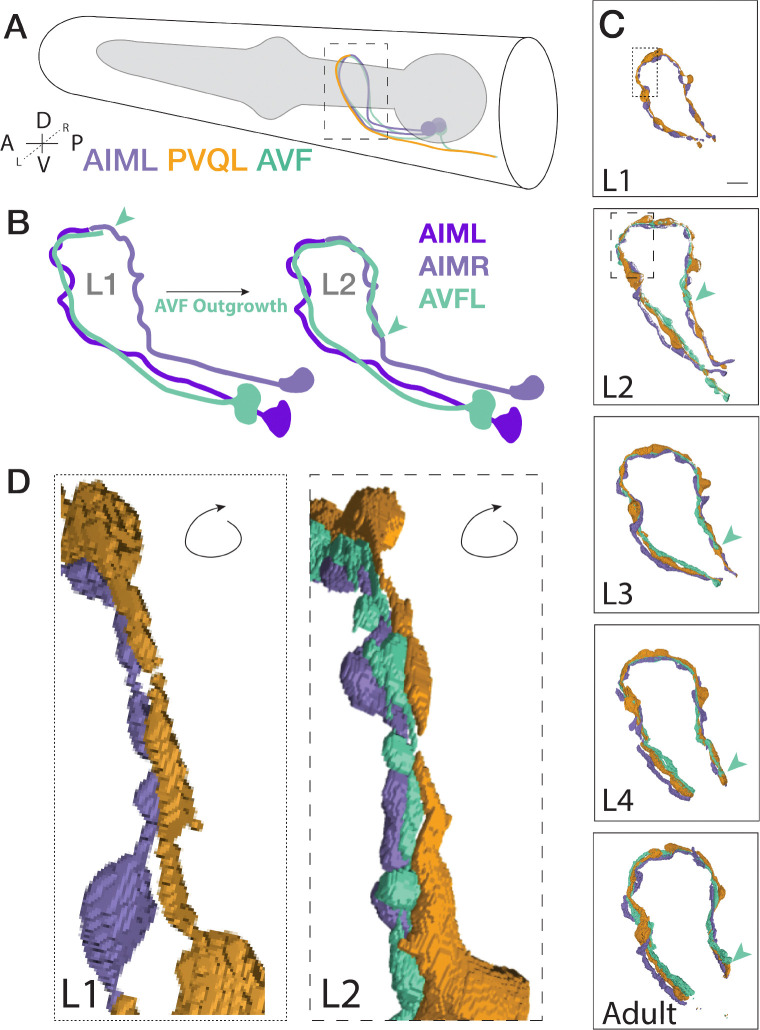
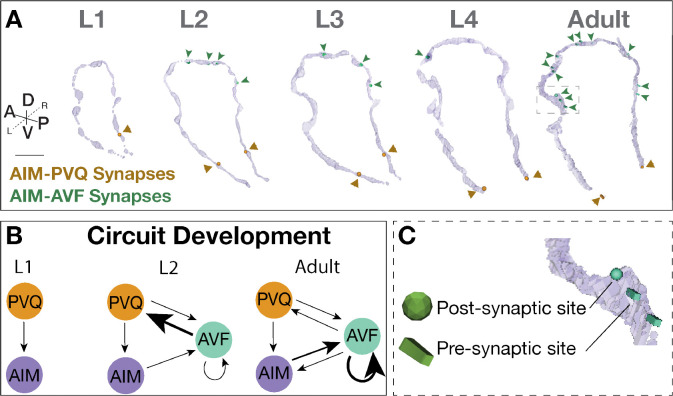
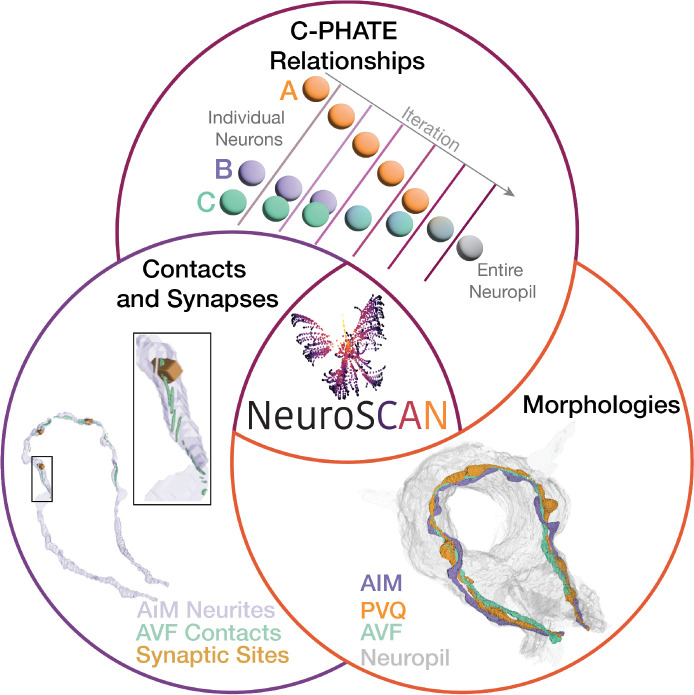
Volume electron microscopy (vEM) datasets such as those generated for connectome studies allow nanoscale quantifications and comparisons of the cell biological features underpinning circuit architectures. Quantifying cell biological relationships in the connectome yields rich, multidimensional datasets that benefit from data science approaches, including dimensionality reduction and integrated graphical representations of neuronal relationships. We developed NeuroSC (also known as NeuroSCAN) an open source online platform that bridges sophisticated graph analytics from data science approaches with the underlying cell biological features in the connectome. We analyze a series of published C. elegans brain neuropils and demonstrate how these integrated representations of neuronal relationships facilitate comparisons across connectomes, catalyzing new insights into the structure-function relationships of the circuits and their changes during development. NeuroSC is designed for intuitive examination and comparisons across connectomes, enabling synthesis of knowledge from high-level abstractions of neuronal relationships derived from data science techniques to the detailed identification of the cell biological features underpinning these abstractions.


Conflict of interest statement

Competing Interests Authors do not declare any competing interests. Declaration of generative AI and AI-assisted technologies in the writing process. During the preparation of this work the author(s) used ChatGPT in order to improve readability. After using this tool, the author(s) reviewed and edited the content as needed and take full responsibility for the content of the published article.

Figures

Figure 1.
Figure 1.. DC/C-PHATE representations of contactome-based relationships.
DC/C PHATE graphs enable representations of neuronal contact relationships. To build DC/C-PHATE graphs we (A) analyzed serial section EM datasets of the C. elegans nerve ring neuropil (located in the head of the animal). (B) Single cross section of the nerve ring (surrounding the pharynx), with segmented neurites pseudo-colored. Dark box corresponds to the zoomed-in image in (C). The cross section is from the JSH dataset digitally segmented (Brittin et al., 2021). (C) Zoom-in cross section with three arbitrary neurons (called A, B, C) highlighted by overlaying opaque cartoon (2-D, left image) and 3-D shapes (middle image) to represent the segmentation process in the z-axis (arrow) and the neuronal contact sites (highlighted Yellow, orange and Red). Contacts are quantified for all neuron pairs across the contactome (See Methods), to generate a Contact Matrix (represented here as a table, schematized for the three arbitrary neurons selected and in which specific contact quantities are represented by a color scale and not numerical values). Yellow represents little contact, and red represents a large degree of contact. Here, as an example you can see that neuron B and C have the largest degree of contact. In an actual contact matrix, this would be a large number of shared pixels. (D) Schematic of how the Diffusion Condensation algorithm (visualized with C-PHATE) works. DC/C-PHATE makes use of the contact matrix to group neurons based on similar adjacency profiles (Brugnone et al. 2019; 2019; Moyle et al. 2021), schematized here for the three neurons in (C). (E) Screenshot of the 3-D C-PHATE graph from a Larval stage 1 (L1; 0 hours post hatching;) contactome, with individual neurons represented as spheres at the periphery. Neurons were iteratively clustered towards the center, with the final iteration containing the nerve ring represented as a sphere in the center of the graph (Highlighted in maroon). (F) Integration in NeuroSC of the DC/C-PHATE and EM-derived 3-D neuron morphology representations allow users to point to each sphere in the graph and determine cellular or cluster identities for each iteration. Shown here and circled in Red, an arbitrarily selected cluster (in E), with the identities of the neurons belonging to that cluster (four letter codes in the column to the left of F) and the corresponding neuronal morphologies (right) of this group of neurons in the EM-reconstructed nerve ring (with individual neurons pseudo-colored according to their names to the left). Compass: Anterior (A), Posterior (P), Dorsal (D), Ventral (V), Left (L), Right (R).
Figure 2.
Figure 2.. Implementation of DC/C-PHATE to developmental contactomes reveal a conserved layered organization maintained during post-embryonic growth.
(A) Cartoon of the C. elegans head and nerve ring (outlined with black box). Below, nerve ring reconstruction from EM data of an L1 animal (5 hours post hatching), with all neurons in gray. Scale bar 2 μm. (B-F) DC/C-PHATE plots generated for available contactomes across C. elegans larval development, colored by stratum identity as described (Moyle et al., 2021). Individual neurons are located at the edges of the graph and condense centrally. The four super-clusters identified and all iterations before are colored accordingly. The identity of the individual neurons belonging to each stratum, and at each larval stage, were largely preserved, and are provided in Supplementary Tables 3–6. Some datasets contain 5 or 6 super-clusters (colored hues of the stratum that they most closely identify with). These clusters are classified as groups of neurons that are differentially categorized across the developmental connectomes. Note in B the blue cluster extends far to the left due to rotation of the 3D image. (G-K) Volumetric reconstruction of the C. elegans neuropil (from EM serial sections for the indicated larval stages (columns) with the neurons colored based on their strata identity. Scale bar 2 μm; Anterior (A) left, Dorsal (D) up.
Figure 3.
Figure 3.. Examination of the architectural motifs underlying the distinct strata across development.
Visualization of (A-F) Stratum 1 (Red) and (G-L) Strata 3 and 4 (Blue and Green) reveal motifs that are preserved (Stratum 1) and change (Strata 3 and 4) across developmental contactomes (L1 to Adult, left to right, as indicated by labels on top). (B-F) Cropped view of Stratum 1 at each developmental stage showing a similar shape of two ‘horn-like’ clusters in the C-PHATE graphs (as seen by orange and blue shaded areas). These two clusters have similar neuronal memberships, which are largely invariant across developmental contactomes (Supplementary Table 3). (H-L) Cropped view of Strata 3 and 4 at each developmental stage highlighting differences in the organization and number of neurons contained in each of the Blue and Green strata, which is particularly distinct when comparing (H) L1 and (K) L4 (Supplementary Tables 5, 6).
Figure 4.
Figure 4.. Case study: AIML and PVQL neurons change clustering patterns across the developmental contactomes.
(A-E) C-PHATE plots across development, with the trajectories of IM neurons (in purple) and the rest of the spheres colored by stratum identity (see Figure 2). (F-G) Zoom in of the AIML and PVQL trajectories corresponding to larval Stage 1 (pre-AVF ingrowth) (A, dotted box) and in (G), Larval Stage 3 with AVFL/R present (C, dashed box). Note how the relationship between AIM and PVQ neurons in the C-PHATE graph varies for each of the examined contactomes across development. (Supplementary Figure 1, Supplementary Table 7). (H,I) simplified schematics of F and G based on neuron class.
Figure 5.
Figure 5.. Case Study: Visualization of contact profiles in individual neurons.
(A) Cartoon schematic of the head of the animal with the AIM neurons (purple) and pharynx (gray), and (dotted box) a 3-D reconstruction of the AIM neuron morphology from the L1 (0 hours post-hatching) dataset. (B) AIML and AIMR neurites rendered in 3D from L1. Note that we did not implement any surface smoothing methods to objects, so there might be gaps in the renderings. This was done intentionally, with the goal of producing the most accurate representation of the available data segmentation and avoid any rendering interpretations. (C) 3-D representation of all contacts onto the AIM neuron morphology in an L1 animal, colored based on contacting partner identity, as labeled (right) in the detailed inset (black box) region. (D) AIM-PVQ contacts (in orange) and AIM-AVF contacts (in green), projected onto the AIM neurons (light purple) across developmental stages and augmented for clarity in the figure (see non-augmented contacts in (Supplementary Figure 5). Scale bar 2 μm.
Figure 6.
Figure 6.. Case study: Segmented morphologies of AIM, PVQ and AVF across larval development.
(A) Cartoon schematic of the C. elegans head, pharynx (gray) and examined neurons with dashed black box representing the nerve ring region. (B) Schematic representation of the outgrowth path of the AVF neurons as observed by EM (Witvliet et al., 2021). Note that in development, AVFL and AVFR both grow along AIML and extend in parallel around the nerve ring. The distal end of the AVF neurite is highlighted with a green arrowhead in the schematic. (C) Neuronal morphologies of AIM (purple), PVQ (orange), AVF (green) across postembryonic development, as indicated, with green arrowhead pointing to AVF outgrowth tip. Scale bar = 2 μm. Regions for insets (L1, dotted box; L2, dashed box) correspond to (D). (D) Morphologies of these neurons (rotated to the posterior view) display the AVF neurons’ positions between the AIM and PVQ neurons at the L1 and L2 stage. Indicated outgrowth between neurons continues to the Adult stage (Supplementary Video 2). Note how AVF outgrowth alters contact between PVQ and AIM (Figure 5D).
Figure 7.
Figure 7.. Case study: AIM-PVQ and AIM-AVF synaptic positions across development.
(A) AIM-PVQ synaptic sites (dark orange arrowheads) and AIM-AVF synaptic sites (dark green arrowheads) in the segmented AIM neurons and reconstructed across postembryonic development from original connectomics data. Scale bar = 2 μm. (B) Schematic of the AIM, PVQ and AVF circuitry across development based on synaptic connectivity and focusing on the stage before AVF outgrowth (L1), during AVF outgrowth (L2) and Adult; arrow direction indicates pre to post synaptic connection, and arrow thickness indicates relative number of synaptic sites (finest, <5 synapses; medium, 5–10 synapses; thickest, 11–30 synapses). (C) Zoom in of synaptic sites (green) in the Adult connectome and embedded into the AIM neuron morphology (light purple). In NeuroSC, presynaptic sites are displayed as blocks and postsynaptic sites as spheres, and a scaling factor is applied to the 3-D models (Materials and Methods).
Figure 8.
Figure 8.. NeuroSC is a tool that enables integrated comparisons of neuronal relationships across development.
With NeuroSC, users have integrated access to: C-PHATE plots, 3-D morphological renderings, neuronal contact sites and synaptic representations. Through stage-specific C-PHATE renderings, users can explore neuronal relationships from high dimensional contactome data. (Top) On C-PHATE plots, schematized here, each sphere represents an individual neuron, or a group of neurons clustered together during algorithm iterations. (Right) 3D renderings of select neurons can be visualized in the context of the entire nerve ring or other circuits (gray). (Left) AIM contact sites at L1 and the same region showing synapses. Inset shows zoomed in of contacts and synapses - presynaptic sites (blocks) and postsynaptic sites (spheres). Data depicted here are from the L1 stage (0 hours post hatching).

References

    1. Altun Z F, Herndon L A, Wolkow C A, Crocker C, Lints R, Hall D H (ed s), WormAtlas; 2002. http://www.wormatlas.org.
    1. AU Duncan LH, AU Moyle MW, AU Shao L, AU Sengupta T, AU Ikegami R, AU Kumar A, AU Guo M, AU Christensen R, AU Santella A, AU Bao Z, AU Shroff H, AU Mohler W, AU Colón-Ramos DA. Isotropic Light-Sheet Microscopy and Automated Cell Lineage Analyses to Catalogue Caenorhabditis elegans Embryogenesis with Subcellular Resolution. JoVE. 2019. Jun; (148):e59533. https://www.jove.com/t/59533, doi: 10.3791/59533, publisher: MyJoVE Corp. - DOI - PMC - PubMed
    1. Barabási DL, Bianconi G, Bullmore E, Burgess M, Chung S, Eliassi-Rad T, George D, Kovács IA, Makse H, Nichols TE, Papadimitriou C, Sporns O, Stachenfeld K, Toroczkai Z, Towlson EK, Zador AM, Zeng H, Barabási AL, Bernard A, Buzsáki G. Neuroscience Needs Network Science. The Journal of Neuroscience: The Official Journal of the Society for Neuroscience. 2023. Aug; 43(34):5989–5995. doi: 10.1523/JNEUROSCI.1014-23.2023. - DOI - PMC - PubMed
    1. Boergens KM, Berning M, Bocklisch T, Bräunlein D, Drawitsch F, Frohnhofen J, Herold T, Otto P, Rzepka N, Werkmeister T, Werner D, Wiese G, Wissler H, Helmstaedter M. webKnossos: efficient online 3D data annotation for connectomics. Nature Methods. 2017; 14(7):691–694. https://www.nature.com/articles/nmeth.4331, doi: 10.1038/nmeth.4331, publisher: Nature Publishing Group. - DOI - PubMed
    1. Brittin CA, Cook SJ, Hall DH, Emmons SW, Cohen N. A multi-scale brain map derived from whole-brain volumetric reconstructions. Nature. 2021. Mar; 591(7848):105–110. doi: 10.1038/s41586-021-03284-x. - DOI - PMC - PubMed

Publication types

LinkOut - more resources