[Preprint]. 2024 Nov 4:2024.10.27.620464.
doi: 10.1101/2024.10.27.620464.

Foxi1 regulates multiple steps of mucociliary development and ionocyte specification through transcriptional and epigenetic mechanisms

Affiliations

Foxi1 regulates multiple steps of mucociliary development and ionocyte specification through transcriptional and epigenetic mechanisms

Sarah Bowden et al. bioRxiv. .

Abstract

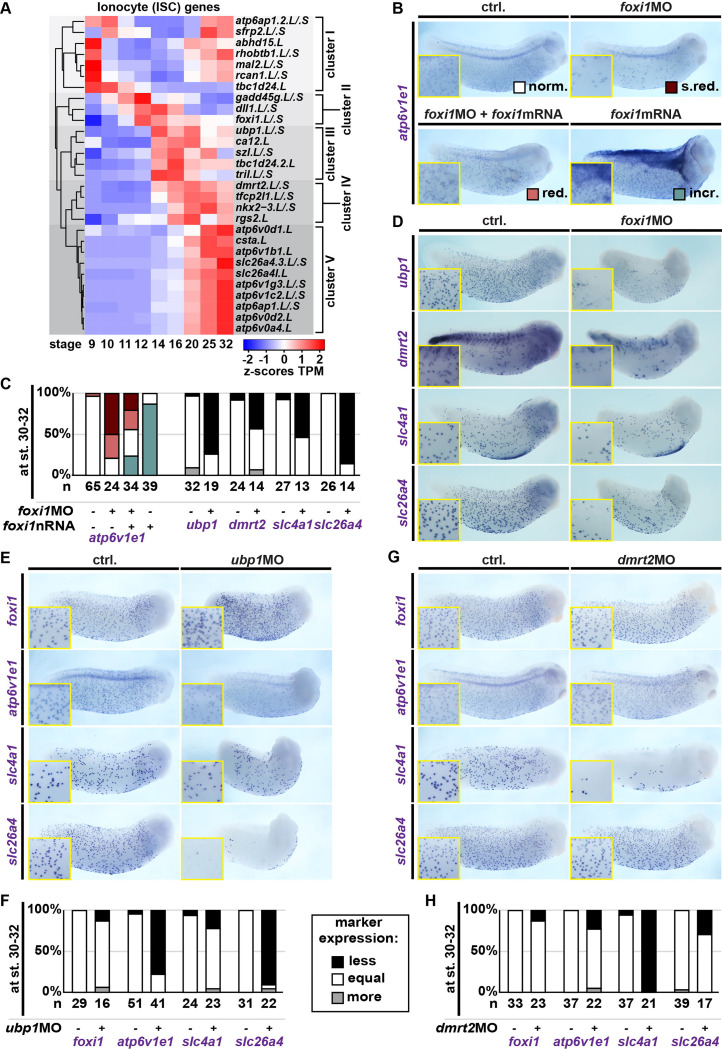
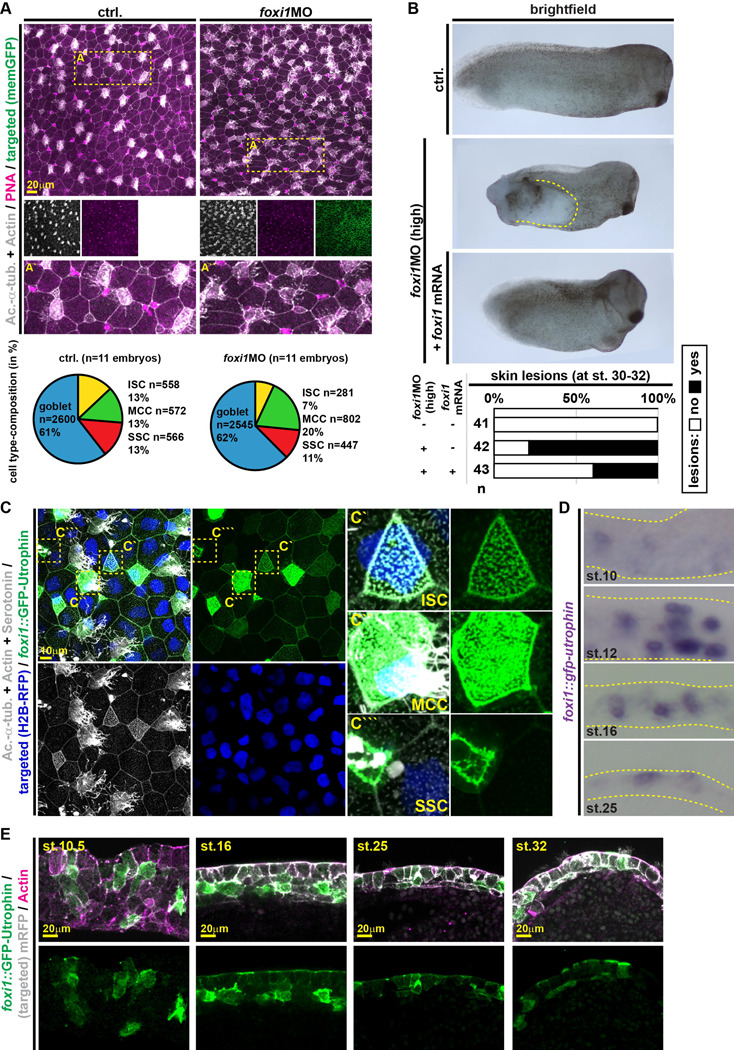
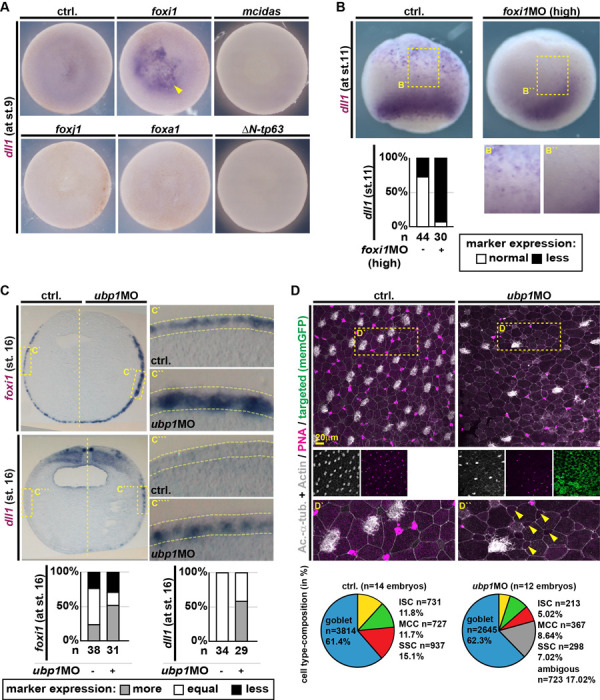
Foxi1 is a master regulator of ionocytes (ISCs / INCs) across species and organs. Two subtypes of ISCs exist, and both α- and β-ISCs regulate pH- and ion-homeostasis in epithelia. Gain and loss of FOXI1 function are associated with human diseases, including Pendred syndrome, male infertility, renal acidosis and cancers. Foxi1 functions were predominantly studied in the context of ISC specification, however, reports indicate additional functions in early and ectodermal development. Here, we re-investigated the functions of Foxi1 in Xenopus laevis embryonic mucociliary epidermis development and found a novel function for Foxi1 in the generation of Notch-ligand expressing mucociliary multipotent progenitors (MPPs). We demonstrate that Foxi1 has multiple concentration-dependent functions: At low levels, Foxi1 confers ectodermal competence through transcriptional and epigenetic mechanisms, while at high levels, Foxi1 induces a multi-step process of ISC specification and differentiation. We further describe how foxi1 expression is affected through auto- and Notch-regulation, how Ubp1 and Dmrt2 regulate ISC subtype differentiation, and how this developmental program affects Notch signaling as well as mucociliary patterning. Together, we reveal novel functions for Foxi1 in Xenopus mucociliary epidermis formation, relevant to our understanding of vertebrate development and human disease.

Keywords: Xenopus epidermis; development; ionocytes; mucociliary; multipotent progenitors.


Figures

Figure 1:
Figure 1:. Foxi1, Ubp1 and Dmrt2 differentially regulate ionocyte development
(A) Temporal expression analysis of core ISC genes. Heatmap of line-normalized z-scores of TPMs (transcripts per million reads) derived from mRNA-seq of Xenopus mucociliary organoids over the course of development (st. 9 – 32). (B-G) Knockdown of ISC transcription factors (foxi1 MO, ubp1 MO, dmrt2 MO) and analysis of effects by WMISH at st. 29 – 32 against atpv1e1 and foxi1 (pan-ISC markers), ubp1 and slc25a4/pendrin (β-ISC markets), and dmrt2 and slc4a1/ae1 (α-ISC markers). Representative images (B,D,E,G) and quantification (C, F, H) of results. n = number of embryos analyzed per condition. Rescues (co-injection of foxi1 mRNA) depicted in (B,C) were scored as normal (norm.), reduced (red.), strongly reduced (s.red.) and increased (incr.). Color code is shown in (B). In conditions depicted in (D, E, G), expression levels were scored as less, more or equal expression as compared to the uninjected control side. Color code is shown in (F).
Figure 2:
Figure 2:. Foxi1 acts in a concentration-dependent manner to specify multipotent progenitors
(A) Immunofluorescence confocal micrographs (IF) from control (ctrl.) and foxi1 morphants (foxi1 MO; low concentration) at st. 32 stained for Acetylated-α-tubulin (Ac.- α-tub., cilia, grey), F-actin (Actin, cell borders and morphology, grey), and mucus (PNA, magenta). Targeted cells were identified by membrane GFP expression (memGFP, green). Location of insets is indicated by dashed yellow box in upper panels. Quantification of cell type composition is depicted as pie-charts, goblet cells (blue), ISCs (yellow), MCCs (green) and SSCs (red). n embryos (above chart) and n quantified cells (in/left of chart). (B) Brightfield images and quantification of st. 30–32 embryos. Uninjected controls (ctrl.), foxi1 morphants (foxi1 MO; high concentration) and morphants co-injected with foxi1 mRNA (rescue) are depicted. Skin lesions (dashed yellow outline) were quantified. (C,D,E) Analysis of foxi1::gfp-utrophin reporter (green) injected embryos by IF (C,E) and WMISH against gfp (D). (C) IF for Acetylated-α-tubulin (Ac.-α-tub., cilia, grey), F-actin (Actin, cell borders and morphology, grey), and serotonin (SSCs, grey) at st. 32. Targeted cells were identified by nuclear RFP expression (H2B-RFP, blue). Magnifications of intercalating GFP(+) cell types are shown in insets. Location of insets is indicated by dashed yellow boxes in left panels. n = 12 embryos. (D) Sections of epidermal locations from embryos depicted in Fig. S3C show gfp expressing cells in the epidermis at key stages of mucociliary development (st. 10, 16, 25, 32). st. 10 n = 19; st. 12 n = 16 ; st. 16 n = 14 ; st. 25 n = 14 embryos. (E) IF for foxi1::gfp-utrophin reporter (green) and F-actin (Actin, cell borders and morphology, magenta) at st. 10.5 – 32 on hemistected embryos. Targeted cells were identified by membrane RFP expression (mRFP, grey). Additional stages and full images shown in Fig. S4A. st. 10.5 n = 4; st. 16 n = 6; st. 25 n = 4; st. 32 n = 5 embryos.
Figure 3:
Figure 3:. Foxi1 induces and Ubp1 terminates Notch ligand expression
(A,B,C) Manipulation of mucociliary cell fate transcription factors foxi1 and ubp1 (ISCs/MPPs), mcidas and foxj1 (MCCs), foxa1 (SSCs) and ΔN-tp63 (basal cells) and analysis of effects by WMISH at st. 9 (A), st. 11 (B) and st. 16 (C) against dll1 (Notch ligand) and foxi1 (MPP/ISC marker). (A) Representative images of control (ctrl.) and manipulated embryos (animal views) after mRNA overexpression of transcription factors to test premature induction of dll1. Quantification of results and effects on dlc are shown in Fig. S4C. Embryos were scored as induced or non-induced expression. (B) Representative images of control (ctrl.) and foxi1 morphants (foxi1 MO) (ventral views) to test effects on dll1 expression. Quantification of results is shown in lower panel. Locations of insets are indicated by dashed yellow box in upper panels. Embryos were scored as normal or reduced (less) expression of dll1. (C) Representative images of section embryos after unilateral knockdown of ubp1 (ubp1 MO). Expression of markers was scored as more, less or equal to uninjected control (ctrl.) side. Locations of insets are indicated by dashed yellow box in left panels. (D) IF of control (ctrl.) and ubp1 morphants (ubp1 MO) at st. 32 stained for Acetylated-α-tubulin (Ac.-α-tub., cilia, grey), F-actin (Actin, cell borders and morphology, grey), and mucus (PNA, magenta). Targeted cells were identified by membrane GFP expression (memGFP, green). Location of insets is indicated by dashed yellow box in upper panels. Quantification of cell type composition is depicted as pie-charts, goblet cells (blue), ISCs (yellow), MCCs (green) and SSCs (red). n embryos (above chart) and n quantified cells (in/left of chart).
Figure 4:
Figure 4:. Foxi1 regulates its own expression
(A) IF of embryos injected with foxi1::gfp-utrophin (n = 12 embryos) or foxi1Δ1::gfp-utrophin (n = 12 embryos) reporters (green) at st. 32 stained for Acetylated-α-tubulin (Ac.-α-tub., cilia, grey), F-actin (Actin, cell borders and morphology, grey), and serotonin (SSCs, grey) at st. 32. Targeted cells were identified by nuclear RFP expression (H2B-RFP, blue). Right panels show false-color of GFP fluorescence intensity. (B) Brightfield and epifluorescence images of hemisected st. 11 gastrula embryos injected vegetally with foxi1::gfp-utrophin (green), membrane RFP (memRFP; magenta) as control (memRFP) or with additional co-injection of foxi1 mRNA (foxi1 + memRFP). Right panels show false-color of GFP fluorescence intensity. Induction was scored as positive when GFP was detected in areas below the equator (mesendoderm). Ctrl. n = 7 induced, 26 non-induced; foxi1 mRNA = 26 induced, 11 non-induced.
Figure 5:
Figure 5:. Foxi1 regulates mucociliary epidermal competence through epigenetic means
(A) Profiles of ATAC-Seq normalized accessibility around peak center ±1 kb in controls (ctrl.) and foxi1 morphant (foxi1MO) organoids. (B) Venn diagram of peaks present in uninjected organoids (grey) and foxi1 MO-injected organoids (purple). (C) Top 15 transcription factor binding motifs predicted in sets of peaks with lost, maintained or gained accessibility after foxi1 MO. (D) Distribution of accessible regions around epidermal genes krt12.4 and dll1. Lost, maintained and gained tracks as generated by MACS2 bdgdiff analysis and visualized in IGV. Turquoise track = control (ctrl.) and purple track = morphant (foxi1 MO). n = 2 organoids per condition and replicate. 3 replicates.

Similar articles

References

    1. Afouda B.A., Ciau-Uitz A., and Patient R.. 2005. GATA4, 5 and 6 mediate TGFbeta maintenance of endodermal gene expression in Xenopus embryos. Development. 132:763–774. - PubMed
    1. Aztekin C., Hiscock T.W., Marioni J.C., Gurdon J.B., Simons B.D., and Jullien J.. 2019. Identification of a regeneration-organizing cell in the Xenopus tail. Science. 364:653–658. - PMC - PubMed
    1. Blomqvist S.R., Vidarsson H., Fitzgerald S., Johansson B.R., Ollerstam A., Brown R., Persson A.E., Bergstrom G.G., and Enerback S.. 2004. Distal renal tubular acidosis in mice that lack the forkhead transcription factor Foxi1. J Clin Invest. 113:1560–1570. - PMC - PubMed
    1. Blomqvist S.R., Vidarsson H., Soder O., and Enerback S.. 2006. Epididymal expression of the forkhead transcription factor Foxi1 is required for male fertility. EMBO J. 25:4131–4141. - PMC - PubMed
    1. Briggs J.A., Weinreb C., Wagner D.E., Megason S., Peshkin L., Kirschner M.W., and Klein A.M.. 2018. The dynamics of gene expression in vertebrate embryogenesis at single-cell resolution. Science. 360. - PMC - PubMed

Publication types