[Preprint]. 2024 Oct 25:2024.10.24.616714.
doi: 10.1101/2024.10.24.616714.

Site of breast cancer metastasis is independent of single nutrient levels

Affiliations

Site of breast cancer metastasis is independent of single nutrient levels

Keene L Abbott et al. bioRxiv. .

Abstract

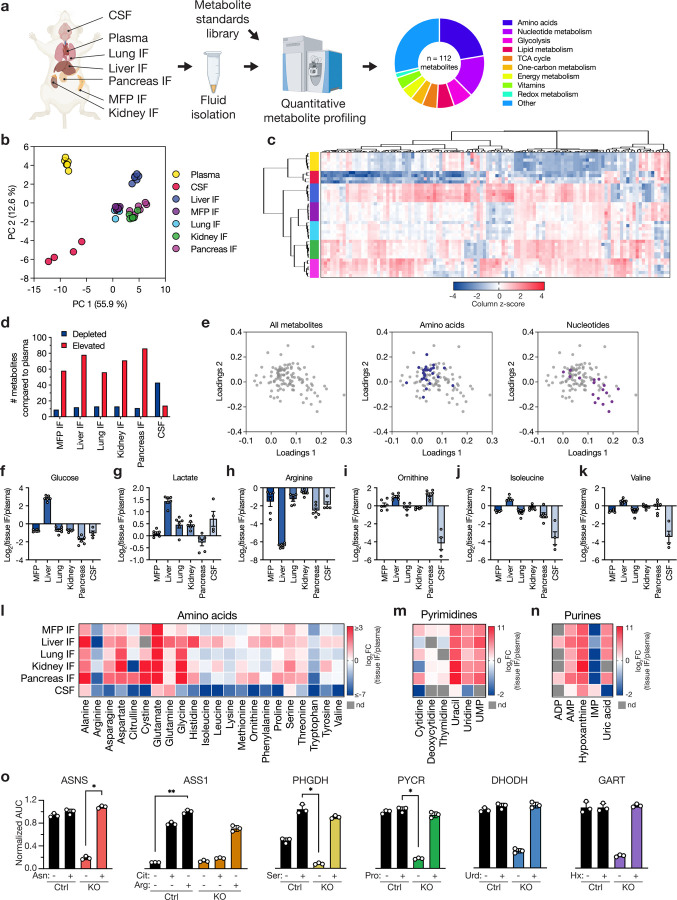
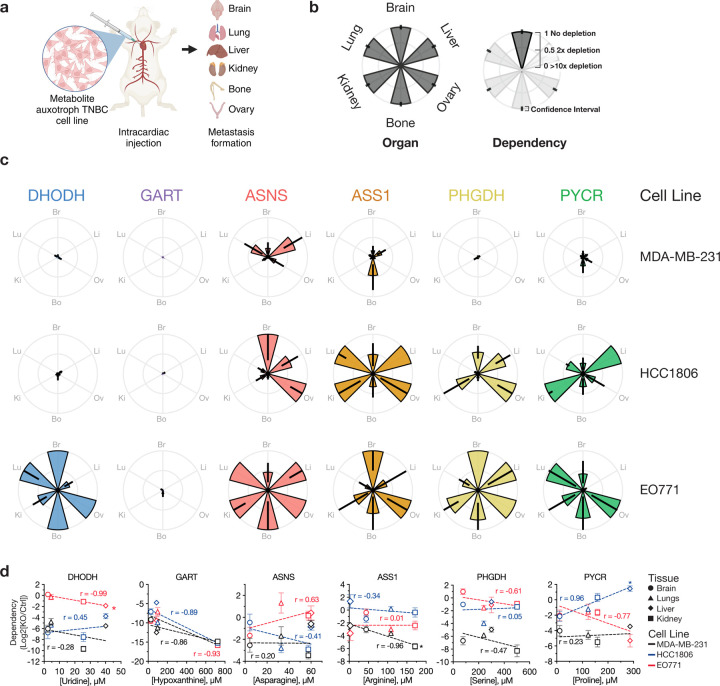
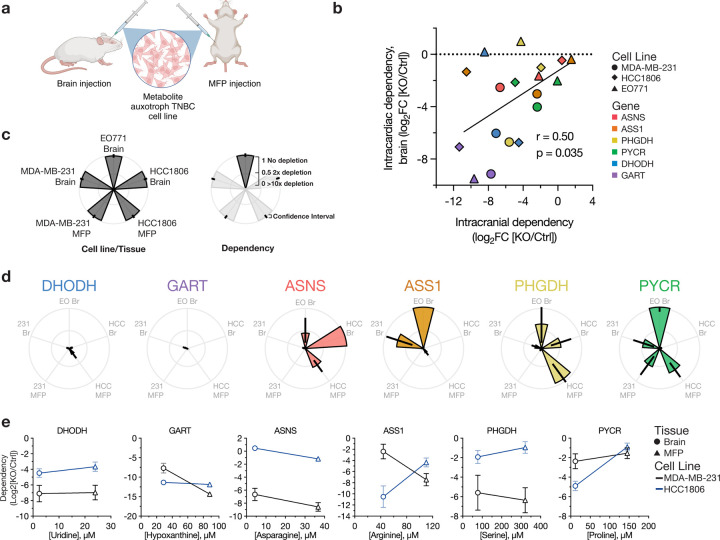
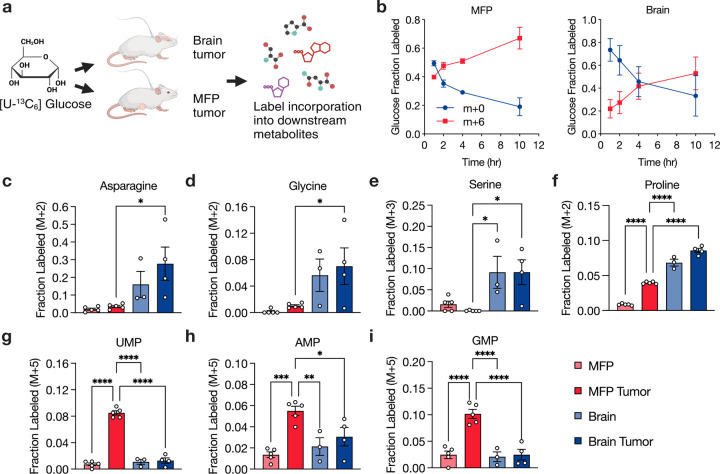
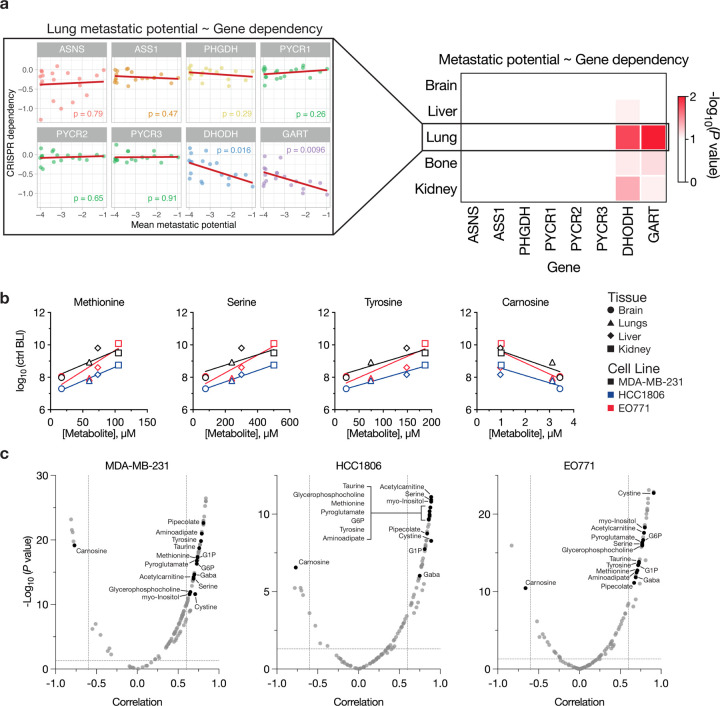
Cancer metastasis is a major contributor to patient morbidity and mortality1, yet the factors that determine the organs where cancers can metastasize are incompletely understood. In this study, we quantify the absolute levels of over 100 nutrients available across multiple tissues in mice and investigate how this relates to the ability of breast cancer cells to grow in different organs. We engineered breast cancer cells with broad metastatic potential to be auxotrophic for specific nutrients and assessed their ability to colonize different organs. We then asked how tumor growth in different tissues relates to nutrient availability and tumor biosynthetic activity. We find that single nutrients alone do not define the sites where breast cancer cells can grow as metastases. Additionally, we identify purine synthesis as a requirement for tumor growth and metastasis across many tissues and find that this phenotype is independent of tissue nucleotide availability or tumor de novo nucleotide synthesis activity. These data suggest that a complex interplay of multiple nutrients within the microenvironment dictates potential sites of metastatic cancer growth, and highlights the interdependence between extrinsic environmental factors and intrinsic cellular properties in influencing where breast cancer cells can grow as metastases.


Conflict of interest statement

Competing Interests R.F. consulted for Lime Therapeutics during this study, unrelated to the work presented. G.M.C. is a co-founder of Editas Medicine and has other financial interests listed at: https://arep.med.harvard.edu/gmc/tech.html. R.K.J. received consultant/SAB fees from DynamiCure, SPARC, SynDevRx; owns equity in Accurius, Enlight, SynDevRx; served on the Board of Trustees of Tekla Healthcare Investors, Tekla Life Sciences Investors, Tekla Healthcare Opportunities Fund, Tekla World Healthcare Fund, and received Research Grants from Boehringer Ingelheim and Sanofi; no funding or reagents from these organizations were used in the study. M.G.V.H. discloses that he is a scientific advisor for Agios Pharmaceuticals, iTeos Therapeutics, Sage Therapeutics, Pretzel Therapeutics, Lime Therapeutics, Faeth Therapeutics, Droia Ventures, MPM Capital and Auron Therapeutics. All remaining authors declare no competing interests.

Figures

Fig. 1:
Fig. 1:. Nutrient levels in tissue interstitial fluid, plasma, and CSF from mice.
a, Schematic depicting the isolation and quantification of metabolites from plasma, cerebrospinal fluid (CSF), and tissue interstitial fluids (IF) from female NOD-SCID-gamma (NSG) mice. Metabolites in these fluid samples were measured using LC/MS, with quantification performed alongside a dilution series of chemical standards. In total, 112 metabolites were identified and quantified across the different samples. MFP: mammary fat pad. b-c, Principal component analysis (PCA) (b) or hierarchical clustering (c) of metabolites measured in tissue IF samples, plasma, and CSF. Data represent n = 6 (plasma, kidney IF, liver IF, lung IF, MFP IF, pancreas IF) or n = 4 (CSF) biological replicates. Data presented within each column of the heatmap were z score normalized. d, Bar plot showing the number of metabolites with significantly lower (depleted) or higher (elevated) concentrations in each tissue IF or CSF relative to plasma. A fold change of 2 and a raw p-value of 0.05 assuming unequal variance were used to select significantly altered metabolites based on a t-test analysis. e, Loadings plot presenting the contribution of individual metabolites to the PCA components in (b). Metabolites are colored according to their assignment to amino acid or nucleotide metabolism pathways as indicated. f-k, log2 fold change in the indicated metabolite concentrations measured in each tissue IF or CSF relative to plasma. Data are presented as mean ± SEM and represent n = 6 (kidney IF, liver IF, lung IF, MFP IF, pancreas IF) or n = 4 (CSF) biological replicates. l-n, Heatmaps depicting the average log2 fold change in the indicated metabolite concentrations measured in each tissue IF or CSF relative to plasma. Scale bars provided for each group indicate the ranges of values shown. o, Area under the curve (AUC) values derived from proliferation curves for MDA-MB-231 control or knockout (KO) cells cultured with or without the relevant rescue metabolites presented in Extended Data Fig. 5. AUC values were normalized to the control cell line treated with the relevant rescue metabolite. Data are mean ± SD and represent n = 3 biological replicates and statistical analysis was performed using a Kruskal-Wallis test with Dunn’s multiple comparisons test (*p < 0.05, **p < 0.01). Arg: arginine; Cit: citrulline; Ser: serine; Pro: proline; Urd: uridine; Hx: hypoxanthine. PYCR represents PYCR1, 2, and 3 triple KO.
Fig. 2:
Fig. 2:. Intracardiac implantation to determine where metabolite auxotrophs can grow as metastases.
a, Schematic illustrating intracardiac injection of auxotroph and control cells to determine site of metastasis. Both control and auxotrophic cell lines, engineered to express firefly luciferase (Fluc), were injected into the left ventricle of mice, allowing for metastatic spread to various tissues including the brain, liver, lungs, ovaries, bones, and kidneys/adrenal glands. Metastatic colonization was quantified by measuring bioluminescence in harvested tissues at the experimental endpoint. MDA-MB-231-Fluc and HCC1806-Fluc cells were injected into NSG mice, and EO771-Fluc cells were injected into C57BL/6J mice. b, Description of petal plots to show the metastatic patterns of metabolite auxotroph cells relative to control cells. Each petal represents a specific tissue, with the length indicating the relative growth of tumors from each metabolite auxotroph cell line compared to control cells. c, Petal plots showing the metastatic distributions of different metabolite auxotroph cells relative to control cells. Data are presented as mean ± 95% confidence interval. Raw data used to derive dependency values and number of mice per experimental group are presented in Extended Data Fig. 7–8. d, Scatter plots correlating the concentration of relevant metabolites in tissue interstitial fluids with the dependency of each cell lines (black, MDA-MB-231; blue, HCC1806; red, EO771) on the corresponding metabolic genes for metastatic growth in that tissue. The x-axis shows the tissue metabolite concentration relevant to each auxotroph, while the y-axis displays the dependency as a log2 fold change of knockout (KO) compared to control (Ctrl). Symbols denote the metabolite concentration in specific tissues, with brain values derived from CSF measurements. Data represent mean ± SEM, and the raw data used to derive dependency values involve the number of mice per experimental group presented in Extended Data Fig. 7–8. Pearson correlation coefficients (r) and p-values are provided to assess statistical significance (*p < 0.05). PYCR represents PYCR1, 2, and 3 triple KO.
Fig. 3:
Fig. 3:. Assessing metabolic dependencies of brain and MFP tumors.
a, Schematic illustrating use of direct implantation of auxotrophs and control cells into brain and mammary fat pat (MFP) to assess metabolic dependencies. Both control and auxotrophic cell lines, engineered to express Gaussia luciferase (Gluc), were injected into the brain or MFP of mice, then tumor growth monitored over time via blood luminescence. MDA-MB-231-Gluc and HCC1806-Gluc cells were injected into NOD-SCID-gamma mice, and EO771-Gluc cells were injected into C57BL/6J mice. b, Scatter plot correlating the dependency of cell lines on specific metabolic genes for metastasis to the brain based on route of cell delivery into mice. The x- and y-axes show the average dependency values as a log2 fold change of knockout (KO) compared to control (Ctrl) cells introduced into mice via intracranial or intracardiac injections, respectively. The number of mice per experimental group are indicated in Extended Data Fig. 7–8 and Extended Data Fig. 10. r and p-values were determined by Pearson correlation. c, Description of petal plots to show the tumor growth patterns of metabolite auxotroph cells. Each petal represents a specific cell line and tumor, with the length indicating the relative growth of tumors from each metabolite auxotroph cell line compared to control cells. d, Petal plots showing tumor growth of different metabolite auxotroph cells relative to control cells. Data are presented as mean ± 95% confidence interval. Raw data used to derive dependency values and number of mice per experimental group are presented in Extended Data Fig. 10. e, Scatter plots illustrating the relationship between the concentrations of relevant metabolites in MFP interstitial fluid and CSF, representing brain metabolite levels, and the dependency of cell lines (black, MDA-MB-231; blue, HCC1806) on the corresponding metabolic genes for metastatic growth in each tissue site. The x-axis denotes the tissue metabolite concentration relevant for each metabolite auxotroph cell line, while the y-axis indicates the dependency as log2 fold change of each indicated KO relative to Ctrl. Symbols denote the metabolite concentration in specific tissues, with brain values derived from CSF measurements. Data represent mean ± SEM, and the raw data used to derive dependency values and number of mice per experimental group are presented in Extended Data Fig. 10. PYCR or PYCR KO represents PYCR1, 2, and 3 triple KO.
Fig. 4:
Fig. 4:. Assessment of metabolite fate in primary and brain metastatic breast cancers.
a, Schematic showing use of 13C-glucose (m+6) to assess metabolite fate in female NSG mice bearing MDA-MB-231 cell-derived tumors located either in the mammary fat pad (MFP) or brain. b, Fractional labeling of glucose in the plasma (m+0 or m+6) following infusion with [U-13C]-glucose at a rate of 0.4 mg/min for 10 hours in female NSG mice harboring either MFP or brain MDA-MB-231 tumors. Data points represent mean ± SEM for n = 5 (MFP tumor) or n = 4 (brain tumor) biological replicates. c-i, Fractional labeling of specific metabolites determined by LC/MS in cancerous tissues (MDA-MB-231 tumors in the brain and MFP) and corresponding noncancerous tissues (brain and MFP) from NSG mice infused with [U-13C]-glucose. Data points represent mean ± SEM for n = 5 (MFP tumor, MFP), 3 (noncancerous brain), and 4 (brain tumor) biological replicates. Statistical analysis was performed using an ordinary one-way ANOVA with Holm-Sidak’s multiple comparisons test (*p < 0.05, **p < 0.01, ***p < 0.001, ****p < 0.0001).
Fig. 5:
Fig. 5:. Correlating metabolic gene dependencies and metabolite levels with tissue-specific metastatic potential.
a, Left, scatter plots correlating the metastatic potential of breast cancer cell lines to the lung with in vitro CRISPR dependencies of the indicated genes. Each dot represents a cell line, and p-values derived from Pearson correlations are indicated within each plot. Right, heat map showing the -log10(p-values) from correlating metastatic potential of breast cancer cell lines to the indicated tissues with CRISPR dependency of the indicated genes. Data sourced from the Dependency Map portal. b, Scatter plots correlating the concentration of relevant metabolites in tissue interstitial fluids with the metastatic potential of control (ctrl) cells (black, MDA-MB-231; blue, HCC1806; red, EO771) following intracardiac injection. Symbols denote the metabolite concentration measured in specific tissues, with brain values derived from CSF measurements. Data represent mean ± SEM, and the raw data used to derive metastatic potential values are presented in Extended Data Fig. 7–8. For all graphs, |Pearson correlation, r| > 0.6 and p-values < 0.0001. c, Volcano plots depicting the Pearson correlation values and p-values for metabolites correlated with metastatic potential of control cell lines following intracardiac injection. Black circles indicate metabolites that are significantly correlated in all three cell lines tested in this study. Cutoffs of |Pearson correlation, r| > 0.6 and p-values < 0.05 were used to select significantly correlated metabolites. G6P: Glucose-6-phosphate; G1P: Glucose-1-phosphate.

References

    1. Boire A. et al. Why do patients with cancer die? Nat Rev Cancer 24, 578–589 (2024). - PMC - PubMed
    1. Lyssiotis C. A. & Kimmelman A. C. Metabolic Interactions in the Tumor Microenvironment. Trends in Cell Biology 27, 863–875 (2017). - PMC - PubMed
    1. Elia I., Doglioni G. & Fendt S.-M. Metabolic Hallmarks of Metastasis Formation. Trends Cell Biol 28, 673–684 (2018). - PubMed
    1. Teoh S. T. & Lunt S. Y. Metabolism in cancer metastasis: bioenergetics, biosynthesis, and beyond. Wiley Interdiscip Rev Syst Biol Med 10, (2018). - PubMed
    1. Faubert B., Solmonson A. & DeBerardinis R. J. Metabolic reprogramming and cancer progression. Science 368, eaaw5473 (2020). - PMC - PubMed

Publication types

LinkOut - more resources