[Preprint]. 2024 Oct 29:2024.10.22.619677.
doi: 10.1101/2024.10.22.619677.

Phenotypic landscape of a fungal meningitis pathogen reveals its unique biology

Affiliations

Phenotypic landscape of a fungal meningitis pathogen reveals its unique biology

Michael J Boucher et al. bioRxiv. .

Update in

  • Phenotypic landscape of an invasive fungal pathogen reveals its unique biology.
    Boucher MJ, Banerjee S, Joshi MB, Wei AL, Nalley MJ, Huang MY, Lei S, Ciranni M, Condon A, Langen A, Goddard TD, Caradonna I, Goranov AI, Homer CM, Mortensen Y, Petnic S, Reilly MC, Xiong Y, Susa KJ, Pastore VP, Zaro BW, Madhani HD. Boucher MJ, et al. Cell. 2025 Jul 24;188(15):4003-4024.e24. doi: 10.1016/j.cell.2025.05.017. Epub 2025 Jun 11. Cell. 2025. PMID: 40505656

Abstract

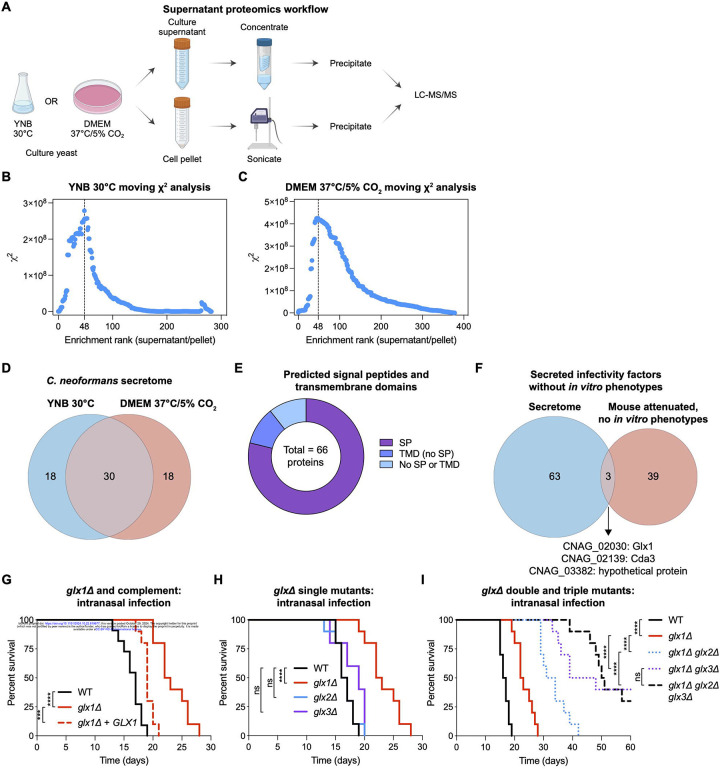
Cryptococcus neoformans is the most common cause of fungal meningitis and the top-ranked W.H.O. priority fungal pathogen. Only distantly related to model fungi, C. neoformans is also a powerful experimental system for exploring conserved eukaryotic mechanisms lost from specialist model yeast lineages. To decipher its biology globally, we constructed 4328 gene deletions and measured-with exceptional precision--the fitness of each mutant under 141 diverse growth-limiting in vitro conditions and during murine infection. We defined functional modules by clustering genes based on their phenotypic signatures. In-depth studies leveraged these data in two ways. First, we defined and investigated new components of key signaling pathways, which revealed animal-like pathways/components not predicted from studies of model yeasts. Second, we identified environmental adaptation mechanisms repurposed to promote mammalian virulence by C. neoformans, which lacks a known animal reservoir. Our work provides an unprecedented resource for deciphering a deadly human pathogen.


Figures

Figure 1.
Figure 1.. Construction and fitness profiling of a genome-scale deletion library.
(A) Overview of deletion library construction and pooled in vitro screening. (B) Correlation of KO-seq mutant abundance measurements in replicate YNB cultures. (C) Rank-ordered plot of relative mutant fitness in YNB minimal medium relative to YPAD rich medium. Dashed lines indicate relative fitness scores of −2.0 and 2.0 that were used to define phenotypes. Auxotrophic mutants are highlighted. (D) Phenotypic map. Mutant fitness was measured in 158 growth experiments encompassing 141 unique in vitro conditions and 1 in vivo condition. Heatmap shows relative fitness scores calculated from endpoint mutant abundances in treated versus same-day control cultures. Data were filtered to show only the 1909 mutants exhibiting at least one condition with relative fitness score ≤ −2.0 or ≥ 2.0 and were clustered based on the centered Pearson correlation (average linkage). (E) Mutant cofitness matrix. Pearson correlation coefficients of phenotypic profiles were calculated and clustered based on the Euclidean distance (centroid linkage). Manually identified clusters are indicated.
Figure 2.
Figure 2.. Insights into a Hedgehog-like pH sensing pathway.
(A) Diagram of the Rim101 pH sensing pathway in C. neoformans. (B) Rim101 pathway cluster. (C) Phenotypic profile of Rim101 pathway members. (D) Western blot assaying proteolytic processing of endogenously tagged 2xFLAG-mNG-CBP-Rim101 in unbuffered medium or at pH 8.0. Asterisk indicates nonspecific band. (E) Live confocal imaging of endogenously tagged 2xFLAG-CBP-mNG-Rim101 in SC medium buffered to pH 4.0 or 8.0 with McIlvaine’s buffer. (F) Spot dilution assay assessing rescue of Rim101 pathway mutants by expression of a truncated Rim101 allele. Images were taken after 3 days of growth. (G) Live confocal imaging of endogenously tagged Rim23–2xmNG-CBP-2xFLAG in SC medium buffered to pH 4.0 or 8.0 with McIlvaine’s buffer. (H) Live confocal imaging of endogenously tagged Rra2–2xmNG-CBP-2xFLAG in SC medium buffered to pH 4.0 or 8.0 with McIlvaine’s buffer. (I) Rra2 AP-MS at pH 8. YPAD cultures of yeast expressing endogenously tagged Rra2–2xmNG-CBP-2xFLAG were shifted to pH 8 for 1 hour, and anti-FLAG AP-MS was performed on membrane extracts. Data represent the protein-level ratio of normalized MS1 area from tagged versus untagged strains grown and processed in parallel. Averaged from 2 biological replicates. See also Figure S3E. (J) AlphaFold2-multimer model of predicted Rra1-Rra2 tetramer. See also Figure S3F–H. Confidently predicted protein segments are displayed. (K) Inset from (J) showing a predicted Rra1H46-Rra1H46 hydrogen bond. (L) Western blot assaying proteolytic processing of endogenously tagged 2xFLAG-mNG-CBP-Rim101 in response to RRA1 alleles encoding His46 mutants. Asterisk indicates nonspecific band. See also Figure S3I.
Figure 3.
Figure 3.. Mammalian-like signaling pathways in C. neoformans.
(A) Diagram of calcineurin signaling pathway in C. neoformans. (B) Cch1-Mid1 cluster. (C) Phenotypic profile of Cch1-Mid1 cluster members. (D) Spot dilution assay assessing sensitivity of Cch1-Mid1 cluster mutants to FK506 at 30°C and 37°C. Images were taken after 2 days of growth. See also Figure S4A. (E) AlphaFold2-multimer model of predicted CNAG_06362-CNAG_01613 (Unc79-Unc80) dimer. See also Figure S4B. Confidently predicted protein segments are displayed. (F) Foldseek results from PDB100 database search with CNAG_01613 and CNAG_06362 AlphaFold2 models from (E). (G) Mid1, Unc79, and Unc80 AP-MS. Anti-FLAG AP-MS was performed on membrane extracts from strains expressing endogenous C-terminal mNG-CBP-2xFLAG tags on the indicated strains. Data represent the protein-level ratio of normalized MS1 area from tagged versus untagged strains grown and processed in parallel. Averaged from 2 biological replicates. (H) Diagram of DNA damage checkpoint signaling. (I) NHEJ cluster. (J) Phenotypic profile of NHEJ cluster members. (K) Rescue of Cas9-induced double-stranded breaks by a drug-resistance donor template with or without overhangs for HDR. The indicated strains were transformed with PCR products to express 1) Cas9; 2) an sgRNA targeting the ADE2 gene; and 3) a hygromycin B selection marker (HygR) with or without overhangs for HDR. See Figure S5B for diagram. Transformants were selected on YPD plates containing hygromycin B. Strains deficient in NHEJ are expected to repair the Cas9-induced double-stranded break when overhangs for HDR are supplied (top row) but not when they are omitted (bottom row). Pink/red colony color occurs due to accumulation of purine precursors in the absence of a functional ADE2 gene. (L) Njf1 AP-MS following Zeocin treatment. YPAD cultures of yeast expressing endogenously tagged Njf1-mNG-CBP-2xFLAG were treated with 500 μg/mL Zeocin for 2 hours, and anti-FLAG AP-MS was performed on clarified cell lysates. Data represent the protein-level ratio of normalized MS1 area from tagged versus untagged strains grown and processed in parallel. From 1 biological replicate. See also Figure S5C.
Figure 4.
Figure 4.. Pathogen functions that promote mammalian infection
(A) Schematic of in vivo fitness screens in a murine pulmonary infection model. Created with BioRender.com. (B) Identification of infectivity genes. Plot shows rank-ordered mutants based on relative in vivo fitness scores. Dashed lines indicate relative fitness scores of −2.0 and 2.0 that were used to define phenotypes. Depleted or enriched mutants are highlighted. (C) Comparison of infectivity genes identified in the KN99α strain in C57BL/6J mice by KO-seq (this study) with those identified in the H99C/CM018 strain in A/J mice by signature-tagged mutagenesis. (D) Repooling and retesting of infectivity mutants. Infectivity mutants from the primary screen were divided into 2 separate pools containing a constant set of 96 neutral mutants and were retested for in vivo fitness. Dashed lines indicate relative fitness scores of −2.0 and 2.0 that were used to define phenotypes. (E) Conservation levels and predicted domains of proteins encoded by 574 infectivity genes (left) and the 42 infectivity genes that lacked in vitro phenotypes (right). Outer circle represents the most specific conservation level for a protein based on OrthoMCL orthology groups. Inner circle indicates the presence or absence of bioinformatically predicted protein domains. (F) Overview of machine-learning based prediction of in vitro phenotypes predictive of in vivo fitness. (G) Normalized confusion matrix displaying average accuracy of model performance. (H) Feature importance (mean decrease in impurity; MDI) for the top 25 in vitro conditions predictive of in vivo fitness. Error bars represent standard deviation. Red bar represents median MDI across all 157 in vitro growth experiments.
Figure 5.
Figure 5.. Tetraspanin-containing hyaluronic acid synthase complex promotes neurovirulence.
(A) Cps1 cluster. (B) Phenotypic profile of Cps1 cluster members. (C) Cps1 AP-MS. Anti-FLAG AP-MS was performed on membrane extracts from a strain expressing endogenously tagged Cps1-mNG-CBP-2xFLAG. Data represent the protein-level ratio of normalized MS1 area from tagged versus untagged strains grown and processed in parallel. Averaged from 2 biological replicates. (D) AlphaFold2-multimer model of Cps1 cluster members. See also Figure S7A. (E) Live confocal imaging of endogenously tagged Cps1-mNG-CBP-2xFLAG. (F) ELISA assaying hyaluronic acid production from Cps1 cluster mutants. Bars represent mean values. (G) Survival of C57BL/6J mice infected intravenously (retroorbital inoculation) with 5 × 10⁴ CFUs of the indicated strains (n = 5–6 mice per group from 1 experiment). (H) Total brain CFUs 2 days post infection from mice infected intravenously (retroorbital inoculation) with 5 × 10⁴ CFUs of the indicated strains. Bars represent median values. WT, n = 17 mice pooled from 4 independent experiments with 3–6 mice per experiment; cps1Δ and cps1Δ + CPS1, n = 11 mice per group pooled from 3 independent experiments with 3–6 mice per experiment; tsp2Δ and tsp2Δ + TSP2, n = 12 mice per group pooled from 3 independent experiments with 3–6 mice per experiment; cps2Δ, cps2Δ + CPS2, and cps1Δ tsp2Δ cps2Δ, n = 6 mice per group pooled from 2 independent experiments with 3 mice per experiment. See also Figure S7B–D. Statistical analyses were performed with the Mantel-Cox test with Bonferroni correction for multiple hypotheses (G) and Kruskal-Wallis test with Dunn’s multiple comparisons test (H). *p < 0.05, **p < 0.01, ***p < 0.001, ****p < 0.0001.
Figure 6.
Figure 6.. Inducible virulence factor required for adaptation to host-like conditions.
(A) Phenotypic profile of the rgh1Δ mutant. (B) Rgh1 protein diagram. (C) qRT-PCR of RGH1 transcripts in yeast cultured in standard laboratory conditions (YPAD or YNB at 30°C) or tissue culture (DMEM at 37°C/5% CO2). Expression is relative to the YPAD condition. Error bars represent standard deviation. (D) Survival of C57BL/6J mice infected intranasally with 5 × 10⁴ CFUs of the indicated strains (n = 13 mice per group pooled from 3 experiments with 3–4 mice per experiment). (E and F) Total endpoint CFUs isolated from the lungs (E) and brains (F) of mice in (D). Bars represent median values; dashed line represents limit of detection. Mice with undetectable CFUs were plotted at the limit of detection. (G) Spot dilution assays assessing growth of the indicated strains in tissue culture conditions (DMEM, pH 7.4, 37°C/5% CO2) and when CO2, pH, growth medium, or temperature stresses were removed. Images were taken after 2 days of growth. (H) Schematic for rgh1Δ suppressor screen using a genome-wide CRISPR/Cas9 insertional mutagenesis approach. (I) Suppressor screen results. Graph compares gene-level β-scores (fitness) from two independent sgRNA library transformations grown as shown in (H). (J) Spot dilution assays assessing growth of the indicated strains in tissue culture conditions in the absence or presence of 1 M sorbitol. Images were taken after 3 days of growth. (K) Rgh1 AP-MS. Anti-FLAG AP-MS was performed on clarified cell lysates from a strain expressing endogenously tagged Rgh1–2xFLAG grown in DMEM, pH 7.4 at 37°C. Data represent the protein-level ratio of normalized MS1 area from tagged versus untagged strains grown and processed in parallel. Averaged from 2 biological replicates. Statistical analyses were performed with the Mantel-Cox test with Bonferroni correction for multiple hypotheses (C) and Kruskal-Wallis test with Dunn’s multiple comparisons test (D and E). *p < 0.05, **p < 0.01, ***p < 0.001, ****p < 0.0001.
Figure 7.
Figure 7.. Pathogen secreted proteins required for infectivity.
(A) Schematic of C. neoformans supernatant proteomics. Created with BioRender.com. (B, C) Moving χ2 analysis of proteins rank-ordered by enrichment in culture supernatants versus cell pellets in YNB at 30°C (B) or DMEM at 37°C/5% CO2 (C). Vertical dashed lines indicate maximum χ2 values used to set cutoffs for classifying proteins as secreted. (D) Overlap of secreted proteins identified from cultures grown in standard yeast growth conditions (YNB at 30°C) or in tissue culture (DMEM). (E) Predicted signal peptides and transmembrane domains in secreted proteins. (F) Overlap of secreted proteins identified with infectivity genes lacking in vitro phenotypes. (G-I) Survival of C57BL/6J mice infected intranasally with 5 × 10⁴ CFUs of the indicated strains. (G) n = 10–11 mice per group pooled from 2 experiments with 5–6 mice per experiment. (H) n = 10 mice per group pooled from 2 experiments with 5 mice per experiment. (I) n = 10 mice per group pooled from 2 experiments with 5 mice per experiment. Statistical analyses were performed with the Mantel-Cox test with Bonferroni correction for multiple hypotheses (G-I). ns, not significant, ***p < 0.001, ****p < 0.0001.

Similar articles

References

    1. Rajasingham R., Govender N.P., Jordan A., Loyse A., Shroufi A., Denning D.W., Meya D.B., Chiller T.M., and Boulware D.R. (2022). The global burden of HIV-associated cryptococcal infection in adults in 2020: a modelling analysis. Lancet Infect. Dis. 22, 1748–1755. 10.1016/s1473-3099(22)00499-6. - DOI - PMC - PubMed
    1. Denning D.W. (2024). Global incidence and mortality of severe fungal disease. Lancet Infect. Dis. 10.1016/s1473-3099(23)00692-8. - DOI - PubMed
    1. Brown G.D., Denning D.W., Gow N.A.R., Levitz S.M., Netea M.G., and White T.C. (2012). Hidden Killers: Human Fungal Infections. Science Translational Medicine 4, 165rv113. 10.1126/scitranslmed.3004404. - DOI - PubMed
    1. Fisher M.C., and Denning D.W. (2023). The WHO fungal priority pathogens list as a game-changer. Nature Reviews Microbiology 21, 211–212. 10.1038/s41579-023-00861-x. - DOI - PMC - PubMed
    1. WHO/UCN/HHS/SIA/2023.05 (2024). South Africa HIV Country Profile 2023.

Publication types

LinkOut - more resources