[Preprint]. 2024 Dec 16:2024.10.18.619115.
doi: 10.1101/2024.10.18.619115.

P23H rhodopsin aggregation in the ER causes synaptic protein imbalance in rod photoreceptors

Affiliations

P23H rhodopsin aggregation in the ER causes synaptic protein imbalance in rod photoreceptors

Samantha L Thompson et al. bioRxiv. .

Update in

Abstract

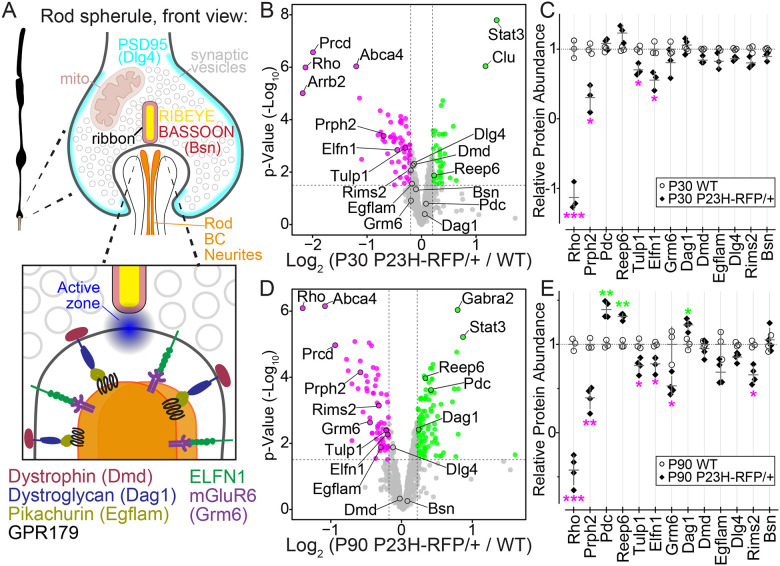
Rod photoreceptor neurons in the retina detect scotopic light through the visual pigment rhodopsin (Rho) in their outer segments (OS). Efficient Rho trafficking to the OS through the inner rod compartments is critical for long-term rod health. Given the importance of protein trafficking to the OS, less is known about the trafficking of rod synaptic proteins. Furthermore, the subcellular impact of Rho mislocalization on rod synapses (i.e., "spherules") has not been investigated. In this study we used super-resolution and electron microscopies, along with proteomics, to perform a subcellular analysis of Rho synaptic mislocalization in P23H-Rho-RFP mutant mice. We discovered that mutant P23H-Rho-RFP protein mislocalized in distinct ER aggregations within the spherule cytoplasm, which we confirmed with AAV overexpression. Additionally, we found synaptic protein abundance differences in P23H-Rho-RFP mice. By comparison, Rho mislocalized along the spherule plasma membrane in WT and rd10 mutant rods, in which there was no synaptic protein disruption. Throughout the study, we also identified a network of ER membranes within WT rod presynaptic spherules. Together, our findings indicate that photoreceptor synaptic proteins are sensitive to ER dysregulation.

Keywords: mislocalization; photoreceptors; retina; rhodopsin; super-resolution; synapse.


Conflict of interest statement

Competing interests The authors declare no competing or financial interests.

Figures

Figure 1.
Figure 1.. Mutant P23H-hRho-RFP protein is mislocalized within the cytoplasm of rod photoreceptor presynaptic spherules.
(A) Diagram depicting the layers of the mouse outer retina (RPE = retinal pigment epithelium, OS = outer segment, IS = inner segment, ONL = outer nuclear layer, OPL = outer plexiform layer) and the two types of rod spherules (R1, top; R2, bottom). Rod photoreceptors are black, and the cone photoreceptor is purple. Spherule illustrations were based on (Li et al., 2016). (B, C) Confocal z-projections of WT-RFP/+ and P23H-RFP/+ retinal cryosections at age (B) P30 and (C) P90. RFP fluorescence is magenta, and sections were co-stained with WGA to label OS membranes (green) and DAPI to label nuclei (blue). White arrows = mislocalized RFP in the P23H-RFP/+ OPLs. (D) SIM super-resolution z-projections with 3D deconvolution of the OPL from a P30 WT retina. In the images, RIBEYE (yellow) and PSD95 (cyan) immunolabeled rod spherules are aligned in the OPL above a cone pedicle (white arrowhead). No 1D4 Rho labeling (magenta) is present in the WT OPL. In single spherule examples, which are all sub-stack SIM z-projections, the RIBEYE+ ribbons are horseshoe-shaped structures in the lower region of the spherules. (E, F) SIM images of the OPL in a P23H-RFP/+ retina at age P30 with the same immunolabeling as in (D). In (E) the left images include all labeling, and the right shows the 1D4 and RIBEYE channels without PSD95. Accumulations of 1D4 immunolabeling in the OPL were localized near the synaptic ribbons (white arrows). (F) Single spherule SIM examples in P23H-RFP/+ P30 retinas. 1D4+ Rho accumulations are localized in the cytoplasm of the spherules, typically above the ribbon. In the second SIM + 3D decon. image, a gap in the aggregated 1D4+ fluorescence is indicated with a white asterisk. The far-right example is a R2-type mutant spherule with 1D4 fluorescence that surrounds the nucleus (magenta arrows) and extends into the spherule cytoplasm. (G) SIM images of P23H-RFP/+ retinas at age P90 with the same immunolabeling as (D-F). Images of the OPL with and without PSD95 show 1D4+ OPL accumulations (white arrows) similar to those at P30. In single spherule examples, cytoplasmic 1D4+ aggregates surround gaps in fluorescence (white asterisk). (H, I) SIM z-projection images of (H) P30 WT and (I) P30 P23H-RFP/+ retinas immunolabeled for Sec61β (ER-marker, magenta), PSD95 (cyan), and BASSOON (yellow). Sec61β is localized throughout the layers of the photoreceptors (left), and in magnified images, the PSD95 rod spherule border is annotated in select rod spherules to demonstrate Sec61β+ ER fluorescence within individual WT and P23H-RFP/+ rod spherules (white arrowheads). In the P23H-RFP/+ image in (G), ER aggregations are labeled with yellow arrows. Throughout the figure scale bars match adjacent images when not labeled.
Figure 2.
Figure 2.. P23H-Rho-RFP mislocalization does not cause ultrastructural defects in rod synaptic ribbons.
(A) TEM images of WT rod spherules at P30. Middle image is the annotated version of the left image (magenta asterisk = mitochondrion, cyan = spherule plasma membrane, yellow = synaptic ribbon, green arrowhead = endocytosed vesicles). In the right image, ER-like membranes (orange arrows) are wrapped around the mitochondrion. (B) TEM image of a P23H-RFP/+ rod spherule at P30. ER-like membrane stacks (orange arrow) are localized near the mitochondrion (indicated with a magenta asterisk in all panels) and extend into the cytoplasm. (C) Additional TEM images of P30 P23H-RFP/+ rod spherules with ER-like membrane stacks (orange arrow) associated with the spherule mitochondria. (D) TEM image of a P30 P23H-RFP/+ R2 rod spherule with ER membrane stacks (orange arrow) from the cell body cytoplasm extending into the cytoplasm of the spherule. (E) TEM images of P90 WT spherules with ER membranes (orange arrows) surrounding the mitochondria and extending into the spherule cytoplasm. (F) TEM image of a P90 P23H-RFP/+ spherule with expanded ER (orange arrow). (G, H) Magnified examples of ER-mitochondria contact sites (white arrows) in P23H-RFP/+ spherules at ages (G) P30 and (H) P90. ER membranes are traced in gold, the mitochondrial membranes are traced in magenta, and the plasma membranes are traced in cyan.
Figure 3.
Figure 3.. AAV overexpression of P23H-Rho and R135L-Rho in WT rods causes synaptic mislocalization.
Confocal images of retinal sections from WT mice transduced with AAVs for rod-specific expression of the following Rho fusions: (A) WT-hRho-RFP, (B) P23H-hRho-RFP, (C) WT-hRho-GFP, and (D) R135L-hRho-GFP. Images on left side show Rho fusion localization (magenta) in transduced rods with DAPI (blue) labeling. Right images show co-labeling with WGA (green) as a marker for OS membranes. Grayscale images are the Rho-GFP/RFP fusion channels only. Yellow arrows = mutant Rho fusion OPL mislocalization. (E, F) AAV infected retinal sections with rods overexpressing (E) WT-hRho-RFP or (F) WT-hRho-EGFP (magenta, yellow arrows). (G, H) SIM z-projection images of the OPL from 3-micron retinal cryosections from the same AAV conditions as in (A-D). Rho fusion fluorescence is (magenta), and PSD95 immunolabeling (cyan) was used to identify rod spherules. Single spherule examples (bottom) of each AAV-driven Rho fusion are shown with PSD95 co-labeling (left) and the Rho-RFP/EGFP signal only (right). In (G), white arrows indicate P23H-hRho-RFP cytoplasmic aggregates, and dashed gray lines outline the PSD95+ plasma membrane of the magnified spherules of interest. In (H), R135L-hRho-GFP mislocalization at the spherule plasma membrane (white arrowheads) and internally (yellow arrowheads) are indicated. (I, J) SIM z-projection images from thin 1-micron sections of retinas from the same AAV conditions as in (A-D). These sections were co-immunolabeled for 1D4 (magenta) and RIBEYE (yellow). White arrows = mutant Rho fusion accumulates near the synaptic ribbon. Single spherule examples from each AAV condition are enlarged below. (K) SIM super-resolution images of WT-hRho-RFP overloaded rod spherules. 1D4+ WT-hRho-RFP (magenta) was localized along the plasma membrane of the axon and spherule (white arrows) and was colocalized with the RIBEYE synaptic ribbons (yellow arrowheads). In the far-right example, 1D4+ WT-hRho-RFP appears to bud off from the presynaptic spherule (magenta arrow). (L) SIM images of WT-hRho-GFP AAV overloaded rod spherules. WT-hRho-GFP colocalizes with the PSD95+ rod spherule plasma membrane (white arrowheads) and localizes at the rod axon plasma membrane (white arrows).
Figure 4.
Figure 4.. Photoreceptor and synaptic protein abundance changes are found in P23H-RFP/+ retinas with TMT-MS proteomics.
(A) Diagram of the front view of a rod spherule and a magnified view of the active zone and the synaptic cleft to highlight the approximate localizations of rod synaptic proteins including key trans-synaptic protein complexes. (B) Volcano plot of TMT-MS relative peptide abundances for select photoreceptor and synaptic proteins (based on Gene Ontology Cellular Component classification, see Methods) in age P30 P23H-RFP/+ vs WT retinas. X axis = Log2 fold change values with a significance threshold of 0.2, Y-axis = p-values (-Log10) with a significance threshold of 1.5. Green points represent protein targets above the thresholds and magenta points are targets below the thresholds. Annotated protein names are based on FASTA gene names. (C) Linear scale graph of select relative protein abundances from the P30 TMT-MS data in Fig. S3B. WT (open circles) were normalized to 1 and superimposed with P23H-RFP/+ values (black diamonds). Magenta asterisks = significant downregulation, and green asterisks = significant upregulation. (D) TMT-MS volcano plot comparing relative peptide abundances in age P90 P23H-RFP/+ and WT retinas for the same protein list and plot parameters as in (B). (E) Linear scale graph of select relative protein abundances from the P90 TMT-MS data in Fig S3B with the same normalization and formatting as in (C).
Figure 5.
Figure 5.. Quantitative confocal imaging analysis of synaptic protein abundance changes in P23H-RFP/+ mice.
(A, B) Example confocal z-projections from WT and P23H-RFP/+ retinal cryosections at (A) P30 and (B) P90 focused on regions of the lower/proximal ONL and OPL with Dystrophin (cyan) and BASSOON (Bsn, yellow) immunolabeling and DAPI counterstaining (blue). RFP acquisition and intensity levels were matched between WT and P23H-RFP/+ samples, and RFP fluorescence (magenta) was detectable only in the ONL and OPL of the P23H-RFP/+ sections. (C, D) Confocal z-projections for WT and P23H-RFP/+ retinal cryosections at (C) P30 and (D) P90 with ELFN1 immunolabeling (green) and DAPI nuclear staining (blue). RFP fluorescence (magenta) was again only detected in the P23H-RFP/+ images. (E, F) Graphs of normalized puncta intensity values for (E) Dystrophin and (F) BASSOON from confocal images of WT and P23H-RFP/+ retinas at P30 and P90. Graphs are aggregated data from replicate WT vs. P23H-RFP/+ puncta intensity comparisons; for each comparison, and all replicates were aggregated. In the graphs, WT values are open circles and P23H-RFP/+ are closed circles. (G) Time course plot of Dystrophin (blue) and Bassoon (yellow) normalized (Norm.) puncta intensity measurements from P23H-RFP/+ retinas P30 and P90 data are the same aggregated replicates as in (E) and (F). (H) Time course plot of DAPI+ photoreceptor nuclei per column counted from both WT and P23H-RFP/+ in confocal images analyzed throughout the puncta analyses in (E - G). Black circles = WT nuclei counts. Pink diamonds = P23H-RFP/+ nuclei counts. Two phase decay curve fits were added in GraphPad Prism. (I) Graph of normalized ELFN1 OPL intensities between WT and P23H-RFP/+ retinas at ages P30 and P90. The data were normalized and aggregated as in (E) and (F). (J) Example confocal images from P23H-RFP/+ retinas depicting RFP fluorescence (magenta) colocalized with either Dystrophin (top, green) or BASSOON (Bsn, bottom, green) immunolabeling. In magnified views, on the right, Dystrophin and Bsn intensities are heat map pseudocolored and superimposed with the RFP signal as white outlines. White arrows indicate RFP+ Dystrophin/Bassoon colocalizations and yellow arrows indicate RFP- Dystrophin/Bassoon examples. (K) Graph of averaged puncta intensity values from the P90 P23H-RFP/+ RFP colocalization assay for Dystrophin (cyan) BASSOON (yellow). The middle lines in each bar represent mean values.
Figure 6.
Figure 6.. ELFN1 protein distribution is altered in P23H-RFP/+ retinas.
(A, B) Confocal z-projection images of (A) P30 WT and (B) P30 P23H-RFP/+ retinal cryosections immunolabeled for ELFN1 (green) and mGluR6 (magenta) and counterstained for DAPI (blue). Grayscale images depict the ELFN1 and mGluR6 channels separately. (C) Magnified confocal images with the same labeling focused on smaller portions of the OPL. ELFN1 and mGluR6 staining, acquisition and intensity settings were matched throughout (A-C) between the P30 WT and P30 P23H-RFP/+ sections. (D) Normalized intensity graph (left side) based on layer-specific intensity measurements for ELFN1 (green) and mGluR6 (magenta). Values were aggregated from replicate WT vs. P23H-RFP/+ experiments; WT mean values are represented as circles and P23H-RFP/+ values are triangles. On the right, ratios of ELFN1 intensity ONL/OPL intensities are plotted with the same parameters. (E) Example RNAscope SIM z-projections images for Elfn1 mRNA (green) in P30 WT and P30 P23H-RFP/+ retinas, alongside example SIM images probed for POLR2A (positive control) and dapB (negative control) mRNAs. Sections were co-immunolabeled for centrin (magenta) to label connecting cilia and counterstained with DAPI (blue). Grayscale images of mRNA puncta are shown to the right of the merged images. Yellow dotted lines = the IS:ONL and ONL:OPL boundaries based on the DAPI staining
Figure 7.
Figure 7.. Rho mislocalization in rd10 RP mutant retinas does not alter rod synaptic protein levels.
(A, B) Confocal z-projections of retinal cryosections from WT and rd10 mice at age P16 (A) or P20 (B). Sections were immunolabeled with the 4D2 Rho antibody (Rho, magenta) and counterstained with DAPI (blue). Rho only images are in grayscale. Mislocalized 4D2+ Rho signal is present in the rd10 OPLs (white arrows). (C) SIM images of a P16 WT retina immunolabeled for 4D2 (Rho, magenta), RIBEYE (yellow), and PSD95 (cyan). Rho fluorescence was detected throughout the OS, IS, and ONL but not in the OPL based on images with (left) and without (right) the PSD95 channel. (D) SIM image of a P16 rd10 retina labeled as in (C). Rho fluorescence was detected throughout the OS, IS, ONL, and also mislocalized in the OPL (white arrows) based on images with (left) and without (right) PSD95. The Rho channel only is in grayscale. 4D2 Rho immunolabeling, acquisition settings and intensity levels were matched between (C) and (D). (E) SIM images of the OPL in WT and rd10 mice at ages P16 and P20 with the same labeling and colors as in (C-D). 4D2+ Rho staining, acquisition and intensity settings were matched between all conditions, and in the WT OPL, the 4D2 signal is not consistently above background levels. In rd10 retinas at ages P16 and P20, mislocalized 4D2+ Rho labeling in the OPL is colocalized with PSD95 (top row) and surrounds the ribbons; Rho mislocalization in the P20 rd10 OPL is not as evident as at P16. (F) Magnified single rod spherule SIM images from P16 rd10 retinas with the same labeling as in (E). Mislocalized Rho colocalizes with PSD95 at the spherule plasma membrane (left images) and surrounds the ribbon (right images, no PSD95 channel). (G) Confocal z-projections of cryosections from RhoGFP/+ (left) and rd10; RhoGFP/+ (right) retinas depicting Rho-GFP (GFP, green) localization. Sections were counterstained with DAPI (blue). Grayscale images are GFP only with increased brightness to demonstrate Rho-GFP OPL mislocalization in rd10; RhoGFP/+ retinas (white arrows). (H) SIM image of a P16 rd10; RhoGFP/+ retinal cryosection immunolabeled for RIBEYE (magenta) to demonstrate that mislocalized Rho-GFP in the OPL overlaps with RIBEYE+ ribbons. (I) SIM images of thin resin sections of P16 rd10; RhoGFP/+ retinas that were co-immunolabeled with a GFP nanobody (NbGFP-A647, magenta) and for RIBEYE (yellow). NbGFP-A647 labeling was specific for Rho-GFP in these sections as cone ribbons are present (white arrowheads) with no surrounding NbGFP-A647 signal. In magnified views of rd10; RhoGFP/+ spherules, Rho-GFP is localized in the OPL along the spherule plasma membranes surrounding the ribbons (white arrows). Small Rho-GFP puncta were observed in the OPL extracellular space as if detached from the spherule membrane (green arrowheads). (J) Graph of aggregated normalized puncta intensities for Dystrophin (cyan) and BASSOON (Bsn, yellow) from age P16 and P20 WT (open circles) and rd10 (closed circles) retinas.
Figure 8.
Figure 8.. Diagram model of ER protein secretion in WT rod spherules and the impact of Rho mislocalization in mutant rod spherules.
(A) Diagram of a WT rod spherule. The spherule plasma membrane is highlighted in cyan. ER (gold) wraps around the mitochondrion (tan) in the cytoplasmic space above the synaptic ribbon (yellow). Trans-synaptic cell adhesion proteins (green) align the synaptic cleft with the postsynaptic neurites (ON-type bipolar cells: orange; horizontal cells: black). These proteins (green) are potentially trafficked and turned over by an ER secretory pathway that extends to the rod spherule cytoplasm. (B) Diagram of a P23H-RFP/+ rod spherule. Mutant Rho (magenta dots) aggregates in expanded ER (gold) in the cytoplasmic space of spherules, blocking the normal secretion of synaptic proteins. (C) Diagram of a rd10 rod spherule or a WT spherule with over-expressed WT-Rho fusion protein or mutant R135L-hRho-GFP protein. In these cases, Rho (magenta) mislocalizes along the spherule plasma membrane (cyan) such that the ER (gold) is putatively unaffected, and thus synaptic protein trafficking is normal.

References

    1. Adly M. A., Spiwoks I. and Vollrath L. (1999). Ultrastructural Changes of Photoreceptor Synaptic Ribbons in Relation to Time of Day and Illumination. 40,. - PubMed
    1. Agosto M. A., Adeosun A. A. R., Kumar N. and Wensel T. G. (2021). The mGluR6 ligand-binding domain, but not the C-terminal domain, is required for synaptic localization in retinal ON-bipolar cells. J. Biol. Chem. 297,. - PMC - PubMed
    1. Agrawal S. A., Burgoyne T., Eblimit A., Bellingham J., Parfitt D. A., Lane A., Nichols R., Asomugha C., Hayes M. J., Munro P. M., et al. (2017). REEP6 deficiency leads to retinal degeneration through disruption of ER homeostasis and protein trafficking. Hum. Mol. Genet. 26, 2667–2677. - PMC - PubMed
    1. Aguilà M., Bevilacqua D., McCulley C., Schwarz N., Athanasiou D., Kanuga N., Novoselov S. S., Lange C. A. K., Ali R. R., Bainbridge J. W., et al. (2014). Hsp90 inhibition protects against inherited retinal degeneration. Hum. Mol. Genet. 23, 2164–2175. - PMC - PubMed
    1. Athanasiou D., Aguila M., Bellingham J., Li W., McCulley C., Reeves P. J. and Cheetham M. E. (2018). The molecular and cellular basis of rhodopsin retinitis pigmentosa reveals potential strategies for therapy. Prog. Retin. Eye Res. 62, 1–23. - PMC - PubMed

Publication types

LinkOut - more resources