[Preprint]. 2024 Oct 21:2024.10.18.618659.
doi: 10.1101/2024.10.18.618659.

ZNFX1 is a Novel Master Regulator in Epigenetically-induced Pathogen Mimicry and Inflammasome Signaling in Cancer

Affiliations

ZNFX1 is a Novel Master Regulator in Epigenetically-induced Pathogen Mimicry and Inflammasome Signaling in Cancer

Lora Stojanovic et al. bioRxiv. .

Update in

  • ZNFX1 Functions as a Master Regulator of Epigenetically Induced Pathogen Mimicry and Inflammasome Signaling in Cancer.
    Stojanovic L, Abbotts R, Tripathi K, Coon CM, Rajendran S, Abbasi Farid E, Hostetter G, Guarnieri JW, Wallace DC, Liu S, Wan J, Calendo G, Marker R, Gohari Z, Inayatullah MMA, Tiwari VK, Kader T, Santagata S, Drapkin R, Kommoss S, Pfisterer J, Konecny GE, Coopergard R, Issa JJ, Winterhoff BJN, Topper MJ, Sandusky GE, Miller KD, Baylin SB, Nephew KP, Rassool FV. Stojanovic L, et al. Cancer Res. 2025 Apr 3;85(7):1183-1198. doi: 10.1158/0008-5472.CAN-24-1286. Cancer Res. 2025. PMID: 39804147 Free PMC article.

Abstract

DNA methyltransferase and poly(ADP-ribose) polymerase inhibitors (DNMTis, PARPis) induce a stimulator of interferon (IFN) genes (STING)-dependent pathogen mimicry response (PMR) in ovarian (OC) and other cancers. We now show that combining DNMTis and PARPis upregulates expression of a little-studied nucleic-acid sensor, NFX1-type zinc finger-containing 1 protein (ZNFX1). We demonstrate that ZNFX1 is a novel master regulator for PMR induction in mitochondria, serving as a gateway for STING-dependent PMR. In patient OC databases, high ZNFX1 expression levels correlate with advanced stage disease. ZNFX1 expression alone significantly correlates with an increase in overall survival in a phase 3 trial for therapy-resistant OC patients receiving bevacizumab in combination with chemotherapy. In correlative RNA-seq data, inflammasome signaling through ZNFX1 correlates with abnormal vasculogenesis. ZNFX1 controls PMR signaling through the mitochondria and may serve as a biomarker to facilitate offering personalized therapy in OC patients, highlighting the strong translational significance of our findings.

Keywords: DNA damage; STING; ZNFX1; inflammasome; interferon; mitochondria; ovarian cancer; reactive oxygen species; tumor suppressor; viral mimicry.


Conflict of interest statement

Disclosure of Conflicts of Interest F.V.R. and S.B.B. share co-inventorship on US Provisional Patent Application Number: 61/929,680 for the concept of the combinatorial therapy. The opinions expressed in this article are the author’s own and do not reflect the view of the National Institutes of Health, the Department of Health and Human Services, or the United States government. All other authors declare no potential conflicts of interest.

Figures
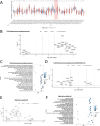
Figure 1.
Figure 1.. ZNFX1 expression correlates with interferon/inflammasome signaling, but is inverse to a mt dysfunction signature in OC cells.
A. Pan-cancer analysis shows significantly higher relative expression of ZNFX1 in ovarian tumors vs fallopian tube normal samples. Raw RNA-seq expression counts for TCGA and GTEx samples were transformed to log2 counts-per-million values. The log ratio of ZNFX1 expression to the median expression of all genes in a sample is shown on the y-axis for each tissue type. A Wilcoxon Rank Sum test was performed on all tumor (shown in red) vs normal (shown in blue) samples within each tissue type. Unadjusted p-values (***p<0.001, **p<0.01, *p<0.05, . p<0.1) for each test are shown above each comparison. B. Volcano plot for RNAseq differential expression analysis (TCGA Ovarian serous cystadenocarcinoma), all annotated HGNC symbols, x-axis: log2 fold change in expression: ZNFX1 above median vs. ZNFX1 below median, y-axis: -log10 of FDR controlled adjusted p-value (padj), color mapping: gray: padj> 0.10 and log2 fold change < |0.5|, black: padj< 0.10 and log2 fold change < |0.5|, blue: padj> 0.10 and log2 fold change > |0.5|, and orange: padj< 0.10 and log2 fold change > |0.5|. C. Pathway dot plot depicting result from gene set enrichment analysis (TCGA Ovarian serous cystadenocarcinoma) on pre-ranked gene list derived from ZNFX1 above median vs. ZNFX1 below median differential expression analysis. Pathways depicted are derived from manual curation of Interferon, Mitochondria, and DNA repair pathways compiled from MSigDB: HALLMARK, KEGG, and REACTOME. x-axis: normalized enrichment score, dot size: enrichment score, color gradation: FDR controlled adjusted p-value. D. Volcano plot for RNAseq differential expression analysis (TCGA Ovarian serous cystadenocarcinoma), MITOCARTA 3.0 symbols, x-axis: log2 fold change in expression: ZNFX1 above median vs. ZNFX1 below median, y-axis: -log10 of FDR controlled adjusted p-value (padj), color mapping: gray: padj> 0.10 and log2 fold change < |0.5|, black: padj< 0.10 and log2 fold change < |0.5|, blue: padj> 0.10 and log2 fold change > |0.5|, and orange: padj< 0.10 and log2 fold change > |0.5|. E. Volcano plot for RNAseq differential expression analysis (ZNFX1 KO vs. ZNFX1 WT), all annotated HGNC symbols, x-axis: log2 fold change in expression, y-axis: -log10 of FDR controlled adjusted p-value (padj), color mapping: gray: padj> 0.10 and log2 fold change < |0.5|, black: padj< 0.10 and log2 fold change < |0.5|, blue: padj> 0.10 and log2 fold change > |0.5|, and orange: padj< 0.10 and log2 fold change > |0.5|. F. Pathway dot plot depicting result gene set enrichment analysis on pre-ranked gene list derived from ZNFX1 KO vs ZNFX1 WT RNAseq comparison. Pathways depicted are derived from manual curation of Interferon, Mitochondria, and DNA repair-associated pathways compiled from MSigDB: HALLMARK, KEGG, and REACTOME. x-axis: normalized enrichment score, dot size: enrichment score, color gradation: FDR controlled adjusted p-value.
Figure 2.
Figure 2.. DNMTi and PARPi increase ZNFX1 expression, localization with MAVs, increasing mtROS, DNA damage, and dsDNA leakage into the cytosol
The following assays were performed in TYK-nu OC cells following 6 days of AZA 100nM, TAL 2.5nM, or combination treatment: A. Immunoblotting for ZNFX1 and MAVS. B-E. Representative immunofluorescence images of ZNFX1 interaction with dsRNA (C), dsDNA (D) MAVS (E), and MAVS and mt membrane protein TOM20 interaction (F), by proximity ligation assay (left): graphical representation of foci in three independent experiments is plotted (right). F. Flow cytometry detection of Mitosox measuring mtROS. G. Relative mtDNA damage measured by adapted real-time long-range PCR method. H. Relative 8-oxoG in mtDNA measured by ELISA. I. Relative expression of mt-encoded genes (mtDloop, mtATP6/8, mtCO2) in cytosolic DNA fractions quantitated by qPCR. J-M. The following assays were performed in ZNFX1 KO and/or WT TYK-nu OC cells following 6 days of AZA 100nM, TAL 2.5nM, or combination treatment: (J) Flow cytometry detection of mtROS in ZNFX1 KO TYK-nu cells following 6 days treatment with AZA, TAL, or combination. (K) Relative mtDNA damage measured by adapted real-time long-range PCR method in ZNFX1 WT and KO TYK-nu. (L) Relative 8-oxoG in mtDNA isolated from ZNFX1 KO and WT TYK-nu cells. (M) Relative expression of mt-encoded genes (mtDloop, mtATP6/8, mtCO2) in cytosolic fraction isolated from ZNFX1 KO TYK-nu. Rotenone used as a positive control in F, H, J, I and M. All data are presented as mean ± SEM with p values derived from two-tailed unpaired Student’s t-test or ANOVA as appropriate. * p<0.05, ** p<0.01, *** p<0.001, **** p<0.0001. All experiments were performed at least 3 times.
Figure 3.
Figure 3.. ZNFX1 increases DNMTi/PARPi-induced STING-dependent IFN and inflammasome signaling and ZNFX1 KO increases tumorigenic features in vitro and in vivo.
A. Relative transcript levels of IFN (IFI27, MX2) or inflammasome (JUNB, TNFα) by qPCR in TYK-nu ZNFX1 WT or KO following 6 days treatment with 100nM AZA, 2.5nM TAL, or combination. B. Levels of cytokines, , TNFα (Top panel), IFI27 (Bottom panel), as measured by ELISA in TYK-nu ZNFX1 WT or KO following 6 days treatment with AZA 100nM, TAL 2.5nM, or combination in TYK-nu. C. Relative transcript levels of IFN (IFI27, MX2) or inflammasome (JUNB, TNFα) by qPCR in TYK-nu ZNFX1 KO cells transfected with ZNFX1 plasmid construct following 6 days treatment with 100nM AZA, 2.5nM TAL, or combination. D. Levels of cytokines, TNFα (Left panel), IFI27 (Right panel), as measured by ELISA in TYK-nu ZNFX1 KO cells transfected with ZNFX1 plasmid construct following 6 days treatment with AZA 100nM, TAL 2.5nM, or combination in TYK-nu. E. Relative expression levels of pSTING/STING, pTBKI/TBKI and pIRF3/IRF3 in protein extracts after 1 and 3 days of treatment with AZA, TAL and combination in TYK-nu. F. Representative immunofluorescence images of Ser366 phosphorylation of STING in TYK-nu ZNFX1 WT or KO following 24h treatment with AZA, TAL, or combination. G. Relative transcript levels of STING, IFN (IFI27, MX2, CCL5) or inflammasome (JUNB, TNFα) by qPCR in TYK-nu STING KO cells following 6 days treatment with 100nM AZA, 2.5nM TAL, or combination. H. Levels of cytokines, TNFα (Left panel), IFI27 (Right panel), as measured by ELISA in TYK-nu ZNFX1 STING KO following 6 days treatment with AZA 100nM, TAL 2.5nM, or combination in TYK-nu. I. Relative expression of IFN/inflammasome (IFI27, ISG15, NFKB1, STING, TNFα) transcripts by qPCR in TYK-nu ZNFX1 WT or KO 72hrs after transfection of purified mtDNA. J-N. Effect of ZNFX1 KO on TYK-nu (J) proliferation (seeding density 500 cells) (K) migration (L) colony formation (1000 cells/ well) (M) spheroid formation (3000 cells/well; 7–10 day growth period). and (N) tumor growth (3×10⁶ TYK-nu WT or ZNFX1 KO cells injected S.C.; n=5 NSG mice per group) All data are presented as mean +/− SEM with p-values derived from two-tailed unpaired Student’s t test or ANOVA as appropriate. * p<0.05, ** p<0.01, *** p<0.001, **** p<0.0001. All experiments were performed at least 3 times.
Figure 4.
Figure 4.. Translational relevance of ZNFX1 expression in ovarian cancer.
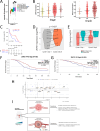
A. This box plot depicts the Q3-normalised expression of ZNFX1 in the epithelia with HGSOC progression. The region of interest (ROI) for each lesion type in X axis was taken from micro regional spatial whole transcriptome (GeoMx). Number of ROIs per lesion type as follows: incidental FT (n=29), Incidental Fimbriae (n=26), incidental p53 signature (n=39), incidental STIC (n=27), STIC (n=96) and inv cancer (n=105). STIC = STIC associated with cancer and inv cancer = invasive HGSOC. Y axis is presented in log10 scale. The solid line indicates the median within the interquartile range, with whiskers extending to a maximum of 1.5 times the interquartile range beyond the box. Black asterisks indicate significant differences in stages compared to the FT.I; *p<0.05, Generalized Linear Mixed Models (GLMMs) taking patient ID as random effect. B. Expression of ZNFX1 in ovarian cancer patients in precursor lesions at different tumor stages (left) and grades (right) in the Ovarian Cancer Database of Cancer Science Institute Singapore (CSIOVDB). C. Overall survival plotted in CSIOVDB. D. Analysis of GSE188249 RNA-seq data (42) for ZNFX1 expression in 9 paired samples pre cycle 1 Day 1 (C1D1) and post Cycle 2 Day 8 (C2D8) epigenetic therapy. E. Analysis of RNA-seq data for ZNFX1 expression in samples from responders and non-responders pre (C1D1) and post (C2D8) epigenetic therapy. F,G. Kaplan-Meier curves progression-free survival and overall survival in ICON7 trial (standard treatment + bevacizumab v. standard treatment). High v. low ZNFX1 expression separated by median. H. Volcano plot for RNAseq differential expression analysis of curated vasculogenesis genes from TCGA: ZNFX1 above median vs. ZNFX1 below median, y-axis: -log10 of FDR controlled adjusted p-value (padj), color mapping: gray: padj> 0.10 and log2 fold change < |0.5|, black: padj< 0.10 and log2 fold change < |0.5|, blue: padj> 0.10 and log2 fold change > |0.5|, and orange: padj< 0.10 and log2 fold change > |0.5|. I. Graphical abstract showing effects of different therapies on basal levels of ZNFX1 as well as tumor responses. Top panel: High grade serous ovarian cancer cells with low basal levels of ZNFX1, DNMTI and PARPi (Figures 2–3), DNMTi and immune checkpoint inhibitors (Figures 4E, F) or chemotherapy as in the ICON7 trial (SFigure S14) can lead to tumor responses. Bottom panel: High grade serous ovarian cancer cells with high ZNFX1 expression and disease grade therapy resistance (ICON7 trial data, Figure 4G), cells may also exhibit immune evasive and angiogenic features that may contribute to responses to chemotherapy plus bevacizumab.

References

    1. Chiappinelli KB, Strissel PL, Desrichard A, Li H, Henke C, Akman B, et al. Inhibiting DNA Methylation Causes an Interferon Response in Cancer via dsRNA Including Endogenous Retroviruses. Cell 2015;162:974–86 - PMC - PubMed
    1. Roulois D, Loo Yau H, Singhania R, Wang Y, Danesh A, Shen SY, et al. DNA-Demethylating Agents Target Colorectal Cancer Cells by Inducing Viral Mimicry by Endogenous Transcripts. Cell 2015;162:961–73 - PMC - PubMed
    1. Topper MJ, Vaz M, Chiappinelli KB, DeStefano Shields CE, Niknafs N, Yen RC, et al. Epigenetic Therapy Ties MYC Depletion to Reversing Immune Evasion and Treating Lung Cancer. Cell 2017;171:1284–300 e21 - PMC - PubMed
    1. Stone ML, Chiappinelli KB, Li H, Murphy LM, Travers ME, Topper MJ, et al. Epigenetic therapy activates type I interferon signaling in murine ovarian cancer to reduce immunosuppression and tumor burden. Proc Natl Acad Sci U S A 2017;114:E10981–E90 - PMC - PubMed
    1. McLaughlin LJ, Stojanovic L, Kogan AA, Rutherford JL, Choi EY, Yen RC, et al. Pharmacologic induction of innate immune signaling directly drives homologous recombination deficiency. Proc Natl Acad Sci U S A 2020;117:17785–95 - PMC - PubMed

Publication types