[Preprint]. 2024 Oct 23:2024.03.19.585750.
doi: 10.1101/2024.03.19.585750.

Optical characterization of molecular interaction strength in protein condensates

Affiliations

Optical characterization of molecular interaction strength in protein condensates

Timon Beck et al. bioRxiv. .

Update in

Abstract

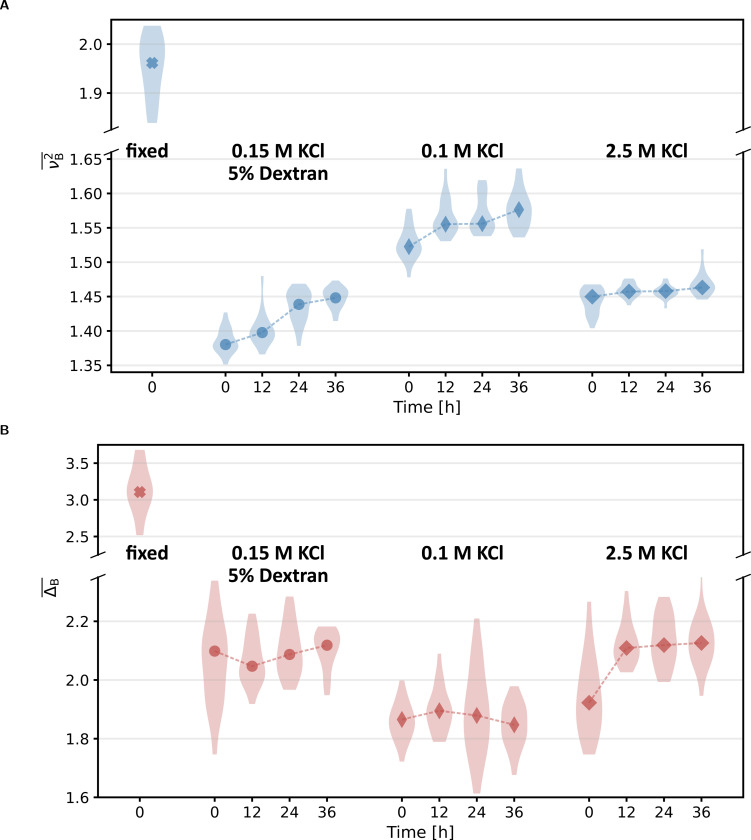
Biomolecular condensates have been identified as a ubiquitous means of intracellular organization, exhibiting very diverse material properties. However, techniques to characterize these material properties and their underlying molecular interactions are scarce. Here, we introduce two optical techniques - Brillouin microscopy and quantitative phase imaging (QPI) - to address this scarcity. We establish Brillouin shift and linewidth as measures for average molecular interaction and dissipation strength, respectively, and we used QPI to obtain the protein concentration within the condensates. We monitored the response of condensates formed by FUS and by the low-complexity domain of hnRNPA1 (A1-LCD) to altering temperature and ion concentration. Conditions favoring phase separation increased Brillouin shift, linewidth, and protein concentration. In comparison to solidification by chemical crosslinking, the ion-dependent aging of FUS condensates had a small effect on the molecular interaction strength inside. Finally, we investigated how sequence variations of A1-LCD, that change the driving force for phase separation, alter the physical properties of the respective condensates. Our results provide a new experimental perspective on the material properties of protein condensates. Robust and quantitative experimental approaches such as the presented ones will be crucial for understanding how the physical properties of biological condensates determine their function and dysfunction.


Conflict of interest statement

Conflicts of interest RS is an employee of the company CellSense GmbH, which develops commercial Brillouin microscopes. The other authors declare no competing interests.

Figures

Figure 1:
Figure 1:. Illustration of a thermally excited pressure wave.
Individual particles are indicated as grey dots, the blue line indicates the change in pressure, density, and refractive index compared to an unperturbed state. The amplitude of the wave and the corresponding particle displacement are exaggerated for better visualization. Due to the pressure wave, particles get pushed together (high pressure) or pulled apart (low pressure). (Inter)molecular interactions give rise to an inherent resistance to this collective particle displacement. This resistance can be quantified by the longitudinal modulus M, an average molecular coupling constant on the length scale of the acoustic wavelength Λ, which is in our case on the order of a few hundred nanometers corresponding to an acoustic frequency in the Giga-Hertz regime. Stronger particle interactions lead to a higher longitudinal modulus and faster pressure wave propagation. As the pressure p is coupled to density ρ and consequently refractive index n, periodic changes in pressure can scatter light (Brillouin scattering). The measurement of the Brillouin shift νB gives access to the longitudinal modulus and therefore the average molecular interaction strength in the probed volume. The wave attenuation, on the other hand, is determined by the dissipative properties of the medium and is linked to the Brillouin linewidth ΔB. The relation of these quantities to other established viscoelastic quantities is further treated in the supplement (S 5).
Figure 2:
Figure 2:. Introduction of experimental techniques.
Left column: Schematic representation of the optical setup. Brillouin microscopy probes a single confocal spot, QPI illuminates the complete field of view with a plane wave. Middle column: Schematic representation of the Brillouin scattering process in the confocal volume probed, where θ denotes the scattering angle. The incoming probe beam is inelastically scattered by microscopic pressure waves. Brillouin frequency shift νB (i.e., the distance between the elastic peak and the Brillouin peak on the frequency axis) and linewidth ΔB are indicated in an example spectrum of water. Right column: QPI quantifies the phase delay Δϕ introduced by a specimen compared to the surrounding medium with a known refractive index ns. Due to the higher refractive index of the specimen n>ns, the light traveling through the specimen is delayed resulting in a distortion of the incoming plane wave. This distortion can be captured in a phase image showing Δϕ. A custom algorithm fits the phase image obtained, assuming a spherical shape of the specimen, providing the radius r and refractive index n of the fitted sphere (see Section 4.3 for more details). Non-spherical samples require a tomographic imaging techique such as optical diffraction tomography (ODT).
Figure 3:
Figure 3:. Temperature alterations of PEG solutions and protein condensates.
A: Brillouin shift νB and linewidth ΔB for PEG solutions at different temperatures. The labels indicate the PEG weight fraction. B: Brillouin shift νB and linewidth ΔB for FUS and A1-LCD condensates and corresponding dilute phase for different temperatures at 150 mM KCl with 5 % dextran and 150 mM NaCl, respectively. A control experiment for FUS condensates without the addition of dextran can be found in the supplement (Figure S 8A). Inset shows fluorescence intensity recovery after photobleaching (FRAP) of FUS condensates at 10 °C and 40 °C. The solid line shows the median intensity recovery of five individual condensates. C: Corresponding protein concentration and protein volume fraction of protein condensates for various temperatures. The accessible temperature range for A1-LCD was limited by the onset of condensate dissolution. D: Brillouin shift squared νB2¯ (left axis) and Brillouin linewidth ΔB¯ (right axis) of protein condensates normalized to the respective values of the dilute phase. Note that the Brillouin shift of A1-LCD at 10 °C, indicated by [], might be subjected to a systematic underestimation; more details can be found in Section S 4. Markers indicate median values; error bars represent the range containing 68.3 % of the data points that are closest to the median. In some cases, the marker diameter is larger than the error bars.
Figure 4:
Figure 4:. Impact of different ion concentrations on protein condensates.
A: Protein concentration and volume fraction of FUS condensates at 5 % dextran and different KCl concentrations and of A1-LCD at varying NaCl concentrations. Note that the data shown for FUS at 150 mM KCl is the same as in Figure C at 22.5 °C. 4B: Corresponding Brillouin shift squared νB2¯ (left axis) and Brillouin linewidth ΔB¯ (right axis) normalized to the respective values of the dilute phase. Markers indicate median values; error bars represent the range containing 68.3 % of the data points that are closest to the median.
Figure 5:
Figure 5:. Effect of FUS condensate aging on morphology and density.
A: Bright-field images of a representative FUS condensate over a time course of 36 h at 150 mM KCl and 5 % dextran. B: Refractive index, protein concentration and volume fraction of FUS condensates measured 3 h, 12 h, 24 h and 36 h after condensate formation. Markers indicate median values. Scale bar: 10 μm.
Figure 6:
Figure 6:. Effect different buffers on FUS droplet aging.
Time evolution of νB2¯ (A) and ΔB¯ (B) of FUS condensates for three different buffer conditions. Fixed condensates were chemically crosslinked by the addition of 0.05 % glutaraldehyde at a KCl concentration of 100 mM. Markers indicate median values.
Figure 7:
Figure 7:. Physical properties of different A1-LCD-variants against their saturation concentration.
Measurements were conducted at 23 °C and 150 mM NaCl. A: Protein concentration. Refractive index and volume fraction are shown in Figure S 10. B: Brillouin shift squared (left axis) and Brillouin linewidth (right axis) normalized to the value of the dilute phase (same value for all conditions). Markers indicate median values; error bars represent the range containing 68.3 % of the data points that are closest to the median.

References

    1. Banani Salman F. et al. “Biomolecular condensates: Organizers of cellular biochemistry”. In: Nature Reviews Molecular Cell Biology 18.5 (2017), pp. 285–298. doi: 10.1038/nrm.2017.7. - DOI - PMC - PubMed
    1. Brangwynne Clifford P., Tompa Peter, and Pappu Rohit V. “Polymer physics of intracellular phase transitions”. In: Nature Physics 11.11 (2015), pp. 899–904. doi: 10.1038/nphys3532. - DOI
    1. Woodruff Jeffrey B., Hyman Anthony A., and Boke Elvan. “Organization and Function of Non-dynamic Biomolecular Condensates”. In: Trends in Biochemical Sciences 43.2 (2018), pp. 81–94. doi: 10.1016/j.tibs.2017.11.005. - DOI - PubMed
    1. Dodson Anne E. and Kennedy Scott. “Phase Separation in Germ Cells and Development”. In: Developmental Cell 55.1 (2020), pp. 4–17. doi: 10.1016/j.devcel.2020.09.004. - DOI - PMC - PubMed
    1. Lafontaine Denis L.J. et al. “The nucleolus as a multiphase liquid condensate”. In: Nature Reviews Molecular Cell Biology 22.3 (2021), pp. 165–182. doi: 10.1038/s41580-020-0272-6. - DOI - PubMed

Publication types

LinkOut - more resources