. 2024 Oct 17:11:1376793.
doi: 10.3389/fmolb.2024.1376793. eCollection 2024.

Identification of immune microenvironment subtypes and clinical risk biomarkers for osteoarthritis based on a machine learning model

Affiliations

Identification of immune microenvironment subtypes and clinical risk biomarkers for osteoarthritis based on a machine learning model

Bao Li et al. Front Mol Biosci. .

Abstract

Background: Osteoarthritis (OA) is a degenerative disease with a high incidence worldwide. Most affected patients do not exhibit obvious discomfort symptoms or imaging findings until OA progresses, leading to irreversible destruction of articular cartilage and bone. Therefore, developing new diagnostic biomarkers that can reflect articular cartilage injury is crucial for the early diagnosis of OA. This study aims to explore biomarkers related to the immune microenvironment of OA, providing a new research direction for the early diagnosis and identification of risk factors for OA.

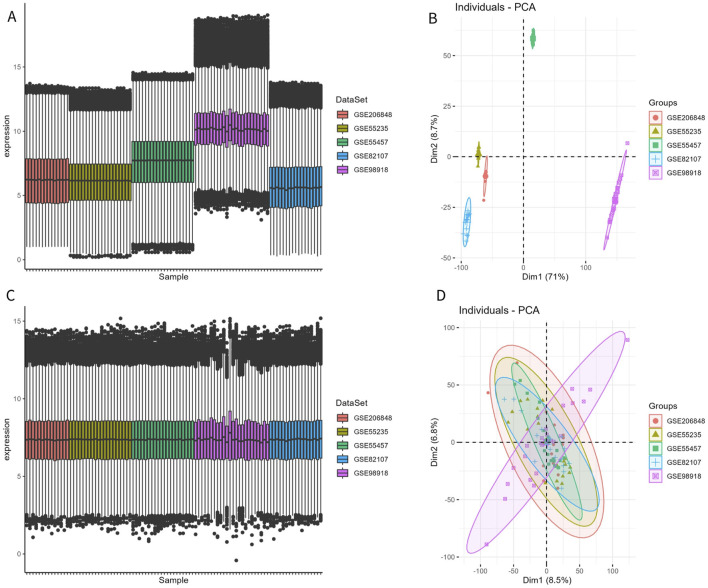
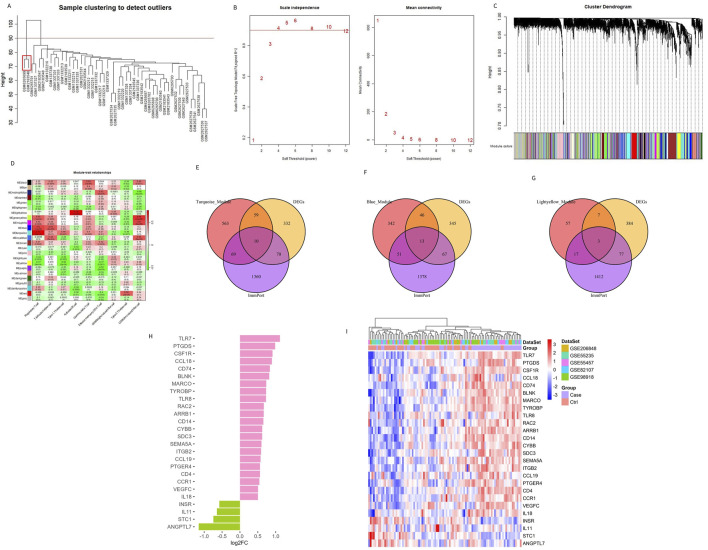
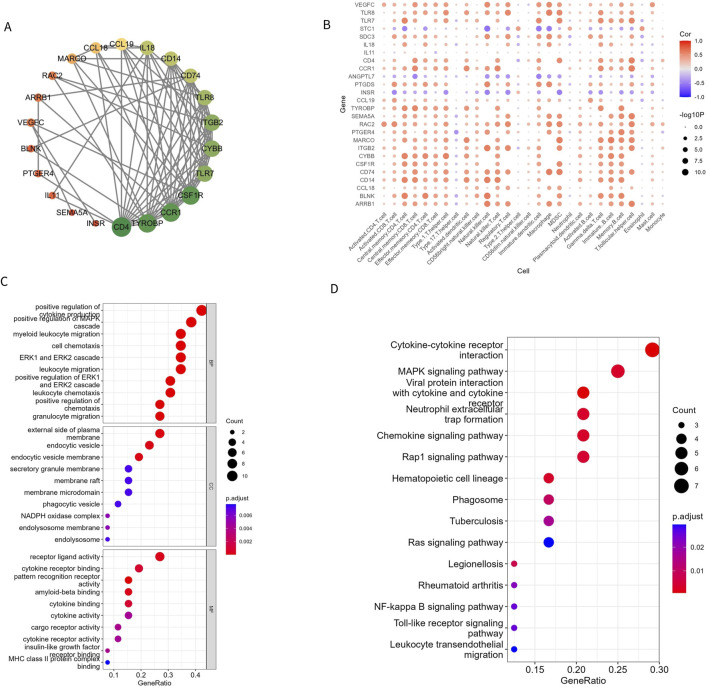
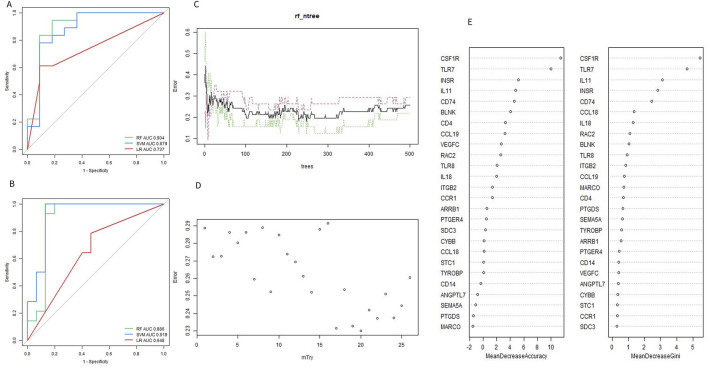
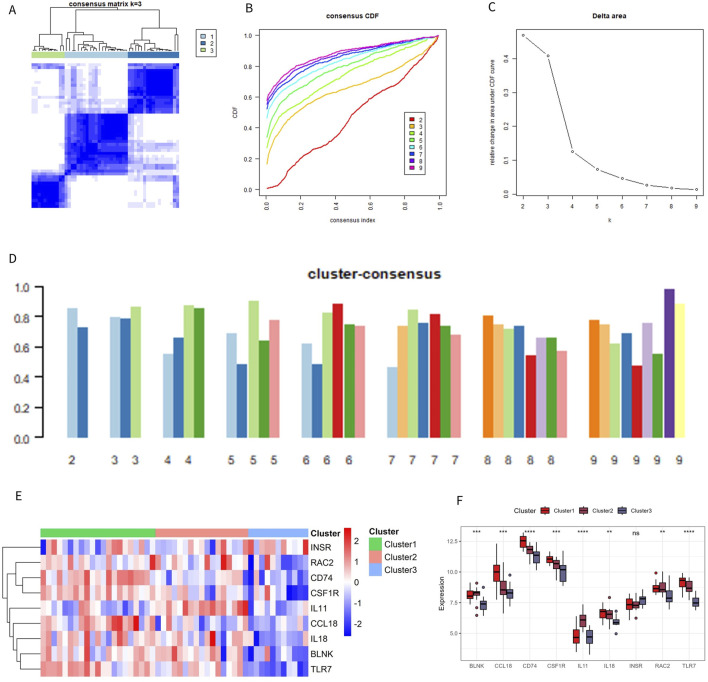
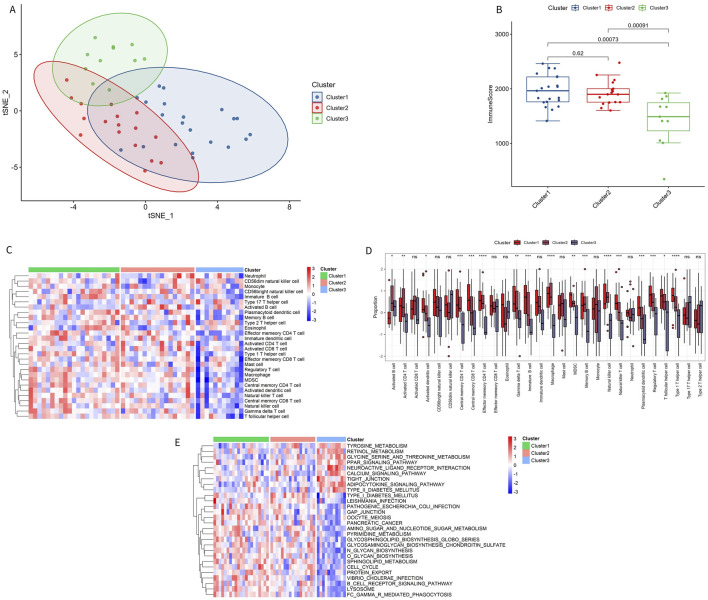
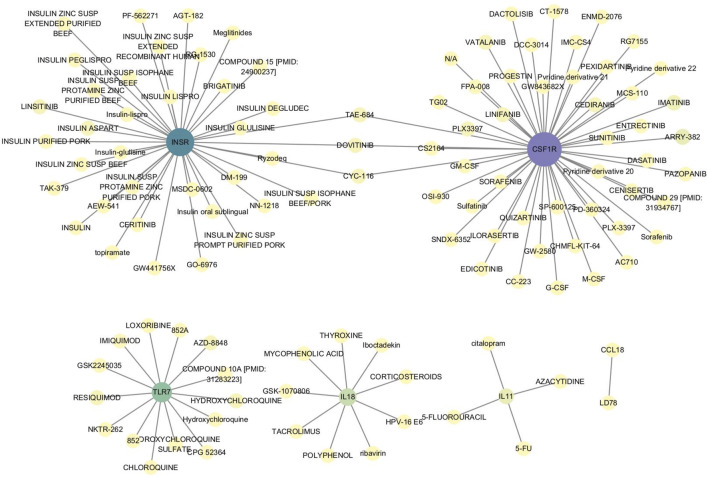
Methods: We screened and downloaded relevant data from the Gene Expression Omnibus (GEO) database, and the immune microenvironment-related genes (Imr-DEGs) were identified using the ImmPort data set by combining weighted coexpression analysis (WGCNA). Functional enrichment of GO and Kyoto Encyclopedia of Genes and Genomes (KEGG) were conducted to explore the correlation of Imr-DEGs. A random forest machine learning model was constructed to analyze the characteristic genes of OA, and the diagnostic significance was determined by the Receiver Operating Characteristic Curve (ROC) curve, with external datasets used to verify the diagnostic ability. Different immune subtypes of OA were identified by unsupervised clustering, and the function of these subtypes was analyzed by gene set enrichment analysis (GSVA). The Drug-Gene Interaction Database was used to explore the relationship between characteristic genes and drugs.

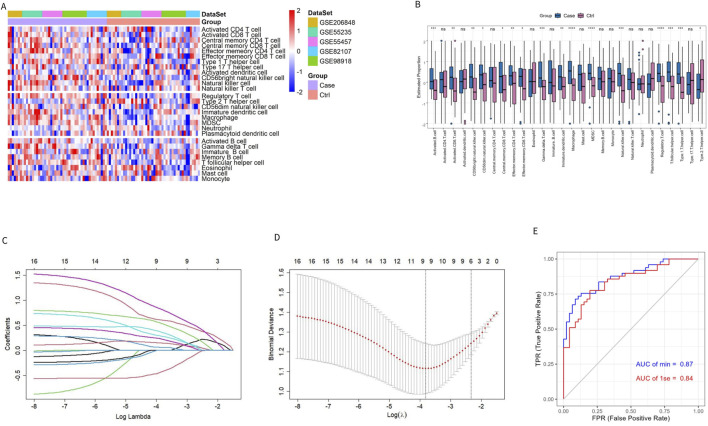
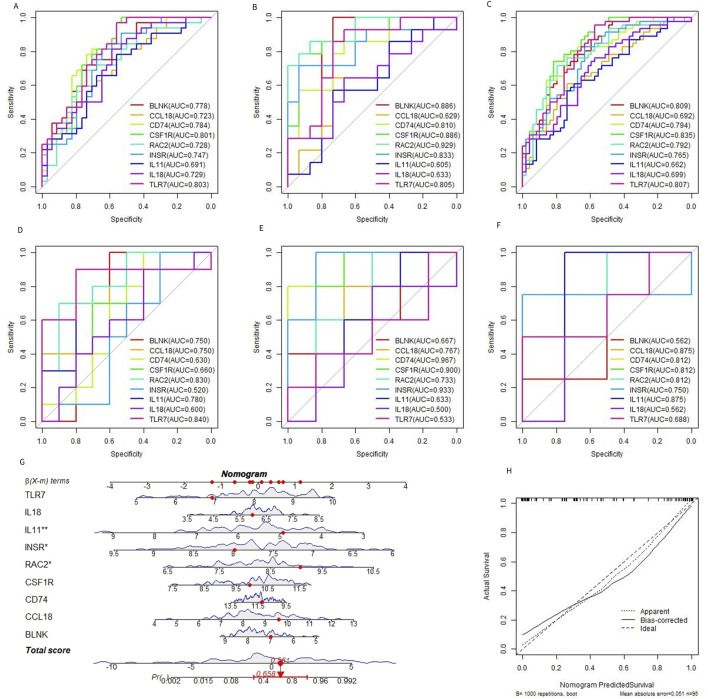
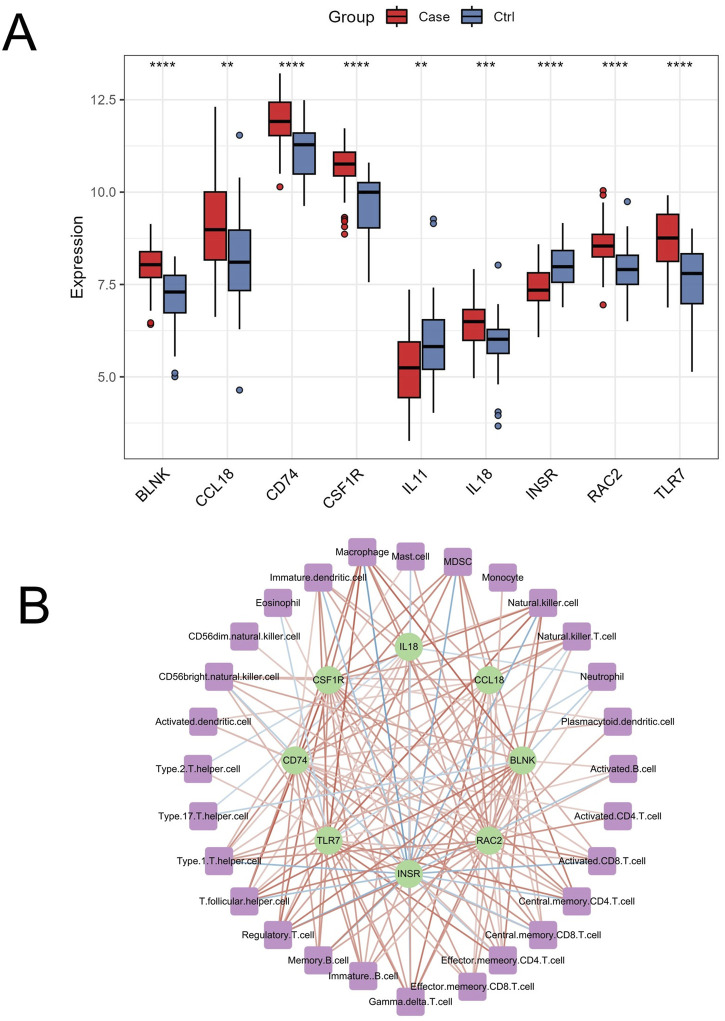
Results: Single sample gene set enrichment analysis (ssGSEA) revealed that 16 of 28 immune cell subsets in the dataset significantly differed between OA and normal groups. There were 26 Imr-DEGs identified by WGCNA, showing that functional enrichment was related to immune response. Using the random forest machine learning model algorithm, nine characteristic genes were obtained: BLNK (AUC = 0.809), CCL18 (AUC = 0.692), CD74 (AUC = 0.794), CSF1R (AUC = 0.835), RAC2 (AUC = 0.792), INSR (AUC = 0.765), IL11 (AUC = 0.662), IL18 (AUC = 0.699), and TLR7 (AUC = 0.807). A nomogram was constructed to predict the occurrence and development of OA, and the calibration curve confirmed the accuracy of these 9 genes in OA diagnosis.

Conclusion: This study identified characteristic genes related to the immune microenvironment in OA, providing new insight into the risk factors of OA.

Keywords: biomarker; early diagnosis; immune microenvironment; machine learning; osteoarthritis.


Conflict of interest statement

The authors declare that the research was conducted in the absence of any commercial or financial relationships that could be construed as a potential conflict of interest.

Figures

FIGURE 1
FIGURE 1
Removal of batch effect. (A, B) Expression box plot and principal component analysis (PCA) of different datasets before batch effect removal. (C, D) Expression box plot and PCA of different datasets after batch effect removal.
FIGURE 2
FIGURE 2
Evaluation of immune cell infiltration in patients with OA and controls. (A, B) Heatmap and box plot of ssGSEA enrichment score for 28 types of immune cells in the combined dataset. (C) Distribution of the LASSO coefficient of 16 immune cell subtypes. (D) Ten-fold cross-validation LASSO regression analysis; the dotted line represents the model’s minimum lambda (λ) and optimal λ. (E) The model’s ROC curve based on different λ values.
FIGURE 3
FIGURE 3
Identifying genes related to the immune microenvironment between OA and the control group. (A) Sample clustering and removal of outlier samples. (B) Soft threshold selection between OA and the control group. (C) A total of 471 DEGs in different co-expression modules. (D) Correlation heat map between each module and characteristic immune cells. (E–G) Genes from the turquoise, blue, and light yellow modules were intersected with DEGs and immune-related genes from the ImmPort database. (H, I) The bar chart and heat map display the differences in genes related to the differential immune microenvironments between patients with OA and controls.
FIGURE 4
FIGURE 4
Imr-DEG interaction and functional enrichment. (A) A protein interaction network of 26 Imr-DEGs; each node represents a protein. If an interaction exists between two proteins, they are connected by a line. The larger the node, the more genes interact with it. (B) The correlation between 26 Imr-DEGs and 28 immune cells. (C, D) GO and KEGG functional enrichment bubble diagrams.
FIGURE 5
FIGURE 5
Evaluation of machine learning model. (A, B) ROC curves of the machine learning model for training set and validation set. (C) Selecting of the optimal number of binary tree variables (mtry value). (D) Selection of the optimal number of decision trees (ntree value). (E) Accuracy value and Gini value of Imr-DEGs.
FIGURE 6
FIGURE 6
Diagnostic efficacy of characteristic genes. (A–C) ROC curves of each characteristic gene in the training set, verification set, and merged dataset. (D–F) ROC curves of characteristic genes in external datasets GSE117999, GSE169077, and GSE178557. (G) OA prediction nomogram based on the characteristic gene. (H).
FIGURE 7
FIGURE 7
Identification of immune subtypes. (A) C onsensus clustering matrix at k = 3. (B) Consensus CDF curve for k = 2–9. (C) Change in the delta area curve of the CDF. (D) Consistency score for k = 2–9. (E, F) Heatmap and box plot of characteristic genes in different subtypes.
FIGURE 8
FIGURE 8
Immune characteristics of immune subtypes. (A) t-SNE analysis of different subtypes. (B) Comparison of immune scores across different subtypes. (C, D) Distribution of 28 types of immune cells in different subtypes. (E) GSVA pathway enrichment in different subtypes.
FIGURE 9
FIGURE 9
Interaction between characteristic genes and therapeutic drugs. Drug-gene interaction analysis was conducted through the DGIdb database to identify potential therapeutic targets for OA. Six characteristic genes—CSF1R, INSR, TLR7, IL11, IL18, and CCL18—showed interactions with various drugs, indicating their roles in modulating immune responses, inflammation, and cellular signaling pathways. These interactions suggest that these genes could be key targets for developing or repurposing drugs aimed at treating OA.
FIGURE 10
FIGURE 10
Differential expression and immune cell correlation of characteristic genes in the merged dataset. (A) Boxplots displaying the differential expression of the 9 characteristic genes (BLNK, CCL18, CD74, CSF1R, RAC2, INSR, IL11, IL18, and TLR7) between OA and normal control samples in the merged dataset. ∗∗p < 0.01, ∗∗∗∗p < 0.0001 (B) The correlation analysis between the 9 genes and immune cells, extracted from Figure 4B, shows significant positive and negative correlations (p < 0.05), with stronger associations represented by darker red (positive) and darker blue (negative) lines.

Similar articles

References

    1. Abramoff B., Caldera F. E. (2020). Osteoarthritis: pathology, diagnosis, and treatment options. Med. Clin. North Am. 104 (2), 293–311. 10.1016/j.mcna.2019.10.007 - DOI - PubMed
    1. Allen K., Thoma L., Golightly Y. (2022). Epidemiology of osteoarthritis. Osteoarthr. Cartil. 30 (2), 184–195. 10.1016/j.joca.2021.04.020 - DOI - PMC - PubMed
    1. Bernardini G., Benigni G., Scrivo R., Valesini G., Santoni A. (2017). The multifunctional role of the chemokine system in arthritogenic processes. Curr. Rheumatol. Rep. 19 (3), 11. 10.1007/s11926-017-0635-y - DOI - PubMed
    1. Bhattacharya S., Dunn P., Thomas C. G., Smith B., Schaefer H., Chen J., et al. (2018). ImmPort, toward repurposing of open access immunological assay data for translational and clinical research. Sci. data 5, 180015. 10.1038/sdata.2018.15 - DOI - PMC - PubMed
    1. Burt P., Peine M., Peine C., Borek Z., Serve S., Floßdorf M., et al. (2022). Dissecting the dynamic transcriptional landscape of early T helper cell differentiation into Th1, Th2, and Th1/2 hybrid cells. Front. Immunol. 13, 928018. 10.3389/fimmu.2022.928018 - DOI - PMC - PubMed

LinkOut - more resources