. 2024 Nov 1;134(21):e183978.
doi: 10.1172/JCI183978.

Activation of STAT3-mediated ciliated cell survival protects against severe infection by respiratory syncytial virus

Affiliations

Activation of STAT3-mediated ciliated cell survival protects against severe infection by respiratory syncytial virus

Caiqi Zhao et al. J Clin Invest. .

Abstract

Respiratory syncytial virus (RSV) selectively targets ciliated cells in human bronchial epithelium and can cause bronchiolitis and pneumonia, mostly in infants. To identify molecular targets of intervention during RSV infection in infants, we investigated how age regulates RSV interaction with the bronchial epithelium barrier. Employing precision-cut lung slices and air-liquid interface cultures generated from infant and adult human donors, we found robust RSV virus spread and extensive apoptotic cell death only in infant bronchial epithelium. In contrast, adult bronchial epithelium showed no barrier damage and limited RSV infection. Single nuclear RNA-Seq revealed age-related insufficiency of an antiapoptotic STAT3 activation response to RSV infection in infant ciliated cells, which was exploited to facilitate virus spread via the extruded apoptotic ciliated cells carrying RSV. Activation of STAT3 and blockade of apoptosis rendered protection against severe RSV infection in infant bronchial epithelium. Lastly, apoptotic inhibitor treatment of a neonatal mouse model of RSV infection mitigated infection and inflammation in the lung. Taken together, our findings identify a STAT3-mediated antiapoptosis pathway as a target to battle severe RSV disease in infants.

Keywords: Apoptosis; Infectious disease.


Conflict of interest statement

Conflict of interest: RF has a sponsored research agreement with Merck & Co.

Figures

Figure 1
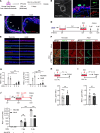
Figure 1. Human bronchial epithelium models generated from hPCLSs and TA BSCs of neonates and adults show age-related RSV infection.
(A) Schematic of RSV A2 or RSV-GFP infection (1 × 10⁶ pfu) of hPCLSs prepared from donor lungs of infants and adults (n = 3 donors) followed by staining and confocal imaging at 2 dpi. (B) Representative images of RSV-GFP (green) and RFX3 (red) staining in infant hPCLSs. Left panel shows an RSV infected airway on hPCLS. Arrow indicates an airway infected by RSV. Dotted lines mark basement membrane. Blue color is nucleus staining and the overlay of red, green, and blue shows as pink color. (C) Representative images of RSV F (green) and RFX3 (red) staining in infant and adult hPCLSs. Arrows indicate RSV-infected cells. Dotted lines mark basement membrane. Blue color is nucleus staining and the overlay of red, green, and blue shows as pink color. (D) Schematic of RSV infection of differentiated bronchial epithelium in day 21 (D21) ALI cultures of neonatal and adult TA BSCs. RSV strain A2 was applied apically (MOI 2, 4 × 10⁵ PFU) for 1 hour. Assays (EJ) were performed at 2 and 4 dpi. (E) Representative cross-section images of antibody staining for major bronchial epithelial cell types prior to infection. Blue color is nucleus staining and the overlay of red, green, and blue shows as pink color. (F) Representative top views of double staining for RSV F(green) protein and ZO1 (red). (G) Relative abundances of RSV F+ cells and relative levels of RSV L gene by RT-qPCR. (H) Assays of RSV binding at 4°C for 1 hour followed by quantification of relative RSV L gene levels by RT-qPCR. (I) Assays of primary RSV transcript and genome replication after infection at 37°C for 6 hours by RT-qPCR. (J) Assays of JNJ-678 (100 nM) treatment at 6 hpi followed by quantification of relative RSV L gene levels by RT-qPCR at 2 dpi. Each dot represents 1 donor. Bar graphs represent mean ± SEM. Statistical significance was calculated by 2-way ANOVA followed by Dunn’s test in G and by 2-tailed Student’s t test in HJ. Dotted lines mark basement membrane. **P < 0.01, ***P < 0.001. Scale bars: 50 μm.
Figure 2
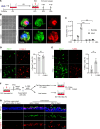
Figure 2. Neonatal bronchial epithelial cells are prone to apoptosis following RSV infection.
(A) Representative cross-section images of double staining for RSV F (green) and c-Casp-3 (red) in neonatal and adult ALI cultures at 2 and 4 dpi. Blue color is nucleus staining and the overlay of red, green, and blue shows as pink color. (B) Relative abundances of RSV F+c-Casp-3+ cells quantified from double stained images. (C) Representative Western blot analyses of Caspase-3 (Casp-3) and c-Casp-3 at 2 dpi. β-actin was loading control. Each lane represents 1 BSC line. (D) Densitometry measurements of Casp-3 and c-Casp-3 levels normalized to β-actin. Each dot represents 1 donor. Bar graphs represent mean ± SEM. Statistical significance was calculated by 2-way ANOVA followed by Dunn’s test in B and D. **P < 0.01, ***P < 0.001. Scale bar: 50 μm.
Figure 3
Figure 3. Age-related apoptotic cell death causes severe RSV infection in neonatal bronchial epithelium.
(A) Schematic of Z-VAD-FMK treatment of neonatal ALI cultures. Z-VAD-FMK (40 μM) was applied in the bottom chamber 2 hours prior to RSV infection until the assays performed at 6 hpi and 2 dpi in BE. (B) Relative levels of RSV L gene at 6 hpi by RT-qPCR. (C) Representative double staining for RSV F (green) and c-Casp-3 (red) at 2 dpi. Blue color is nucleus staining and the overlay of red, green, and blue shows as pink color. (D) Relative levels of RSV L gene at 2 dpi by RT-qPCR. (E) Relative abundances of RSV F+ and c-Casp-3+ cells at 2 dpi quantified from double stained images. (F) Schematic of RSV-GFP infection (1 × 10⁶ pfu) of infant hPCLSs pretreated with vehicle or Z-VAD-FMK (40 μM) 2 hours prior to infection. (G) Representative images of RSV-GFP (green) and c-Casp-3 (red) staining in control and Z-VAD-FMK–treated infant hPCLSs. The contour of RSV-GFP+ cells was outlined in panels showing enlarged areas. Blue color is nucleus staining and the overlay of red, green, and blue shows as pink color. Solid lines mark basement membrane and dotted lines mark the enlarged areas. (H) Relative abundance of RSV-GFP+ cells and RSV+c-Casp-3+ cells in bronchial epithelium of infant hPCLSs. Each dot represents quantification of 1 airway. A total of 9 airways from 2 donors, 4–5 airways per donor, were quantified. Each dot (except for panel H) represents 1 donor. Bar graphs represent mean ± SEM. Statistical significance was calculated by 2-tailed Student’s t test in B, D, E, and H. Solid lines mark basement membrane. **P < 0.01, ***P < 0.001. Scale bar: 50 μm.
Figure 4
Figure 4. Apoptotic cell extrusion in neonatal epithelium model following RSV infection can mediate virus spread.
(A) Schematic of extrusion assays. Extruded cells were collected from apical washes of neonatal and adult ALI cultures at 2 and 4 dpi and analyzed in BE. (B) Representative images of extruded cells on a cytometer (left panels) and double staining for RSV F protein (green) and ciliated cell markers (RFX3 and AceTUB [red])Blue color is nucleus staining and the overlay of red, green, and blue shows as pink color.) (right panels). (C) Quantification of the number of extruded cells. (D) Representative double staining for RSV F (green) protein and c-Casp-3 (red) (left panels) and quantification of the relative abundance of c-Casp-3+ cells (right panel). (E) Representative double staining for RSV F (green) protein and TUNEL(red) (left panels) and quantification of the relative abundance of TUNEL+ cells (right panel). (F) Schematic of infection assay by extruded cells. (G) Representative double staining for RSV F (green) and c-Casp-3 (red) after treatment with cell fraction and cell-free supernatant. Blue color is nucleus staining and the overlay of red, green, and blue shows as pink color. Each dot represents 1 donor. Bar graphs show mean ± SEM. ***P < 0.001 calculated by 2-way ANOVA followed by Dunn’s test in C. **P < 0.01 by 2-tailed Student’s t test in D and E. Scale bars: 5 μm (B) and 50 μm (D, E, and G).
Figure 5
Figure 5. Age regulates bronchial epithelial cell survival following RSV infection in a cell-autonomous manner.
(A) Schematic of RSV infection of a hybrid ALI culture. Hybrid ALI cultures established with GFP-lentivirus transduced neonatal BSCs and empty-lentivirus transduced adult BSCs were analyzed at 1, 2, and 4 dpi in B and C. n = 2 donors. (B) Representative staining for RSV F (red) protein in hybrid ALI cultures. White arrows mark RSV F+GFP (adult) cells and yellow arrows mark RSV F+GFP+ (green) (neonatal) cells. Blue color is nucleus staining. Scale bar: 50 μm. (C) The relative abundance of GFP+ cells in hybrid ALI cultures.
Figure 6
Figure 6. RSV induces age-related changes in expression of genes involved in cell survival and STAT3 signaling in ciliated cells.
(A) Schematic of snRNA-Seq of neonatal and adult ALI cultures with mock and RSV infection at 1 dpi. (B) Combined UMAP plot showing all nuclei (n = 58,431) in 8 clusters. (C) UMAP plots showing mock- and RSV-infected, neonatal and adult ciliated cells (n = 14,464). (D) Heatmap showing enrichment of different pathways in ciliated cells of the 4 experimental groups by single-cell GSEA. (E) Heatmap showing relative expression of antiapoptotic genes in neonatal and adult ciliated cells. (F) Enrichment plots for RSV-induced changes in expression of IL6_JAK_STAT3_SIGNALING pathway genes between neonatal and adult ciliated cells.
Figure 7
Figure 7. Age regulates STAT3 activation following RSV infection in ciliated cells.
(A) Representative Western blot analyses of p-STAT3Y705 and STAT3 levels at 2 dpi in neonatal and adult ALI cultures. β-Actin was loading control. Each lane represents 1 BSC line. (B) Densitometry measurements of relative levels of p-STAT3Y705 for individual BSC line before RSV infection (mock) and at 2 dpi. n = 4 donors for each age. **P < 0.01 by 2-way ANOVA followed by Dunn’s test. (C) Representative double staining for RSV F (fluorescence) (green) and p-STAT3Y705 (chromogenic). Blue color is nucleus staining. Arrowheads mar RSV F+ ciliated cells. Inserts show enlarged images of p-STAT3Y705 staining. Scale bar: 50 μm. (D) Quantification of the percentage of double RSV+p-STAT3+ cells among RSV-infected epithelial cells in neonatal and adult ALI cultures. Each dot represents 1 donor. **P < 0.01 by Student’s t test.
Figure 8
Figure 8. Blockade of active STAT3 in RSV-infected adult bronchial epithelium model worsens infection and promotes apoptosis.
(A) Schematic of stattic (20 μM) treatment. Stattic was applied in the bottom chamber of adult ALI cultures 2 hours prior to RSV infection until 2 dpi. Results were shown in BD. (B) Representative double staining for RSV F (green) protein and c-Casp-3 (red). Blue color is nucleus staining and the overlay of red, green, and blue shows as pink color. (C) The relative level of RSV L gene by RT-qPCR. (D) The relative abundance of RSV F+ and RSV F+c-Casp-3+ cells. (E) Schematic of STAT3 knockdown assay using an inducible lenti-shRNA system. Dox (500 ng/mL) was added to the bottom chamber from day 18. Assays were performed 2 dpi and results were shown in FH. (F) Representative Western blot analyses to assess STAT3 knockdown efficiency. β-actin was loading control. Each lane represents 1 BSC line. (G) Densitometry measurements of STAT3 levels normalized to β-actin. (H) Representative double staining for RSV F (green) protein and c-Casp-3 (red). Blue color is nucleus staining and the overlay of red, green, and blue shows as pink color. Dotted lines show area indicated in enlarged images. (I) Quantification of the relative abundance of RSV F+ cells and RSV F+c-Casp-3+ cells. Each dot represents 1 donor. **P < 0.01 and ***P < 0.001 calculated by 2-tailed Student’s t test. Scale bars: 50 μm.
Figure 9
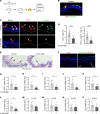
Figure 9. STAT3 activation in neonatal bronchial epithelium reduces severity of RSV infection.
(A) Schematic of IL6 (50 ng/mL) treatment of neonatal ALI cultures with and without stattic (20 μM) applied 2 hours prior to RSV infection. ALI cultures were assayed at 6 hpi and 2 dpi. (B) Representative Western blot analyses for levels of p-STAT3Y705 and STAT3. β-actin was loading control. Each lane represents 1 neonatal BSC line. (C) Densitometry measurement of relative levels of p-STAT3Y705 and STAT3. (D) Relative levels of RSV L gene at 6 hpi by RT-q-PCR. (E) Representative double staining for RSV F (green) protein and c-Casp-3(red). Blue color is nucleus staining and the overlay of red, green, and blue shows as pink color. (F) Relative abundances of RSV F+ cells and RSV+c-Casp-3+ cells. Each dot represents donor. Bar graphs show mean ± SEM. **P < 0.01, ***P < 0.001 calculated by 2-tailed Student’s t test in C and D and **P < 0.01 by 1-way ANOVA followed by Tukey’s test in F. Scale bar: 50 μm.
Figure 10
Figure 10. Blockade of apoptosis ameliorates RSV infection and lung inflammation in neonatal mice.
(A) Schematic of RSV A2-line19F infection with/without Z-VAD-FMK treatment in neonatal BALB/c mice. Neonatal mice were intranasally given with 1 × 10⁶ RSV in 20 μL of Z-VAD-FMK (0.3 mM) or solvent (3% DMSO). The trachea and lung samples were collected at 3 dpi. (B) Representative images of RSV (red) and AceTUB (green) staining in mouse trachea. Blue color is nucleus staining and the overlay of red and green shows as yellow color. (C) Representative images of RSV (red) and c-Casp-3 (green) staining in control and Z-VAD-FMK–treated mouse trachea. White arrows mark infected cells. (D) Relative abundance of RSV + cells and RSV+c-Casp-3+ cells in mouse trachea. (E) Representative image of periodic acid–Schiff (PAS) staining in trachea sections of neonatal mice. Black arrows mark positive staining. (F) Representative images of RSV (red), AceTUB (green), and p-STAT3 (red) staining using 2 adjacent trachea sections (4μm apart) of neonatal mice. Blue color is nucleus staining and the overlay of red and green shows as yellow color. Yellow arrows mark 2 p-STAT3+ cells in the parenchyma that are not infected. (GP) The relative levels of RSV L gene (G), Muc5ac (H), Cxcl2 (I), Cxcl10 (J), Cxcl11 (K), Tnf (L), Il6 (M), Ifna (N), Ifnb1 (O), and Ifng (P) gene expression in neonatal lung at 3 dpi by RT-qPCR. Dotted lines mark basement membrane. Each dot represents 1 mouse. *P < 0.05, **P < 0.01, and ***P < 0.001 by Student’s t test. Scale bar: 50 μm.

Comment in

  • Enhanced susceptibility of pediatric airway epithelium to respiratory syncytial virus infection doi: 10.1172/JCI185689

References

    1. Glezen WP, et al. Risk of primary infection and reinfection with respiratory syncytial virus. Am J Dis Child. 1986;140(6):543–546. doi: 10.1001/archpedi.1986.02140200053026. - DOI - PubMed
    1. Wang X, et al. Global disease burden of and risk factors for acute lower respiratory infections caused by respiratory syncytial virus in preterm infants and young children in 2019: a systematic review and meta-analysis of aggregated and individual participant data. Lancet. 2024;403(10433):1241–1253. doi: 10.1016/S0140-6736(24)00138-7. - DOI - PubMed
    1. Welliver TP, et al. Severe human lower respiratory tract illness caused by respiratory syncytial virus and influenza virus is characterized by the absence of pulmonary cytotoxic lymphocyte responses. J Infect Dis. 2007;195(8):1126–1136. doi: 10.1086/512615. - DOI - PMC - PubMed
    1. Johnson JE, et al. The histopathology of fatal untreated human respiratory syncytial virus infection. Mod Pathol. 2007;20(1):108–119. doi: 10.1038/modpathol.3800725. - DOI - PubMed
    1. Welliver RC. Review of epidemiology and clinical risk factors for severe respiratory syncytial virus (RSV) infection. J Pediatr. 2003;143(5 suppl):S112–S117. doi: 10.1067/s0022-3476(03)00508-0. - DOI - PubMed

MeSH terms