. 2024 Dec;13(1):2421745.
doi: 10.1080/21623945.2024.2421745. Epub 2024 Nov 1.

A key role for P2RX5 in brown adipocyte differentiation and energy homeostasis

Affiliations

A key role for P2RX5 in brown adipocyte differentiation and energy homeostasis

Maria Razzoli et al. Adipocyte. 2024 Dec.

Abstract

Brown adipocytes are defined based on a distinct morphology and genetic signature that includes, amongst others, the expression of the Purinergic 2 Receptor X5 (P2RX5). However, the role of P2RX5 in brown adipocyte and brown adipose tissue function is poorly characterized. In the present study, we conducted a metabolic characterization of P2RX5 knockout male mice; next, we characterized this purinergic pathway in a cell-autonomous context in brown adipocytes. We then tested the role of the P2RX5 receptor agonism in metabolic responses in vivo in conditions of minimal adaptive thermogenesis requirements. Our data show that loss of P2RX5 causes reduced brown adipocyte differentiation in vitro, and browning in vivo. Lastly, we unravel a previously unappreciated role for P2RX5 agonism to exert an anti-obesity effect in the presence of enhanced brown adipose tissue recruitment in male mice housed at thermoneutrality. Altogether, our data support a role for P2RX5 in mediating brown adipocyte differentiation and function that could be further targeted for benefits in the context of adipose tissue pathology and metabolic diseases.

Keywords: ATP; Purinergic receptors; adipogenesis; browning; sympathetic nerves.


Conflict of interest statement

No potential conflict of interest was reported by the author(s).

Figures
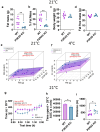
Figure 1.
Figure 1.
Metabolic characterization of P2RX5 knockout and wild-type mice at room temperature. (a–d) body composition: fat mass t = 3.34, df = 14, p = 0.005; % fat mass t = 3.99, df = 14, p = 0.001; body weight t = 1.24, df = 14, p = 0.23; fat free mass t = 1.60, df = 14, p = 0.13. (e–f) indirect calorimetry results illustrating energy expenditure (EE) in consideration of both fat mass (FM) and fat free mass (FFM) across 24 h at room temperature (H, fat mass F(1,12) = 5.94, p = 0.03; fat free mass F(1,12) = 0.30, p = 0.59, genotype F(1,12) = 5.10, p = 0.04) as well as during a 4 h cold challenge (I, fat mass F(1,12) = 7.87, p = 0.02; fat free mass F(1,12) = 0.001, p = 0.98, genotype F(1,12) = 5.09, p = 0.04). (g–i) results from the thermal gradient test, expressing the time spent at temperatures >29°C as intervals (G, time F(11,54 = 13.44, p < 0.001, genotype F(1,14) = 2.65, p = 0.13; time x genotype F(11,54) = 2.59, p < 0.001), as well as as area under the curve (AUC) (H, t = 1.98, df = 156,p = 0.049) as well as distance covered during 2 h testing (I, t = 2.34, df = 14, p = 0.03). N = 8/genotype. *p < 0.05, **p < 0.01.
Panel A: Histological comparison of WT and P2RX5 KO tissues (white adipose tissue, skeletal muscle and brown adipose tissue), at two magnifications, stained with H&E. Panel B: Histological comparison of WT and P2RX5 KO brown adipose tissue, at two magnifications, stained with UCP1 antibody. Panel C: Histological comparison of WT and P2RX5 KO brown adipose tissue, stained with TH. Bar graph showing the number of TH positive fibres on 100 adipocytes between WT and P2RX5 KO tissues.
Figure 2.
BAT histology in P2RX5 knockout and wild-type and mice. (a) Representative images of H&E staining of interscapular BAT obtained from wild-type and P2RX5 knockout mice (n = 3). (b) IHC performed on the same samples, disclosed a lower lever of UCP1 expression (blunted brown colour) in P2RX5 knockout mice. To note, the larger lipid droplets (L) present in brown adipocytes of knockout mice compared to wild-type (v = blood vessels; skM = skeletal muscle). See also Supplementary Figure S2c for the other tissues analysed from other WT and P2RX5 KO mice showing consistent and reproducible morphology across subjects. N = 3/group. (c) TH-IHC highlighting a lower density of fibres (brown spots) in the BAT of P2RX5 knockout mice. The qualitative observation was supported by morphometric evaluation confirming a significant difference in fibre density (t = 4.02, df = 4, p = 0.02). Scale bar in top rows of A and B = 100 µm. Scale bar in the bottom rows of A = 50 µM and B = 20 µm. Scale bar in C = 20 µm.
Figure 3.
Figure 3.
P2RX5 knockdown in brown adipocytes. (a) shRNA KD validation (Kruskal-Wallis = 9.3, p = 0.0192) shRNA 2 (KD 2) was selected for further analyses (b). Ki67 expression in non-targeting control (NT) and P2RX5 KD2 shRNA (t = 0.56, df = 3, p = 0.31). (c) BODIPY staining in NT and P2RX5 KD2 shRNA (representative of N = 4; scale bar = 30 µm). d−g) gene expression in differentiated adipocytes. (d) P2RX5 expression in NT and P2RX5 KD2 shRNA (t = 2.423, df = 8, p = 0.042) (e) PPARγ expression in NT and P2RX5 KD2 shRNA (t = 4.570, df = 8, p = 0.0009). (f) PGC1α expression in NT and P2RX5 KD2 shRNA (t = 4.673, df = 8, p = 0.0008). (g) UCP1 expression in NT and P2RX5 KD2 shRNA mRNA (t = 3.649, df = 8, p = 0.0033). (h) UCP1 protein (t = 4.61, df = 6, p = 0.002) with representative immunoblots in NT and P2RX5 KD2 conditions (the unedited blots are in supplementary figure S4). (i) Representative immunoblots and relative expression of phospho-p-38 and total p38 in the vehicle and ATPγS in NT (t = 4.180, df = 6, p = 0.0029) and P2×R5KD shRNA (t = 2.787, df = 6, p = 0.0317) in pre-adipocytes (the unedited blots are in Supplementary figure S5). (j) Representative immunoblots and relative expression of phospho-p-38 and total p38 in the vehicle, ATPγS and CL316,243 (CL) in NT (F2,8 = 41.93, p = 0.0001) and P2×R5KD (F2,9 = 6.515, p = 0.0178) shRNA in adipocytes (the unedited blots are in Supplementary figure S6). N = 4-5 from 2 independent experiments. *p < 0.05, **p < 0.01, ****p < 0.0001.
Figure 4.
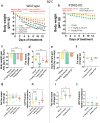
Figure 4.
Pharmacological characterization of P2RX5 knockout (KO) (N = 5-6/treatment) and wild-type mice (N = 5-11/treatment) to adrenergic and purinergic agonism at thermoneutrality (30°C). (a–b) body weight change after a month of acclimation to 30°C during 13 daily treatment injections. (c–e) body weight area under the curve during the pharmacological treatment. (d–f) fat mass change and (g–i) fat free mass change during the pharmacological treatment. h-j) protein expression of UCP1 over beta-tubulin loading control relative to the vehicle group. Western Blot images can be found in Supplementary Figure S7. *p < 0.05, **p < 0.01, ****p < 0.0001.

Similar articles

Cited by

References

    1. Cypess AM, Lehman S, Williams G, et al. Identification and importance of brown adipose tissue in adult humans. N Engl J Med. 2009;360(15):1509–12. doi: 10.1056/NEJMoa0810780 - DOI - PMC - PubMed
    1. Leitner BP, Huang S, Brychta RJ, et al. Mapping of human brown adipose tissue in lean and obese young men. In: PNAS; 2017. Vol. 114. p. 8649–8654. - PMC - PubMed
    1. Fischer AW, Cannon B, Nedergaard J.. The answer to the question “what is the best housing temperature to translate mouse experiments to humans?” is: thermoneutrality. Mol Metab. 2019;26:1–3. doi: 10.1016/j.molmet.2019.05.006 - DOI - PMC - PubMed
    1. Fischer AW, Cannon B, Nedergaard J. Optimal housing temperatures for mice to mimic the thermal environment of humans: an experimental study. Mol Metab. 2018;7:161–170. doi: 10.1016/j.molmet.2017.10.009 - DOI - PMC - PubMed
    1. Xiao C, Goldgof M, Gavrilova O, et al. Anti-obesity and metabolic efficacy of the β3-adrenergic agonist, CL316243, in mice at thermoneutrality compared to 22°C. Obesity (Silver Spring). 2015;23(7):1450–1459. doi: 10.1002/oby.21124 - DOI - PMC - PubMed

Substances