. 2024 Dec 1;4(12):3049-3066.
doi: 10.1158/2767-9764.CRC-23-0489.

Dynamic Evolution of Fibroblasts Revealed by Single-Cell RNA Sequencing of Human Pancreatic Cancer

Affiliations

Dynamic Evolution of Fibroblasts Revealed by Single-Cell RNA Sequencing of Human Pancreatic Cancer

Slavica Dimitrieva et al. Cancer Res Commun. .

Abstract

Abstract: Cancer progression and response to therapy are inextricably reliant on the coevolution of a supportive tissue microenvironment. This is particularly evident in pancreatic ductal adenocarcinoma, a tumor type characterized by expansive and heterogeneous stroma. Herein, we employed single-cell RNA sequencing and spatial transcriptomics of normal, inflamed, and malignant pancreatic tissues to contextualize stromal dynamics associated with disease and treatment status, identifying temporal and spatial trajectories of fibroblast differentiation. Using analytical tools to infer cellular communication, together with a newly developed assay to annotate genomic alterations in cancer cells, we additionally explored the complex intercellular networks underlying tissue circuitry, highlighting a fibroblast-centric interactome that grows in strength and complexity in the context of malignant transformation. Our study yields new insights on the stromal remodeling events favoring the development of a tumor-supportive microenvironment and provides a powerful resource for the exploration of novel points of therapeutic intervention in pancreatic ductal adenocarcinoma.

Significance: Pancreatic cancer remains a high unmet medical need. Understanding the interactions between stroma and cancer cells in this disease may unveil new opportunities for therapeutic intervention.


Conflict of interest statement

J. Chang reports personal fees from Novartis outside the submitted work. K. Lage reports being a consultant to ZS Associates and Sidera Bio and an equity holder in Sidera Bio, none of these roles are relevant to the work published here. G. Li reports employment with Novartis. D.T. Ting reports personal fees and other from ROME Therapeutics and PanTher Therapeutics, other from TellBio Inc., and ImproveBio Inc., personal fees from Moderna, Ikena Oncology, Sonata Therapeutics, AstraZeneca, abrdn, and Tekla Capital, and grants from Sanofi, Ava Therapeutics, Incyte Pharmaceuticals, and Astellas outside the submitted work. A.L. Grauel reports personal fees from Novartis Institutes for Biomedical Research during the conduct of the study. J.P. Wagner reports personal fees from Novartis during the conduct of the study, as well as other from Novartis outside the submitted work. G. Dranoff reports other from Novartis Pharmaceuticals during the conduct of the study, as well as other from Novartis Pharmaceuticals outside the submitted work. J.A. Engelman reports being an employee and equity holder of Treeline Biosciences. R. Leary reports personal fees from Novartis during the conduct of the study, as well as being a Novartis shareholder. A.S. Liss reports grants from Novartis and NIH during the conduct of the study, as well as other from Flare Therapeutics outside the submitted work. V. Cremasco reports personal fees from Novartis during the conduct of the study, as well as personal fees from Novartis outside the submitted work. No disclosures were reported by the other authors.

Figures
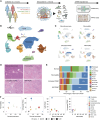
Figure 1
Figure 1
scRNA-seq of human pancreatic tissues. A, Schematic representation of the types of tissues employed in this study and the experimental pipeline for their analysis by scRNA-seq. B, UMAP visualization of single cells from all samples colored by cell type. C, UMAP projections of single cells from each tissue type (colored) contributing to the global UMAP (gray). D, Representative images of H&E-stained sections of each tissue type. Scale bar, 100 μm. E, Quantification of cell types within each tissue type. F, Quantification of cell populations (% from the total) along with the number of DE genes in each cell population between tissue types. UMAP, Uniform Manifold Approximation and Projection for Dimension Reduction; H&E, hematoxylin and eosin.
Figure 2
Figure 2
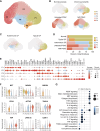
Genetic and transcriptomic features define distinct ductal cell populations. A, UMAP projection based on the top five PCs of ductal cell transcriptomes. B, Bubble plot demonstrating relative expression of marker genes across clusters. The intensity of the color is proportional to the average expression of the marker within a cluster, and the bubble size is proportional to the number of cells expressing the marker. C, Quantification of each cluster within tissue types. D, UMAP projections of KRAS mutation status in single cells. Subclustering of the ductal cell population is shown on the right. E, Violin plots indicating the expression of marker genes for cancer (FXYD3), normal duct (SLCA4), and hybrid (CRISP3, MUC5B, and SCGB3A1) cells in the three ductal cell clusters. Expression values in natural-log scale. F, Representative images of RNA-ISH (top) and H&E (bottom)-stained section tissue. Composition of RNA-ISH probe cocktails is indicated below. Normal pancreas was used to demonstrate staining of centroacinar cells/small duct (HTB2875) and centroacinar cell/large ducts (HTB2953). PDAC samples were used to demonstrate the staining of acinar-to-ductal metaplasia (HTB2903) and cancer cells (HTB2883). Scale bars, 100 μm for large images and 25 μm for inset images. UMAP, Uniform Manifold Approximation and Projection for Dimension Reduction; H&E, hematoxylin and eosin.
Figure 3
Figure 3
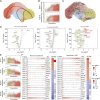
Distinct fibroblast populations are associated with tissue types. A, UMAP projection based on the top five PCs of fibroblast single-cell transcriptomes. B, UMAP projections of single cells from each tissue type (colored) contributing to the fibroblast UMAP (gray). C, UMAP projections of single cells from autoimmune (left) and idiopathic (right) chronic pancreatitis samples (colored) contributing to the fibroblast UMAP (gray). D, Quantification of each fibroblast cluster within tissue types. E, Bubble plot demonstrating relative expression of marker genes across clusters. The intensity of the color is proportional to the average expression of the marker within a cluster, and the bubble size is proportional to the number of cells expressing the marker. F, Violin plots of the expression of genes with defined roles in fibroblast biology. G, Visualization of selected KEGG and Reactome pathways significantly enriched in fibroblast clusters. The bubble size is proportional to the number of genes enriched, and the intensity of the color is proportional to significance of the enrichment. Normal fibroblasts (F1); inflammatory fibroblasts (F2); injury-reactive fibroblasts (F3); transitional fibroblasts (F4); CAFs (F5). UMAP, UMAP, Uniform Manifold Approximation and Projection for Dimension Reduction.
Figure 4
Figure 4
Differentiation of fibroblasts is coupled with a loss of transcriptional regulatory programs. A, Trajectory analysis of fibroblast subclusters inferred by Slingshot. B, Gene expression of CAF marker genes plotted along the pseudotime trajectory leading to CAFs. Expression values in natural-log scale. C, RNA velocity analysis of fibroblast cells. D, Volcano plots of DE genes between fibroblast populations. Transcription factors that are DE between populations, with an adjusted P value <0.01 and average log2FC > 0.5 in absolute value, are indicated. E, Gene expression of selected transcription factors plotted along the pseudotime trajectory leading to CAFs. Expression values in natural-log scale. F, Top 20 candidate master regulators of transcriptional program altered between fibroblast populations identified by the master regulator analysis algorithm (MARINa). The targets of each transcription factor are shown in vertical bars (repressed genes are in blue, and activated genes in red) and are rank-sorted (x-axis) from the one most downregulated to the one most upregulated in the selected conditions: normal fibroblasts compared with transitional fibroblasts and transitional compared with CAFs. The heatmaps on the right side of each panel indicate inferred differential activity (Act) and differential expression (Exp) of the transcription factor. MARINa, MAster Regulator INference algorithm.
Figure 5
Figure 5
Integration of single-cell and spatial transcriptomics reveals spatially defined fibroblast populations. A, Marker gene expression for fibroblast clusters overlayed on untreated PDAC sample HTB2779. Black box corresponds to that in whole mount image in B. B, Whole mount image and progressively higher magnifications of H&E-stained section of HTB2779. Scale bars, 2 mm (left), 300 μm (middle), and 60 μm (right). The locations of histologically defined cancer glands are indicated by black arrows. C, Marker gene expression for fibroblast clusters overlayed on NAT-PDAC sample HTB2903. Black box corresponds to that in whole mount image in D. D, Whole mount image and progressively higher magnifications of H&E-stained section of HTB2903. Scale bars, 2 mm (left), 300 μm (middle), and 60 μm (right). The locations of histologically defined cancer glands are indicated by black arrows. H&E, hematoxylin and eosin.
Figure 6
Figure 6
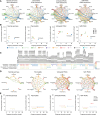
Fibroblasts drive intercellular communication in the tumor microenvironment of PDAC. A, Aggregated cell–cell communication network in normal pancreas, pancreatitis, untreated PDAC, and NAT-PDAC samples showing the signaling (edges) sent from each cell population (nodes) inferred using CellChat. The edge weights between any two cell populations are scaled to reflect the total number of inferred interactions. All fibroblast cells are shown as one cell population, to depict the overall interactome driven by the fibroblast compartment as a totality. B, Comparison of incoming and outgoing signaling for different cell populations in each tissue type. C, Receptor–ligand interaction pairs regulating fibroblasts to epithelial cell communication. D, Visualization of inferred cellular communication between mesenchymal and ductal cell populations calculated based on the aggregated cell–cell communication network using CellChat. Each fibroblast subset is separated in this analysis to depict subset-specific interactions. E, Comparison of strengths of incoming and outgoing signaling in each fibroblast subset.
Figure 7
Figure 7
TGFβ is a key mediator of gene expression in both cancer cells and CAFs. A and B, Circos plots depicting inferred ligand-to-target signaling between target genes (red) in fibroblasts (A) and cancer cells (B) and their associated paracrine (blue) or autocrine (yellow) ligands identified using NicheNet. Selected target genes represent those enriched in CAFs and transitional fibroblasts from untreated PDAC, relative to normal fibroblasts (A) or cancer cells relative to normal ductal cells (B). Within each panel, arrow colors indicate the population of cells expressing the ligand and their width indicate the ligand–receptor interaction weights. C, Dotplot displaying the expression of ligands identified in A and B in each cell population. The size of the dot represents the percentage of cells expressing that ligand, and color indicates the average expression level of the ligand across all cells within a cell population. D, Heatmap depicting the inferred contribution of cell populations to TGFβ signaling using CellChat. E, Hierarchical network diagram visualizing the inferred intercellular communication patterns for TGFβ signaling. Source and target cell populations are represented by solid and open circles, respectively. Line thickness is proportional to the communication probability between cell populations.

References

    1. de Visser KE, Joyce JA. The evolving tumor microenvironment: from cancer initiation to metastatic outgrowth. Cancer Cell 2023;41:374–403. - PubMed
    1. Olumi AF, Grossfeld GD, Hayward SW, Carroll PR, Tlsty TD, Cunha GR, et al. . Carcinoma-associated fibroblasts direct tumor progression of initiated human prostatic epithelium. Cancer Res 1999;59:5002–11. - PMC - PubMed
    1. Orimo A, Gupta PB, Sgroi DC, Arenzana-Seisdedos F, Delaunay T, Naeem R, et al. . Stromal fibroblasts present in invasive human breast carcinomas promote tumor growth and angiogenesis through elevated SDF-1/CXCL12 secretion. Cell 2005;121:335–48. - PubMed
    1. Lo A, Wang L-CS, Scholler J, Monslow J, Avery D, Newick K, et al. . Tumor-promoting desmoplasia is disrupted by depleting FAP-expressing stromal cells. Cancer Res 2015;75:2800–10. - PMC - PubMed
    1. Kraman M, Bambrough PJ, Arnold JN, Roberts EW, Magiera L, Jones JO, et al. . Suppression of antitumor immunity by stromal cells expressing fibroblast activation protein-alpha. Science 2010;330:827–30. - PubMed

Publication types

MeSH terms