. 2024 Dec 1;4(12):3067-3083.
doi: 10.1158/2767-9764.CRC-24-0310.

Single-Cell Analysis of Bone Marrow CD8+ T Cells in Myeloid Neoplasms Reveals Pathways Associated with Disease Progression and Response to Treatment with Azacitidine

Affiliations

Single-Cell Analysis of Bone Marrow CD8+ T Cells in Myeloid Neoplasms Reveals Pathways Associated with Disease Progression and Response to Treatment with Azacitidine

Athanasios Tasis et al. Cancer Res Commun. .

Abstract

Abstract: CD8+ T cells are crucial for antitumor immunity. However, their functionality is often altered in higher-risk myelodysplastic neoplasms (MDS) and acute myeloid leukemia (AML). To understand their role in disease progression, we conducted a comprehensive immunophenotypic analysis of 104 pretreatment bone marrow (BM) samples using mass and flow cytometry. Our findings revealed an increased frequency of CD57+CXCR3+ subset of CD8+ T cells in patients who did not respond to azacitidine (AZA) therapy. Furthermore, an increased baseline frequency (>29%) of the CD57+CXCR3+CD8+ T-cell subset was correlated with poor overall survival. We performed single-cell RNA sequencing to assess the transcriptional profile of BM CD8+ T cells from treatment-naïve patients. The response to AZA was linked to an enrichment of IFN-mediated pathways, whereas nonresponders exhibited a heightened TGF-β signaling signature. These findings suggest that combining AZA with TGF-β signaling inhibitors targeting CD8+ T cells could be a promising therapeutic strategy for patients with higher-risk MDS and AML.

Significance: Immunophenotypic analysis identified a BM CD57+CXCR3+ subset of CD8+ T cells associated with response to AZA in patients with MDS and AML. Single-cell RNA sequencing analysis revealed that IFN signaling is linked to the response to treatment, whereas TGF-β signaling is associated with treatment failure, providing insights into new therapeutic approaches.


Conflict of interest statement

A. Tasis reports personal fees from General Secretariat for Research and Technology Management and Implementation Authority for Research, Technological Development, and Innovation Actions during the conduct of the study. E. Lamprianidou reports personal fees from General Secretariat for Research and Technology Management and Implementation Authority for Research, Technological Development, and Innovation Actions during the conduct of the study. T. Chavakis reports grants from Deutsche Forschungsgemeinschaft during the conduct of the study. I. Kotsianidis reports grants from AbbVie outside the submitted work. I. Mitroulis reports grants and personal fees from General Secretariat for Research and Technology Management and Implementation Authority for Research, Technological Development, and Innovation Actions and Hellenic Foundation for Research and Innovation during the conduct of the study. No disclosures were reported by the other authors.

Figures

Figure 1
Figure 1
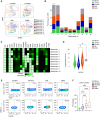
Untargeted analysis of CD45+ immune cells in patients with MDS, AML, and CMML by CyTOF. A, Multidimensional scale plot depicting the relationship between BM samples of patients with LR-MDS (n = 12), HR-MDS (n = 15), AML (n = 16), and CMML (n = 5). B, Heatmap showing the expression of the markers used for the characterization of each cell cluster. C, UMAP displaying the major immune cell clusters. D, Box charts displaying the frequency of each cell cluster. E, Violin plots showing the expression level of CXCR3 in the CD8 T1, CD8 T2, and CD4 T2 clusters, respectively. Kruskal–Wallis followed by the “two-stage” Benjamini, Krieger, and Yekutieli multiple comparison test was used in D. One-way ANOVA followed by the “two-stage” Benjamini, Krieger, and Yekutieli multiple comparison test was used in E. *, P < 0.05; **, P < 0.01.
Figure 2
Figure 2
Identification of a CD8+ subpopulation (CD57+CXCR3+) which distinguishes patients with MDS from patients with AML and CMML. A, Representative viSNE plots, derived from the FlowSOM analysis of BM CD8+ T cells from patients with LR-MDS (n = 12), HR-MDS (n = 15), AML (n = 16), and CMML (n = 5). B, Bar plots displaying the proportion of the metaclusters between the groups, expressed as percentage within CD8+ T cells. C, Heatmap depicting the expression level of the T-related markers between the metaclusters. D, Violin plots showing the expression level of CXCR3 in metacluster 1. E, Representative flow cytometry plots for the identification of the CD57+CXCR3+CD8+ T cell subpopulation in a cohort of patients with LR-MDS (n = 7), HR-MDS (n = 27), AML (n = 20), and CMML (n = 10). F, Percentage of CD57+CXCR3+ cells within CD8+ T cells. Kruskal–Wallis was used in B and D. One-way ANOVA followed by the “two-stage” Benjamini, Krieger, and Yekutieli multiple comparison test was used in F. *, P < 0.05; ***, P < 0.001.
Figure 3
Figure 3
Association between the frequency of CD57+CXCR3+CD8+ T cells and outcome in patients with HR-MDS and AML under treatment with AZA. A, Box plots displaying the percentage of the CD57+CXCR3+ cells within CD8+ T cells, assessed by flow cytometry in responders and nonresponders (HR-MDS, n = 12 responders and 9 nonresponders; AML, n = 9 responders and 11 nonresponders; CMML, n = 5 responders and 5 nonresponders). B, After stratification of patients with HR-MDS and AML to responders (n = 12) and nonresponders (n = 19), FlowSOM analysis was performed on BM CD8+ T cells, which generated six metaclusters that are projected onto the viSNE plots. Representative viSNE plots (one for each group) are shown. C, Box plots showing the proportion of all metaclusters, expressed as the frequency within CD8+ T cells. D, Heatmap depicting the expression levels of all T-related markers. E, Kaplan–Meier curves for OS in patients which received AZA treatment, with ≤29% (n = 51) and >29% (n = 26) CD57+CXCR3+ CD8+ T cells before treatment initiation. The survival curves were compared by the log-rank (Mantel–Cox) test, and the P value is shown. The median OS of the ≤29% group was 20.98 months, whereas the median OS of the >29% group was 12.05 months. F, Survival curves for each disease subgroup. Increased (%) CD57+CXCR3+ correlates significantly with worse survival in patients with HR-MDS and AML, whereas no association is observed in patients with CMML. G, Patients with HR-MDS and AML with ≤29% CD57+CXCR3+ exhibited higher response rates. No association between the frequency of CD57+CXCR3+CD8+ T cells and response to therapy was observed in patients with CMML. An unpaired Student t test was used in A. A Mann–Whitney U test was used in D. **, P < 0.01; ***, P < 0.001.
Figure 4
Figure 4
Profiling of BM-derived CD8+ T cells of patients with HR-MDS and secondary AML with scRNA-seq. A, UMAP of CD8+ T cells identified 11 clusters. A total of 28,449 CD8+ T cells were pooled from four patients with HR-MDS (15,597 cells) and five patients with secondary AML (12,852 cells). B, Bubble plot depicting the average expression of genes used to characterize the clusters. C, Expression of selected genes projected onto UMAPs. D, Heatmap showing selected top DEGs for each cell cluster. E, Ridgeline plots displaying the cytotoxic signature score for each cell cluster, as defined by the expression of key-related genes. F, Ridgeline plots displaying the cell-cycle signature score for each cell cluster.
Figure 5
Figure 5
BM-derived CD8+ T cells from responders (CR) to AZA show an enhanced ISG molecular signature compared with nonresponders (FAIL) in scRNA-seq analysis. A, Comparison of separate UMAPs for CR (a total of 13,667 cells, including 7,571 from patients with MDS and 6,096 cells from patients with secondary AML, respectively) and FAIL patients (a total of 14,782 cells, including 8,026 cells from patients with MDS and 6,756 cells from patients with secondary AML, respectively). B, Stacked bar chart showing the average distribution of clusters between the two groups. The percentage of cluster 10 (proliferative) was increased in CR compared with FAIL patients (unpaired Student t test, P = 0.0418). C, Dot plot representing MSigDB (Hallmark 2020) enrichment analysis of positively enriched pathways in CR patients. Enriched pathways with a q-value <0.05 (Benjamini–Hochberg correction) are shown. D, Gradient expression of representative selected genes involved in IFN-related pathways, as they are projected onto UMAPs. E, ISG score of cluster 0 (GZMK) and violin plots showing the expression levels of the top differentially expressed IFN-stimulated genes of cluster 0 (GZMK) between CR and FAIL. F, ISG score of cluster 1 (EOMES) and violin plots showing the expression levels of the top differentially expressed IFN-stimulated genes of cluster 1 (EOMES) between CR and FAIL. G, ISG score of cluster 2 (CTL_1) and violin plots displaying the expression levels of the top differentially expressed IFN-stimulated genes of cluster 2 (CTL_1) between CR and FAIL. H, ISG score of cluster 4 (CTL_2) and violin plots displaying the expression levels of the top differentially expressed IFN-related genes of cluster 4 (CTL_2) between CR and FAIL.
Figure 6
Figure 6
BM-derived CD8+ T cells of nonresponders (FAIL) displayed a suppressed cytotoxic molecular signature at the single-cell level. A, Dot plot representing MSigDB (Hallmark 2020) enrichment analysis of positively enriched pathways in FAIL patients. Enriched pathways with a q-value <0.05 (Benjamini–Hochberg correction) are shown. B, TGF-β signaling score of cluster 2 (CTL_1) and violin plots displaying the expression levels of the top DEGs of cluster 2 (CTL_1), involved in the enrichment of the TGF-β signaling pathway between CR and FAIL. C, TGF-β signaling score of cluster 4 (CTL_2) and violin plots displaying the expression levels of the top DEGs of cluster 4 (CTL_2), involved in the enrichment of the TGF-β signaling pathway between CR and FAIL. D, Comparison of the cytotoxic score of each group, as it is projected onto the respective UMAPs. E, Cytotoxic score of cluster 2 (CTL_1) and violin plots exhibiting the expression levels of the top differentially expressed cytotoxicity-related genes of cluster 2 (CTL_1) between CR and FAIL. F, Cytotoxic score of cluster 4 (CTL_2) and violin plots exhibiting the expression levels of the top differentially expressed cytotoxicity-related genes of cluster 4 (CTL_2) between CR and FAIL.
Figure 7
Figure 7
TF regulatory network analysis in BM-derived CD8+ T cells. A, UMAP depicting the clustering of CD8+ T cells based on regulons. B, Pie charts illustrating the representation of cells from CR and FAIL patients within each regulon. C, Comparison of cell distribution in regulons between the groups using separate UMAPs for each group. D, Heatmap showing the top differentially activated TFs of each regulon cluster. E and F, Violin plots depicting the activity score of selected TFs per sample type in regulons 5 and 7, respectively.

References

    1. Arber DA, Orazi A, Hasserjian RP, Borowitz MJ, Calvo KR, Kvasnicka H-M, et al. . International consensus classification of myeloid neoplasms and acute leukemias: integrating morphologic, clinical, and genomic data. Blood 2022;140:1200–28. - PMC - PubMed
    1. Ogawa S. Genetics of MDS. Blood 2019;133:1049–59. - PMC - PubMed
    1. Itzykson R, Fenaux P. Epigenetics of myelodysplastic syndromes. Leukemia 2014;28:497–506. - PubMed
    1. Rodriguez-Sevilla JJ, Colla S. T cell dysfunctions in myelodysplastic syndromes. Blood 2024;143:1329–43. - PubMed
    1. Balderman SR, Li AJ, Hoffman CM, Frisch BJ, Goodman AN, LaMere MW, et al. . Targeting of the bone marrow microenvironment improves outcome in a murine model of myelodysplastic syndrome. Blood 2016;127:616–25. - PMC - PubMed

Publication types

MeSH terms

Substances