. 2024 Nov 1:13:RP92914.
doi: 10.7554/eLife.92914.

A scenario for an evolutionary selection of ageing

Affiliations

A scenario for an evolutionary selection of ageing

Tristan Roget et al. Elife. .

Abstract

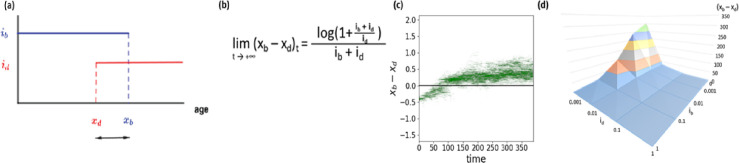
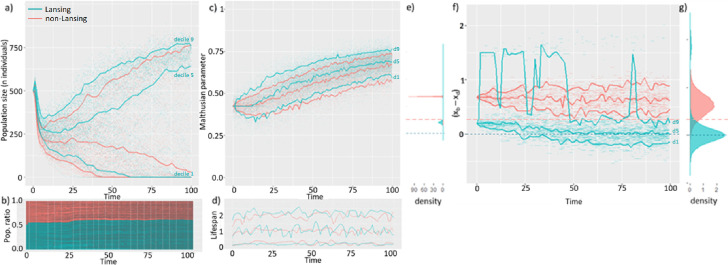
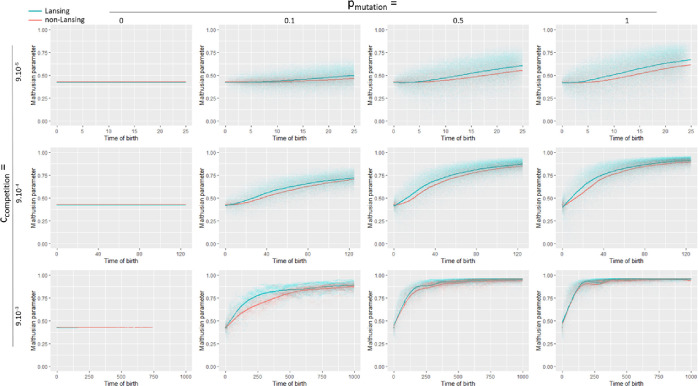
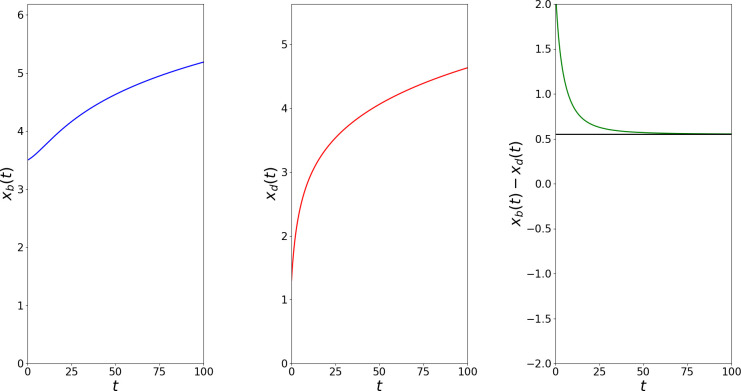
Signs of ageing become apparent only late in life, after organismal development is finalized. Ageing, most notably, decreases an individual's fitness. As such, it is most commonly perceived as a non-adaptive force of evolution and considered a by-product of natural selection. Building upon the evolutionarily conserved age-related Smurf phenotype, we propose a simple mathematical life-history trait model in which an organism is characterized by two core abilities: reproduction and homeostasis. Through the simulation of this model, we observe (1) the convergence of fertility's end with the onset of senescence, (2) the relative success of ageing populations, as compared to non-ageing populations, and (3) the enhanced evolvability (i.e. the generation of genetic variability) of ageing populations. In addition, we formally demonstrate the mathematical convergence observed in (1). We thus theorize that mechanisms that link the timing of fertility and ageing have been selected and fixed over evolutionary history, which, in turn, explains why ageing populations are more evolvable and therefore more successful. Broadly speaking, our work suggests that ageing is an adaptive force of evolution.

Keywords: adaptability; ageing evolution; differential inclusion; evolutionary biology; none; two phases model.

Plain language summary

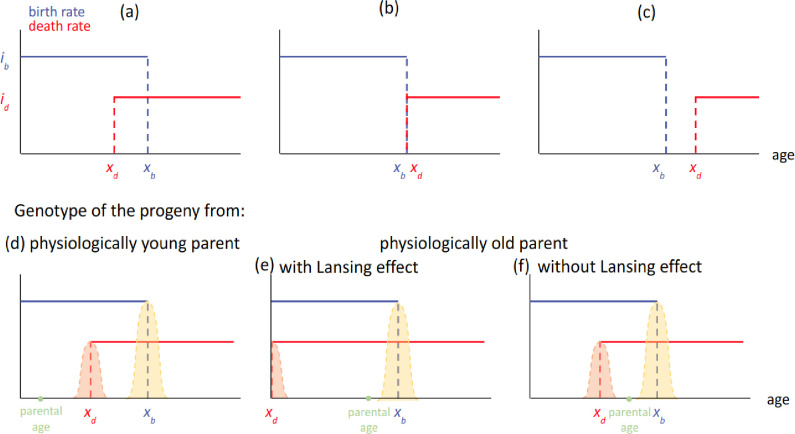
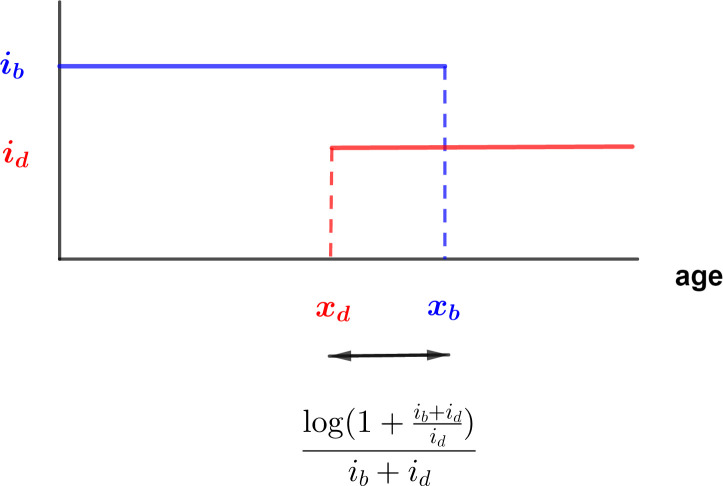
It is a question as old as Darwin’s theory of evolution itself: how is ageing affected by natural selection? The prevailing view is that the process of biological ageing is not adaptive and therefore not directly subject to selection pressures. Take for example a gene causing a fatal disease late after an average individual had reproduced, thus being passed on to the next generation despite its detriment to the individual. This suggests that natural selection acts less strongly on such genes, which can therefore accumulate and cause aging if they do not impact an organism’s reproductive fitness earlier in life. However, many studies have shown that specific genes control an animal’s lifespan and the onset of ageing through evolutionarily conserved mechanisms. For example, in fruit flies, aging can be categorised into two distinct phases determined by the manifestation of the so-called Smurf phenotype associated with accelerated signs of ageing and an increased risk of death. A pattern where the offspring of older parents live less long than those of younger parents has also been observed across species, also known as the Lansing effect. In this case, ageing can affect the reproductive success of future generations and can therefore be subject to selection pressures. Roget et al. looked at the trade-offs between an individual’s reproduction and homeostasis using a mathematical model to address whether the distinct phases of aging – as seen in the Smurf phenotype – can appear and be maintained throughout evolution. Using a mathematical model, Roget et al. simulated individuals possessing only one copy of two genes. One controls the duration of reproductive ability, and the other defines the age at which the risk of death becomes non-zero. This revealed that a simple hypothetical haploid and asexually reproducing system can evolve a life history separated into two phases in the computer simulations. Interestingly, the modelled organisms evolved in a way that the duration of reproduction exceeded the homeostatic maintenance duration. This generated a phase where individuals are capable of reproduction with a high risk of death, similar to the previously described Smurf phase. Roget et al. observed that aging populations showed a lower risk of extinction than non-aging ones, as well as an increased genetic variability of the offspring. The apparent benefits of ageing in this model imply that ageing can be an adaptive force of evolution and subject to positive selection or, at least less negative selection than expected. This minimal model helps explain trade-offs between reproduction and homeostatic maintenance during evolution. Further work may include parameters such as sexual reproduction and multiple gene copies.


Conflict of interest statement

TR, CM, PJ, SM, MR No competing interests declared

Figures

Figure 1.
Figure 1.. Three typical configurations of the model with ib >id and their effect on progeny’s genotypes as a function of parental age.
(upper panel) Each haploid individual is defined by a parameter xb defining its fertility span of intensity ib and a parameter xd defining the time during which it will maintain itself, with an intensity id. These parameters can be positive or null. (a) ’Too young to die’: it corresponds to configurations satisfying xd <xb. (b) ’Now useless’: it corresponds to configurations where xb = xd. (c) ‘Menopause’: it corresponds to configurations where xd >xb. (lower panel) Each individual may randomly produce a progeny during its fertility span [0; xb]. (d) In the case of physiologically young parents (a<xd), the progeny’s genotype is that of its parent ∓ a Gaussian kernel of mutation centered on the parental gene. In the case of the reproduction event occurring after xd, for configuration (a) above, two cases are observed, (e) if the organism carries a Lansing effect ability, the xd of its progeny will be strongly decreased. (f) In the absence of the Lansing effect, the default rule applies.
Figure 2.
Figure 2.. The bd model shows a convergence of xb - xd towards a positive value.
Dynamics of the individual-based model shows a convergence of xb - xd towards a positive constant value in the absence of the Lansing effect. (a) The generalized b-d model shows a convergence of (xb - xd) for any ib and id towards a positive value given by (b) (Annexe 4.3, Figure 2). (c) Simulation of 1000 individuals with initial trait (xb=1.2, xd=1.6) of intensities ib=id=1, a competition c=0.0009 and a mutation kernel (P=0.1, σ=0.05) show that the two parameters co-evolvetowards xb - xd ≅ 0.55 that is log(3)/2. (d) Landscape of solutions (xb - xd) as a function of ib and id (colors separate ranges of 50 units on the z-axis).
Figure 3.
Figure 3.. The Lansing effect maximizes populational survival by increasing its evolvability.
100 independent simulations were run with a competition intensity of 9.10–4 and a mutation rate p=0.1 on a mixed population made of 500 non-Lansing individuals and 500 individuals subjected to such effect. At t0, the population size exceeds the maximum load of the medium thus leading to a population decline at start. At t0, all individuals are of age 0. Here, we plotted a subset of the 100.106 plus individuals generated during the simulations. Each individual is represented by a segment between its time of birth and its time of death. In each graph, blue and red curves represent deciles 1, 5, and 9 of the distribution at any time for each population type. (a) The higher success rate of Lansing bearing populations does not seem to be associated with a significantly faster population growth but with a lower risk of collapse. (b) For cohabitating populations, the Lansing bearing population (blue) is overgrowing by only 10% the non-Lansing one (red). (c) This higher success rate is associated with a faster and broader exploration of the Malthusian parameter - surrogate for fitness - space in Lansing bearing populations (d) that is not associated with significant changes in the lifespan distribution (e) but a faster increase in genotypic variability within the [0; 10] time interval. (f) This occurs although progeny from physiologically old parents can represent up to 10% of the Lansing bearing population and leads to it reaching the theoretical optimum within the timeframe of simulation (g) with the exception of Lansing progenies. (e–g) Horizontal lines represent the theoretical limits for (xb - xd) in Lansing (blue) and non-Lansing (red) populations.
Figure 3—figure supplement 1.
Figure 3—figure supplement 1.. Evolution of the average Malthusian parameter value in Lansing and non-Lansing populations as a function of time.
p is the mutation rate and c is the logistic competition intensity. Individual values are plotted, the line represents the average value amongst populations. In all conditions with p > 0, the Malthusian parameter grows faster and remains slightly higher in the Lansing populations than in the non-Lansing ones.
Figure 3—figure supplement 2.
Figure 3—figure supplement 2.. Evolution of the Lansing and non-Lansing populations size as a function of time.
p is the mutation rate and c is the logistic competition intensity.
Figure 4.
Figure 4.. Mixed populations lead to (xb - xd) theoretical limit in a limited time and cohabitation of Lansing and non-Lansing populations.
Starting with a homogenous population of 5000 Lansing bearing and 5000 non-Lansing individuals with traits uniformly distributed from –10 to +10 (left panel), we ran 100 independent simulations on time in [0; 1000]. (center panel) Plotting the trait (xb - xd) as a function of time for one simulation shows a rapid elimination of extreme traits and branching evolution. (right panel) The final distribution of traits in each population type is centered on the theoretical convergence limit for each. Ntotal ≅ 110 millionindividuals, c=9.10–4, p=0.1.
Figure 5.
Figure 5.. The Lansing effect is associated with an increased fitness gradient.
We were able to derive Lansing and non-Lansing Malthusian parameters from the model’s equations (see Annexe 1–2.3 and 1–5) and plot them as a function of the trait (xb, xd). The diagonal xb = xd is drawn in light green. The corresponding isoclines are overlapping above the diagonal but significantly differ below, with non-Lansing fitness (red lines) being higher than that of Lansing’s (light blue lines). In addition, the distance between two consecutive isoclines is significantly more important in the lower part of the graph for non-Lansing than Lansing bearing populations. As such, a mutation leading a non-Lansing individual’s fitness going from 0.7 to 0.8 (yellow arrow) corresponds to a Lansing individual’s fitness going from 0.1 to 0.52. Finally, Hamilton’s decreasing force of selection with age can be observed along the diagonal with a growing distance between two consecutive fitness isoclines as xb and xd continue increasing.
Appendix 1—figure 1.
Appendix 1—figure 1.. The set V={(xb,xd)R+2;R(xb,xd)>1} is the convex set delimited by the black curve with equation R(xb,xd)=1.
Appendix 1—figure 2.
Appendix 1—figure 2.. Simulation of the canonical equation with x0=(3.5,1.3) and ib=id=1.
(a) Dynamics of xb. (b) Dynamics of xd. (c) Dynamics of, xbxd the black curve has equation. y=log(3)/2.
Appendix 1—figure 3.
Appendix 1—figure 3.. Optimal configurations as time tends to infinity.

Update of

  • doi: 10.1101/2022.03.11.483978
  • doi: 10.7554/eLife.92914.1
  • doi: 10.7554/eLife.92914.2

References

    1. Arslan RC, Willführ KP, Frans EM, Verweij KJH, Bürkner PC, Myrskylä M, Voland E, Almqvist C, Zietsch BP, Penke L. Older fathers’ children have lower evolutionary fitness across four centuries and in four populations. Proceedings. Biological Sciences. 2017;284:20171562. doi: 10.1098/rspb.2017.1562. - DOI - PMC - PubMed
    1. Blüher M, Kahn BB, Kahn CR. Extended longevity in mice lacking the insulin receptor in adipose tissue. Science. 2003;299:572–574. doi: 10.1126/science.1078223. - DOI - PubMed
    1. Burke MK, Barter TT, Cabral LG, Kezos JN, Phillips MA, Rutledge GA, Phung KH, Chen RH, Nguyen HD, Mueller LD, Rose MR. Rapid divergence and convergence of life-history in experimentally evolved Drosophila melanogaster. Evolution; International Journal of Organic Evolution. 2016;70:2085–2098. doi: 10.1111/evo.13006. - DOI - PubMed
    1. Cansell C, Goepp V, Bain F, Todd N, Douard V, Monnoye M, Sanchez C, Pietrancosta N, Rovere C, Denis RG, Luquet S, Rera M. 2023. Two phases model of ageing in mice: towards a better identification of age-related and late-life metabolic decline [Registered Report Stage 1 Protocol] figshare. - DOI
    1. Charlesworth B. Evolution in Age-Structured Populations. Cambridge University Press; 1994. - DOI