. 2024 Nov 5;121(45):e2408347121.
doi: 10.1073/pnas.2408347121. Epub 2024 Nov 1.

A meiotic driver hijacks an epigenetic reader to disrupt mitosis in noncarrier offspring

Affiliations

A meiotic driver hijacks an epigenetic reader to disrupt mitosis in noncarrier offspring

Yu Hua et al. Proc Natl Acad Sci U S A. .

Abstract

Killer meiotic drivers (KMDs) are selfish genetic elements that distort Mendelian inheritance by selectively killing meiotic products lacking the KMD element, thereby promoting their own propagation. Although KMDs have been found in diverse eukaryotes, only a limited number of them have been characterized at the molecular level, and their killing mechanisms remain largely unknown. In this study, we identify that a gene previously deemed essential for cell survival in the fission yeast Schizosaccharomyces pombe is a single-gene KMD. This gene, tdk1, kills nearly all tdk1Δ progeny in a tdk1+ × tdk1Δ cross. By analyzing polymorphisms of tdk1 among natural strains, we identify a resistant haplotype, HT3. This haplotype lacks killing ability yet confers resistance to killing by the wild-type tdk1. Proximity labeling experiments reveal an interaction between Tdk1, the protein product of tdk1, and the epigenetic reader Bdf1. Interestingly, the nonkilling Tdk1-HT3 variant does not interact with Bdf1. Cryoelectron microscopy further elucidated the binding interface between Tdk1 and Bdf1, pinpointing mutations within Tdk1-HT3 that disrupt this interface. During sexual reproduction, Tdk1 forms stable Bdf1-binding nuclear foci in all spores after meiosis. These foci persist in germinated tdk1Δ progeny and impede chromosome segregation during mitosis by generating aberrant chromosomal adhesions. This study identifies a KMD that masquerades as an essential gene and reveals the molecular mechanism by which this KMD hijacks cellular machinery to execute killing. Additionally, we unveil that losing the hijacking ability is an evolutionary path for this single-gene KMD to evolve into a nonkilling resistant haplotype.

Keywords: chromosome segregation; cryo-EM structure; epigenetic reader; killer meiotic driver; resistant haplotype.


Conflict of interest statement

Competing interests statement:The authors declare no competing interest.

Figures

Fig. 1.
Fig. 1.
tdk1 is a KMD gene in S. pombe. (A) Schematic contrasting a single-gene KMD with an essential gene. (B) Spot assays showing normal growth of tdk1Δ cells of both h+ and h− mating types compared to wild-type controls. Fivefold serial dilutions of each strain were spotted onto YES (rich medium) or EMM (minimal medium). (C and D) Tetrad analyses of tdk1+ × tdk1+, tdk1+ × tdk1Δ, and tdk1Δ × tdk1Δ crosses, showing the inviability of tdk1Δ progeny from heterozygous but not homozygous deletion diploids. Six representative tetrads for each cross are displayed in (C), with progeny labeled A–D within each tetrad. The deletion of tdk1 was tracked using the drug resistance marker kanMX. (D) Statistical analyses of progeny viability. P values were calculated using Fisher’s exact test, comparing the viability of progeny from two crosses (null hypothesis: equal viability between crosses). n, total number of progeny analyzed. (E and F) Tetrad analyses showing that mutation of the start codon (tdk1-M1A) abolishes the killing activity of tdk1. P values were calculated using the exact binomial test, comparing the observed counts of viable progeny with indicated genotypes against the expected Mendelian segregation ratio of 1:1. n, total number of progeny analyzed. The insertion of wild-type tdk1 or tdk1-M1A at the ade6 locus was tracked using a linked drug resistance marker natMX. A schematic representation of the results is shown in (F).
Fig. 2.
Fig. 2.
tdk1 kills noncarrier offspring by disrupting mitosis. (A) Images of four spores from a tdk1+ × tdk1Δ tetrad showing that tdk1Δ spores undergo normal germination and outgrowth on a rich medium (YES). Genotypes were determined by replica-plating after colony formation. The deletion of tdk1 was tracked using the drug resistance marker kanMX. (Scale bar, 20 μm.) (B and C) Time-lapse fluorescence imaging revealing severe chromosome segregation defects in tdk1Δ but not tdk1+ progeny of heterozygous deletion diploids during the first mitosis after spore germination. Representative time-lapse images of a tdk1+ cell (Top), a tdk1Δ cell with the “anucleate daughter” phenotype (Middle), and a tdk1Δ cell with the “cut” phenotype (Bottom) are displayed in (B). H3-GFP serves as a chromatin marker, and fluorescence images of H3-GFP are merged with differential interference contrast images. (Scale bar, 3 μm.) (C) Quantification of mitotic cells with different phenotypes. n, number of mitotic cells analyzed.
Fig. 3.
Fig. 3.
Naturally occurring HT3 is a nonkilling resistant haplotype of tdk1. (A) tdk1 haplotype network constructed from 56 nonclonal haploid natural isolates of S. pombe (24), with circle size indicating the frequency of each haplotype (detailed information in Dataset S1). A black dot represents a putative ancestral haplotype, and hash marks indicate mutational steps. Nonsynonymous polymorphisms relative to the reference haplotype (HT1) are listed (Right). A multinucleotide polymorphism in HT4 affecting three successive codons (underscored) is considered a single mutational step. The internal repeat region, corresponding to residues 120 to 226, was omitted due to challenges in mapping and assembly. (B) Tetrad analyses performed on S. pombe natural isolates revealing that HT2, but not HT3, is an active KMD. (C) Tetrad analyses showing that the nonsynonymous polymorphisms in HT3 abolish killing activity but do not affect resistance to killing by tdk1. The tdk1-HT3 strain was constructed by introducing the six nonsynonymous polymorphisms of HT3 into the reference strain. (D) Tetrad analyses showing that the nonsynonymous polymorphisms in HT2 affect neither killing nor resistance activity. The tdk1-HT2 strain was constructed by introducing the three nonsynonymous polymorphisms of HT2 into the reference strain. P values in (BD) were calculated using the exact binomial test on counts of viable progeny with indicated genotypes. n, total number of progeny analyzed.
Fig. 4.
Fig. 4.
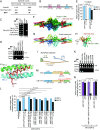
Tdk1-mediated killing requires its Bdf1-binding ability. (A) TurboID–mass spectrometry identifies Bdf1 as a highly enriched proximal interactor of Tdk1 but not Tdk1-HT3 (full results in Dataset S2). (B) Domain organization of Bdf1, featuring two bromodomains (BD1 and BD2) and an extraterminal domain (ET). (C) Y2H assays showing that Bdf1 interacts with Tdk1(227-357) (designated as Tdk1C) but not full-length Tdk1, Tdk1(1-226), or Tdk1C harboring mutations from HT3. BIRm refers to I235M and R255K mutations, situated within the BIR. AD and BD denote prey and bait constructs, respectively. −LW denotes the SD/−Leu/−Trp medium; −LWHA denotes the SD/−Leu/−Trp/−His/−Ade medium. (D) Y2H assays narrowing down the Tdk1-binding region of Bdf1 to residues 372 to 554. (E) Tetrad analyses showing that the killing of tdk1Δ progeny from a tdk1+ × tdk1Δ cross is substantially diminished in the absence of the bdf1 gene. (F and G) Cryo-EM density map (F) and structural model (G) of a complex between Tdk1(211-357) and Bdf1(372-554). Residues 211 to 354 of Tdk1 and residues 525 to 547 of Bdf1 are structurally resolved. Six Tdk1 molecules are colored differently, while all Bdf1 molecules are depicted in brick red. (H) Axial view of a Tdk1 trimer unit, related to (G) by a 90° rotation. (I). Ribbon representation of the Tdk1 structure predicted by AlphaFold (31, 32). NTD, stalk domain, and CTD are visually distinguished by distinct colors. (J) Expanded view of the interaction interface between Tdk1 and Bdf1. (K) Y2H assays showing that Bdf1 mutations within the Tdk1-binding interface disrupt interaction between Tdk1C and Bdf1. (L) Tetrad analyses showing that Bdf1 mutations within the Tdk1-binding interface disrupt Tdk1-mediated progeny killing. Wild-type or mutated bdf1 were integrated into a bdf1Δ strain at the ade6 locus. (M) Schematic illustration of Tdk1 and Tdk1-HT3, with amino acid differences in the BIR highlighted in red. (N) Tetrad analyses showing that the BIR mutations abolish the killing activity of tdk1. P values comparing two crosses in (E and L) were calculated using Fisher’s exact test. P values for each cross in (E and N) were calculated using the exact binomial test on counts of viable progeny with indicated genotypes. n, total number of progeny analyzed.
Fig. 5.
Fig. 5.
Linker-containing but not wild-type Tdk1 is toxic in vegetative cells. (A) Coimmunoprecipitation showing that in vegetative S. pombe cells, Tdk1C but not full-length Tdk1 interacts with Bdf1. IP, immunoprecipitation. IB, immunoblotting. (B) Schematic representation of Tdk1 variants containing linkers. Tdk1-1L, Tdk1-2L, and Tdk1-3L harbor a flexible linker (SGGGSSG) inserted at distinct positions (after residue 119, 184, or 275, respectively) in the stalk domain upstream of the BIR. (C) Y2H assays showing that linker-containing Tdk1 variants (Tdk1-1L, Tdk1-2L, and Tdk1-3L), but not full-length Tdk1, interact with Bdf1. (D) Spot assays showing that expression of linker-containing Tdk1 variants (Tdk1-1L, Tdk1-2L, and Tdk1-3L), but not wild-type Tdk1, induces toxicity in vegetative cells. Mutations in the BIR (BIRm) or deletion of the bdf1 gene abrogate this toxic effect. (E and F) Time-lapse fluorescence imaging showing mitotic defects in cells expressing Tdk1-1L, in contrast to those expressing wild-type Tdk1. Representative time-lapse images of a cell expressing Tdk1 (Left), a cell expressing Tdk1-1L with the “anucleate daughter” phenotype (Middle), and a cell expressing Tdk1-1L with the “cut” phenotype (Right) are displayed in (E). Ish1 serves as a nuclear envelope marker. BF, bright field. (Scale bar, 3 μm.) (F) Quantification of mitotic cells with different phenotypes. n, number of analyzed mitotic cells. Only cells with a detectable level of Tdk1 or Tdk1-1L were analyzed. In (A and DF), Tdk1 variants were expressed from the inducible P41nmt1 promoter (35).
Fig. 6.
Fig. 6.
Tdk1-mediated killing requires its attachment to chromosomes and its formation of foci. (A) Tetrad analyses showing that the histone binding activity of Bdf1 is required for Tdk1-mediated progeny killing. Mutations Y123A and Y293A disrupt the histone-binding pockets of BD1 and BD2, respectively. For the ET domain deletion, residues 430 to 510 of Bdf1 were deleted. Wild-type or mutated bdf1 were integrated into a bdf1Δ strain at the ade6 locus. P values were calculated using the exact binomial test on counts of viable progeny with indicated genotypes. n, total number of progeny analyzed. (B) Spot assays showing that Tdk1-1L-BIRm, but not Tdk1 or Tdk1-BIRm, exhibits toxicity when artificially tethered to BD1. Artificial tethering was achieved through the interaction between GBP and the GFP variant mECitrine. (C) Spot assays showing that Tdk1-1L-BIRm exhibits toxicity when tethered to two other histone reader domains: the PWWP domain, recognizing Set9-catalyzed H4K20 methylation (43, 44), and the PHD domain, recognizing Set1-catalyzed H3K4 methylation (45, 46). Toxicity is abolished in the absence of Set9 or Set1, respectively. (D) Spot assays showing that tethering Tdk1-1L-BIRm with histone H3 elicits toxicity that increases with the level of H3-GBP. Padf1, Prps901, and Pcyc1 are promoters of increasing strength. (E) Immunoblotting showing H3-GBP levels in (D). (F) Fluorescence micrographs showing localization of Tdk1, Tdk1-1L, Tdk1-BIRm, and Tdk1-1L-BIRm in vegetative cells. DIC, differential interference contrast. (Scale bar, 3 μm.) (GI) Time-lapse fluorescence imaging showing that attaching a Tdk1 focus to a specific chromosomal site impedes mitotic chromosome segregation at that site. A schematic of the site-specific attachment assay is presented in (G). The tetO array was integrated adjacent to the lacO array. LacIw is a LacI variant with reduced affinity for lacO (47). Representative time-lapse images of cells undergoing mitosis with repressed (Top) or induced (Bottom) expression of Tdk1-1L-BIRm are shown in (H). (Scale bar, 3 μm.) (I) Statistical analysis of (H), with P value calculated using Fisher’s exact test. A dividing cell is defined as a cell containing two separating nuclei, marked by the nuclear envelope marker Ish1. n, number of mitotic cells analyzed. In (BI), Tdk1 variants were expressed from the inducible P41nmt1 promoter (35).
Fig. 7.
Fig. 7.
Tdk1 in spores forms toxic Bdf1-binding foci that impede chromosome segregation in noncarrier offspring. (A) Fluorescence micrographs showing colocalization of Bdf1(524-554) with Tdk1 foci in spores of tdk1Δ/tdk1Δ ade6::tdk1-mECitrine/ade6::tdk1-mECitrine lys3::Pbdf1-CCHex-mCherry-bdf1(524-554)/lys3::Pbdf1-CCHex-mCherry-bdf1(524-554). (Scale bar, 3 μm.) (B) Fluorescence micrographs showing persistence of Tdk1 foci in tdk1Δ progeny of ura4-D18::tdk1-mTurquoise2/tdk1Δ::ura4 after spore germination. (Scale bar, 3 μm.) (C) Box plot showing the quantity of Tdk1-mECitrine molecules within individual foci in spores of ura4-D18::tdk1-mECitrine/tdk1Δ::ura4. Cnp1-mECitrine (endogenously tagged) was used as a calibration standard for fluorescence intensity comparison (51). Boxes represent median and interquartile range (25th-75th percentiles). Whiskers extend to minimum and maximum values. (D) Fluorescence micrographs showing resistance of Tdk1 foci to 5% 1,6-hexanediol (1,6-HD) treatment. Germinating tdk1Δ spores of ura4-D18::tdk1-mECitrine/tdk1Δ::ura4 were subjected to a 10-min exposure. (Scale bar, 3 μm.) (E) A diagrammatic model depicting how Tdk1 impedes chromosome segregation by forming foci and interacting with the epigenetic reader Bdf1.

Comment in

Similar articles

Cited by

References

    1. Sandler L., Novitski E., Meiotic drive as an evolutionary force. Am. Nat. 91, 105–110 (1957).
    1. Lyttle T. W., Segregation distorters. Annu. Rev. Genet. 25, 511–557 (1991). - PubMed
    1. Austin B., Trivers R., Burt A., Genes in Conflict: The Biology of Selfish Genetic Elements (Harvard University Press, 2009).
    1. Chmatal L., Schultz R. M., Black B. E., Lampson M. A., Cell biology of cheating-transmission of centromeres and other selfish elements through asymmetric meiosis. Prog. Mol. Subcell Biol. 56, 377–396 (2017). - PubMed
    1. Pardo-Manuel de Villena F., Sapienza C., Nonrandom segregation during meiosis: The unfairness of females. Mamm. Genome 12, 331–339 (2001). - PubMed

MeSH terms

Substances

LinkOut - more resources