. 2024 Nov;10(44):eadq6700.
doi: 10.1126/sciadv.adq6700. Epub 2024 Nov 1.

Stem cell-homing biomimetic hydrogel promotes the repair of osteoporotic bone defects through osteogenic and angiogenic coupling

Affiliations

Stem cell-homing biomimetic hydrogel promotes the repair of osteoporotic bone defects through osteogenic and angiogenic coupling

Fei-Long Wei et al. Sci Adv. 2024 Nov.

Abstract

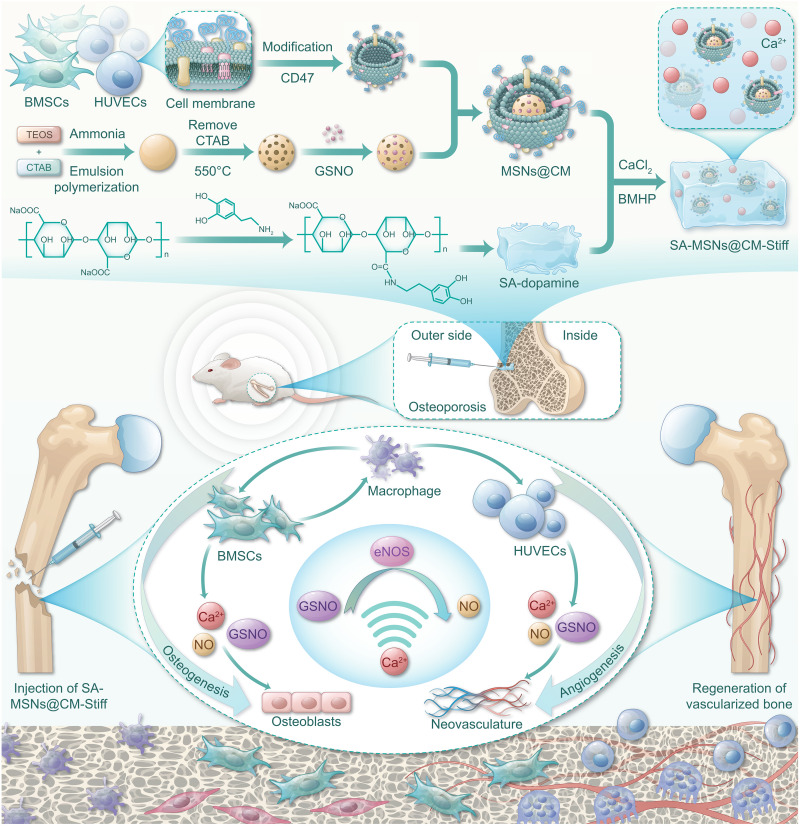
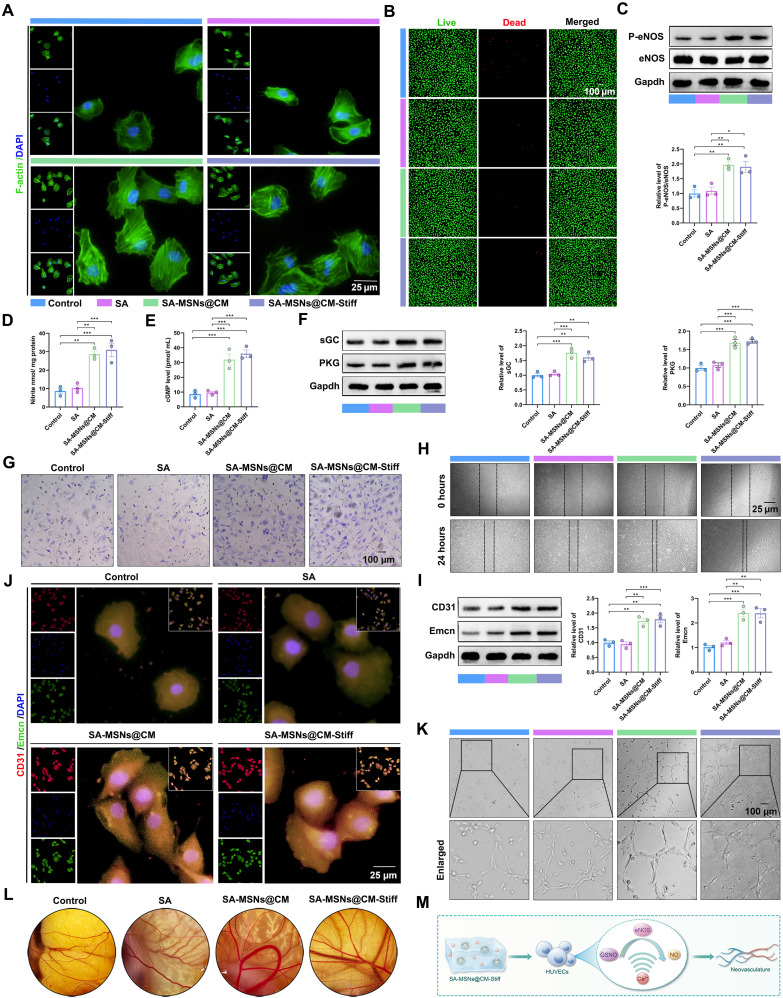
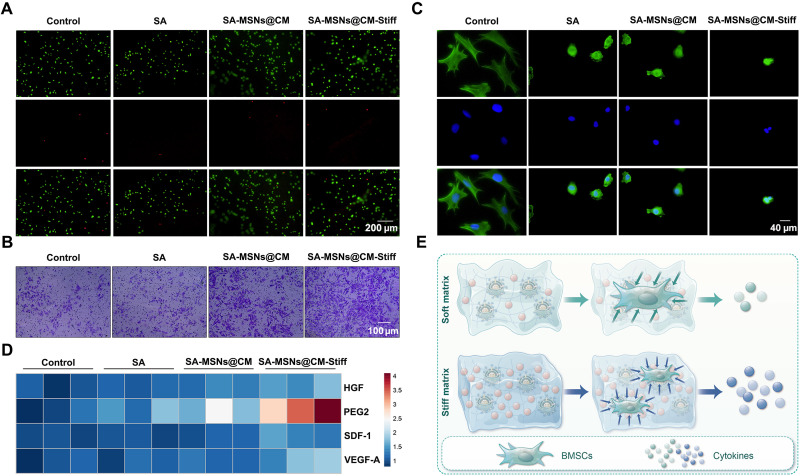
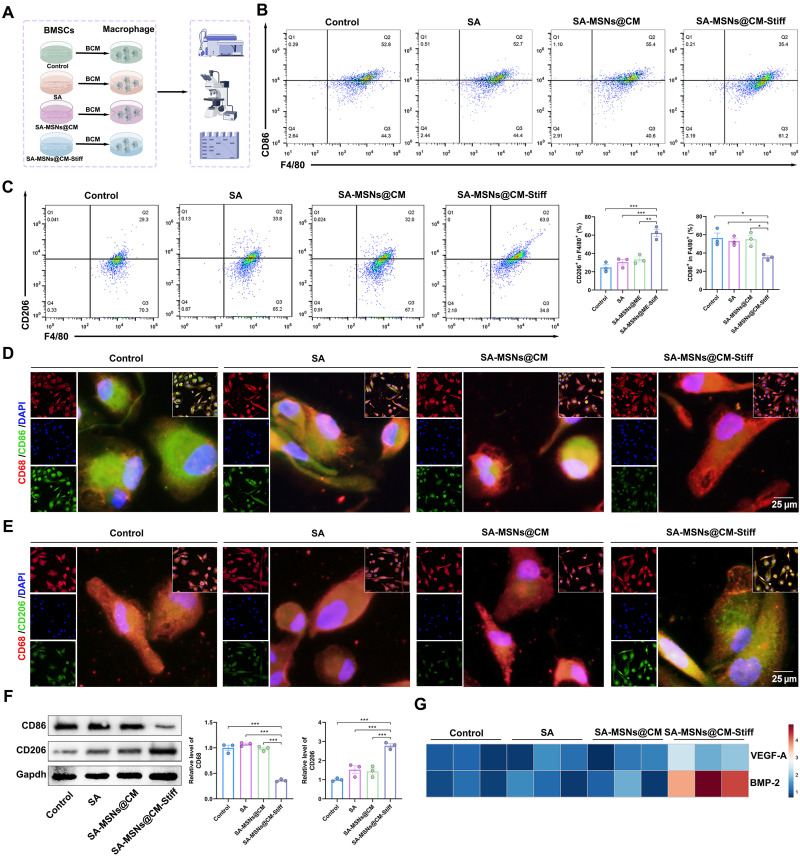
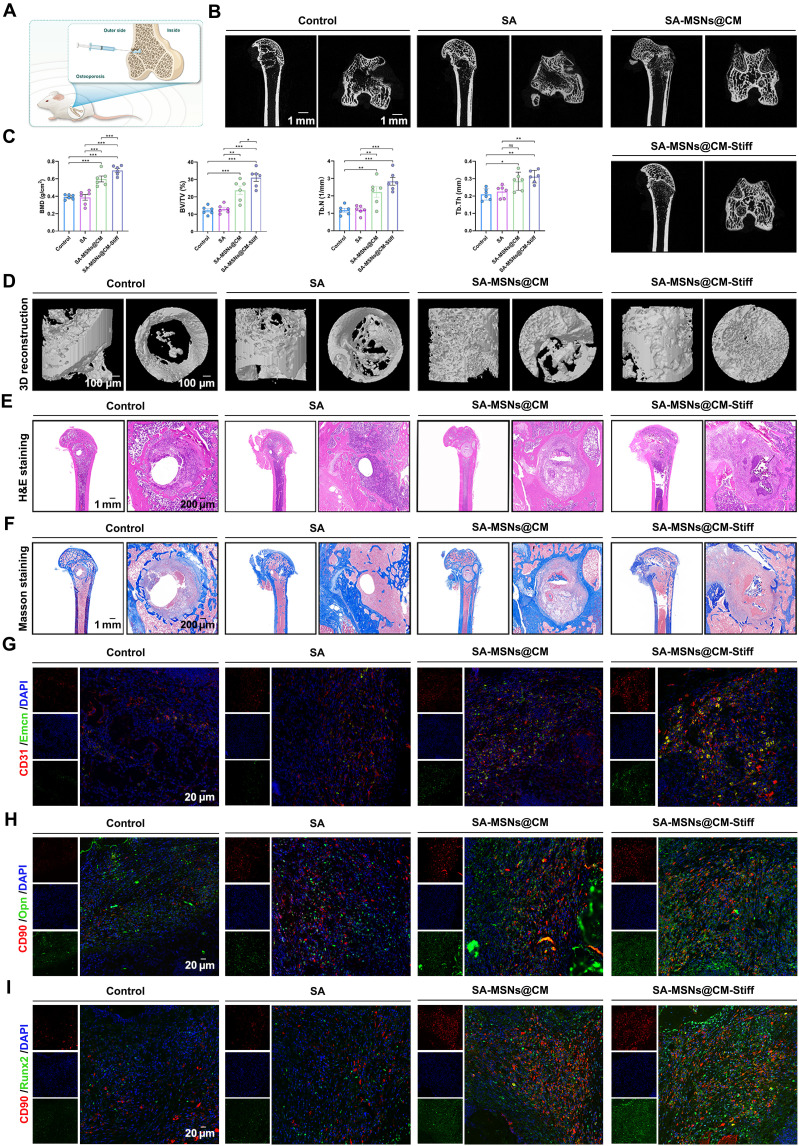
Osteoporotic bone defects refer to the disruption of bone structural integrity in patients with osteoporosis and pose a substantial challenge to orthopedic surgeons. In this study, we developed a biomimetic hydrogel to improve the osteogenic microenvironment and promote stem cell homing. This hydrogel served as a container for S-nitrosoglutathione and Ca2+, promoting the release of bioactive nitric oxide (NO) from bone marrow mesenchymal stem cells (BMSCs) and human vascular endothelial cells and activating the NO/cyclic guanosine monophosphate signaling pathway. These changes promote osteogenic and angiogenic couplings. The hydrogel simultaneously recruited BMSCs by conjugating the stem cell homing peptide SKPPGTSS. Using a rat distal femoral defect model, it was demonstrated that this hydrogel can effectively increase the formation of bone tissue and new blood vessels and has immune-regulating functions. We envision that this hydrogel may be a minimally invasive yet highly effective strategy for expediting the healing of osteoporotic bone defects.


Figures

Fig. 1.
Fig. 1.. Schematic of SA-MSNs@CM-Stiff for osteoporotic bone defects.
A biomimetic nanomaterial that promotes the coupling of osteogenesis and angiogenesis and has immunomodulatory functions. CTAB, Hexadecyltrimethylammonium bromide.
Fig. 2.
Fig. 2.. BMSCs from osteoporotic rats show properties associated with aging.
(A) Micro-CT scan and 3D reconstruction results (scale bar, 1 mm); quantitative analysis of bone density, volume, and other parameters. BV/TV, bone tissue volume/total tissue; Tb.Th, trabecular thickness; Tb.N, trabecular number. (B) H&E staining images of different groups (scale bar, 1 mm and 125 μm). (C) Masson staining images of different groups (scale bar, 1 mm and 125 μm). (D) Flow cytometry showed BMSCs from osteoporotic rats were positive for CD44 (99.8%), CD29 (99.8%), CD73 (98.9%), and CD90 (77.3%) and negative for CD34 (2.57%) and CD45 (2.5%). (E) Alizarin Red S, Toluidine blue, and Oil Red O staining were used to detect osteogenic, chondrogenic, and adipogenic differentiation, respectively (scale bar, 100 μm). (F) SA-β-gal staining detected senescent cells (scale bar, 100 μm). (G) Western blotting analysis of Nanog, Sox2, and Oct4 protein expression in BMSCs from different groups. (H) Western blotting analysis of P53, P21, and P16 protein expression in BMSCs from different groups. (I) Representative immunofluorescence staining of γ-H2AX foci formation in BMSCs from different groups (scale bar, 25 μm). DAPI, 4′,6-diamidino-2-phenylindole. (J) Representative immunofluorescence staining of CD90 and Runx2 in BMSCs from the different groups (scale bar, 25 μm). (K) Representative immunofluorescence staining of CD90 and Opn in BMSCs from different groups (scale bar, 25 μm). (L) Western blotting analysis of Runx2 and Opn protein expression in BMSCs from different groups. (M) ALP staining of BMSCs from the different groups. (N) Alizarin Red S staining of BMSCs from different groups. n = 3 for each group. Error bars denote means ± SEM; ns, no significance; *P < 0.05, **P < 0.01, and ***P < 0.001.
Fig. 3.
Fig. 3.. Characteristics of Synthesized MSNs, SA, SA-MSNs@CM, and SA-MSNs@CM-Stiff.
(A) TEM images of MSNs and MSNs@CM (scale bar, 100 nm). (B) Size distribution of MSNs and MSNs@CM. (C) Zeta potential distribution of MSNs and MSNs@CM. (D) Schematic diagram of dopamine grafting in SA. (E) Nuclei distribution of BMSCs on the hydrogel surface (scale bar, 40 μm). (F) Nuclei distribution of HUVECs on the hydrogel surface (scale bar, 40 μm). (G) XPS measurement spectra of SA and dopamine-SA. (H) Schematic diagram of changing hydrogel stiffness by changing the Ca2+ molar concentration. (I) Images and initial elastic modulus of hydrogels in different Ca2+ molar concentration groups (scale bar, 1 cm). (J) Scanning electron microscope images of different SA hydrogels (scale bar, 100 μm). (K) Pore diameter from scanning electron microscope image. (L) Images of SA-MSNs@CM-Stiff under different external mechanical forces such as bending and stretching (scale bar, 1 cm). (M) Images of shapes prepared using SA-MSNs@CM-Stiff (scale bar, 1 cm). n = 3 for each group. Error bars denote means ± SEM; *P < 0.05, **P < 0.01, and ***P < 0.001.
Fig. 4.
Fig. 4.. SA-MSNs@CM-Stiff promotes osteogenesis by activating the NO/cGMP pathway in vitro.
(A) Immunofluorescence staining of F-actin in BMSCs cultured with hydrogels for 7 days (scale bar, 25 μm). (B) Live/dead assay of BMSCs cultured with hydrogels for 3 days (scale bar, 100 μm). Live cells appear green, and dead cells appear red. (C) Western blots analysis of P-eNOS and eNOS levels in BMSCs cultured with hydrogels for 7 days. (D) NO generation in BMSCs cultured with hydrogels for 7 days indicated by nitrite levels. (E) cGMP expression in BMSCs cultured with hydrogels for 7 days. (F) Western blots analysis of sGC and PKG levels in BMSCs cultured with hydrogels for 7 days. (G) Western blots analysis of Runx2 and Opn levels in BMSCs cultured with hydrogels for 7 days. (H) Representative of immunofluorescence staining of CD90 and Runx2 in BMSCs cultured with hydrogels for 7 days (scale bar, 25 μm). (I) Representative of immunofluorescence staining of CD90 and Opn in BMSCs cultured with hydrogels for 7 days (scale bar, 25 μm). (J) The ALP staining of BMSCs cultured with hydrogels for 7 days. (K) Alizarin Red S staining of BMSCs cultured with hydrogels for 7 days. (L) Schematic diagram of SA-MSNs@CM-Stiff activating NO/cGMP pathway to promote BMSC osteogenesis. n = 3 for each group. Error bars denote means ± SEM; *P < 0.05, **P < 0.01, and ***P < 0.001.
Fig. 5.
Fig. 5.. SA-MSNs@CM-Stiff promotes migration and angiogenesis by activating the NO/cGMP pathway in vitro.
(A) Immunofluorescence staining of F-actin in HUVECs cultured with hydrogels for 3 days (scale bar, 25 μm). (B) Live/dead assay of HUVECs cultured with hydrogels for 3 days (scale bar, 100 μm). Live cells appear green, and dead cells appear red. (C) Western blotting analysis of P-eNOS and eNOS levels in HUVECs cultured with hydrogels for 3 days. (D) NO generation in HUVECs cultured with hydrogels for 3 days, as indicated by nitrite levels. (E) cGMP expression in HUVECs cultured with hydrogels for 3 days. (F) Western blotting analysis of sGC and PKG levels in HUVECs cultured with hydrogels for 3 days. (G) Transwell was used to evaluate the effect of hydrogels on the migration capacity of HUVECs. (H) Scratch experiments were used to evaluate the effect of the hydrogels on the migration ability of HUVECs. (I) Western blotting analysis of CD31 and Emcn levels in HUVECs cultured with hydrogels for 3 days. (J) Representative immunofluorescence staining of CD31 and Emcn in HUVECs cultured with hydrogels for 3 days (scale bar, 25 μm). (K) Tubule formation experiments were used to evaluate the effect of hydrogels on the angiogenesis of HUVECs (scale bar, 100 μm). (L) Chick CAM was used to evaluate the effect of hydrogels on the angiogenesis. (M) Schematic diagram of SA-MSNs@CM-Stiff activating NO/cGMP pathway to promote HUVECs angiogenesis. n = 3 for each group. Error bars denote means ± SEM; *P < 0.05, **P < 0.01, and ***P < 0.001.
Fig. 6.
Fig. 6.. SA-MSNs@CM-Stiff promotes migration and paracrine function of BMSCs under 3D conditions.
(A) Live/dead assay of BMSCs cultured with hydrogels under 3D conditions for 3 days (scale bar, 200 μm). Live cells appear green, and dead cells appear red. (B) The Transwell assay was used to evaluate the effect of hydrogels on the migration capacity of BMSCs cultured with hydrogels under 3D conditions for 3 days (scale bar, 100 μm). (C) Immunofluorescence staining of F-actin in BMSCs cultured with hydrogels under 3D conditions for 3 days (scale bar, 40 μm). (D) HGF, PEG2, SDF-1, and VEGF-A expression in BMSCs cultured with hydrogels under 3D conditions for 3 days. (E) Schematic diagram of SA-MSNs@CM-Stiff promotes migration and paracrine function of BMSCs under 3D conditions. n = 3 for each group. Error bars denote means ± SEM; *P < 0.05, **P < 0.01, and ***P < 0.001.
Fig. 7.
Fig. 7.. SA-MSNs@CM-Stiff regulates macrophage polarization by promoting BMSCs paracrine under 3D conditions.
(A) Protocol of in vitro experiments for detecting macrophage polarization regulated by BMSCs paracrine (by Figdraw). BMSCs were cultured with hydrogels for 3 days. After removal of the supernatant, cells were cultured in Dulbecco’s modified Eagle’s medium (DMEM)/F12 for 3 days, and the supernatant was collected as THP-1 conditioned medium for 2 days. BCM, BMSCs-conditioned medium. (B) Flow cytometric analysis of the expression levels of M1 macrophages (F4/80/ CD86+). (C) Flow cytometric analysis of the expression levels of M2 macrophages (F4/80/ CD206+). (D) Representative immunofluorescence staining for CD68 and CD86 in THP-1 cells (scale bar, 25 μm). (E) Representative immunofluorescence staining for CD68 and CD206 in THP-1 cells (scale bar, 25 μm). (F) Western blot analysis of CD86 and CD206 levels in macrophages. (G) VEGF-A and BMP-2 expression in macrophages. n = 3 for each group. Error bars denote means ± SEM; *P < 0.05, **P < 0.01, and ***P < 0.001.
Fig. 8.
Fig. 8.. SA-MSNs@CM-Stiff induces BMSCs recruitment and promotes osseointegration in vivo.
(A) Schematic illustration of hydrogel implantation. (B) Typical micro-CT images of the distal femur of rats with osteoporotic bone defects at 8 weeks. (C) Quantitative analysis of bone density, volume, and other parameters. BMD, bone mineral density. (D) 3D reconstruction results. (E) H&E staining images of different groups (scale bar, 1 mm and 200 μm). (F) Masson staining images of different groups (scale bar, 1 mm and 200 μm). (G) Representative immunofluorescence staining of CD31 and Emcn in the femoral condyle of an osteoporotic rat 8 weeks after hydrogel implantation (scale bar, 20 μm). (H) Representative immunofluorescence staining of CD90 and Opn in the femoral condyle of an osteoporotic rat 8 weeks after hydrogel implantation (scale bar, 20 μm). (I) Representative immunofluorescence staining of CD90 and Runx2 in the femoral condyle of an osteoporotic rat 8 weeks after hydrogel implantation (scale bar, 20 μm). n = 6 for each group. Error bars denote means ± SEM; *P < 0.05, **P < 0.01, and ***P < 0.001.

References

    1. Compston J. E., McClung M. R., Leslie W. D., Osteoporosis. Lancet 393, 364–376 (2019). - PubMed
    1. Black D. M., Rosen C. J., Clinical practice. Postmenopausal osteoporosis. N. Engl. J. Med. 374, 254–262 (2016). - PubMed
    1. Zhao Z., Li G., Ruan H., Chen K., Cai Z., Lu G., Li R., Deng L., Cai M., Cui W., Capturing magnesium ions via microfluidic hydrogel microspheres for promoting cancellous bone regeneration. ACS Nano 15, 13041–13054 (2021). - PubMed
    1. Pape H. C., Evans A., Kobbe P., Autologous bone graft: Properties and techniques. J. Orthop. Trauma 24, S36–S40 (2010). - PubMed
    1. Diba M., Camargo W. A., Brindisi M., Farbod K., Klymov A., Schmidt S., Harrington M. J., Draghi L., Boccaccini A. R., Jansen J. A., van den Beucken J. J. J. P., Leeuwenburgh S. C. G., Composite colloidal gels made of bisphosphonate-functionalized gelatin and bioactive glass particles for regeneration of osteoporotic bone defects. Adv. Funct. Mater. 27, 1703438 (2017).

MeSH terms