. 2024 Nov;10(44):eadl6464.
doi: 10.1126/sciadv.adl6464. Epub 2024 Nov 1.

Spatial multiplex analysis of lung cancer reveals that regulatory T cells attenuate KRAS-G12C inhibitor-induced immune responses

Affiliations

Spatial multiplex analysis of lung cancer reveals that regulatory T cells attenuate KRAS-G12C inhibitor-induced immune responses

Megan Cole et al. Sci Adv. 2024 Nov.

Abstract

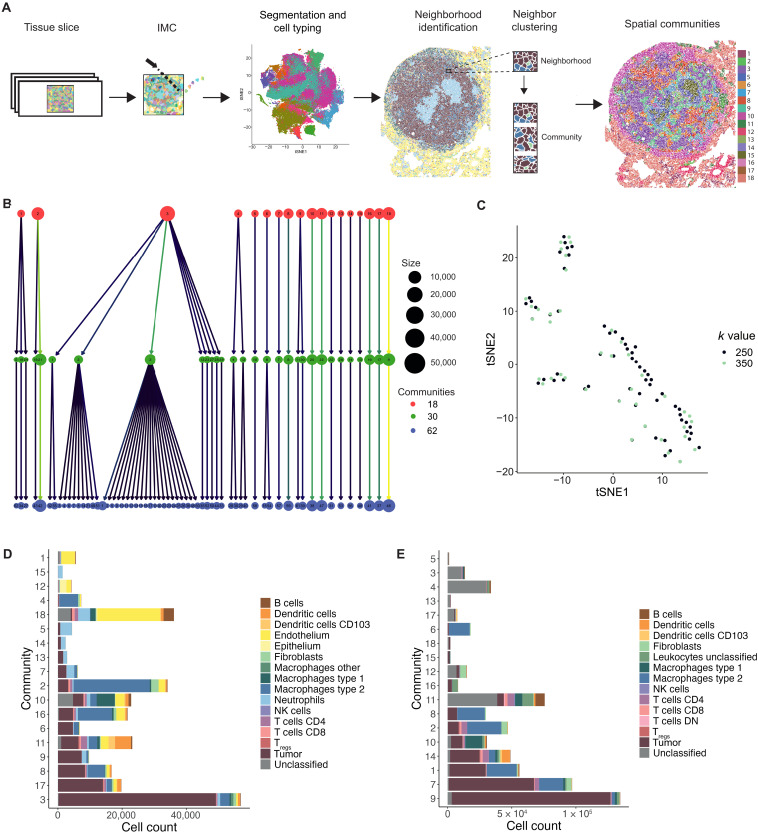
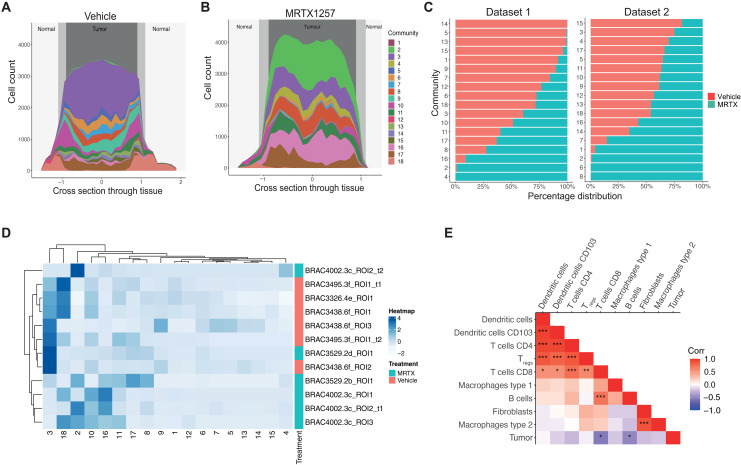
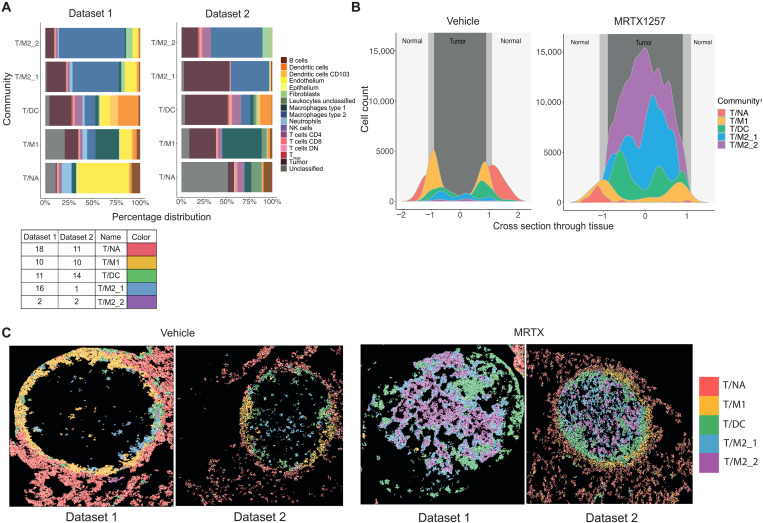
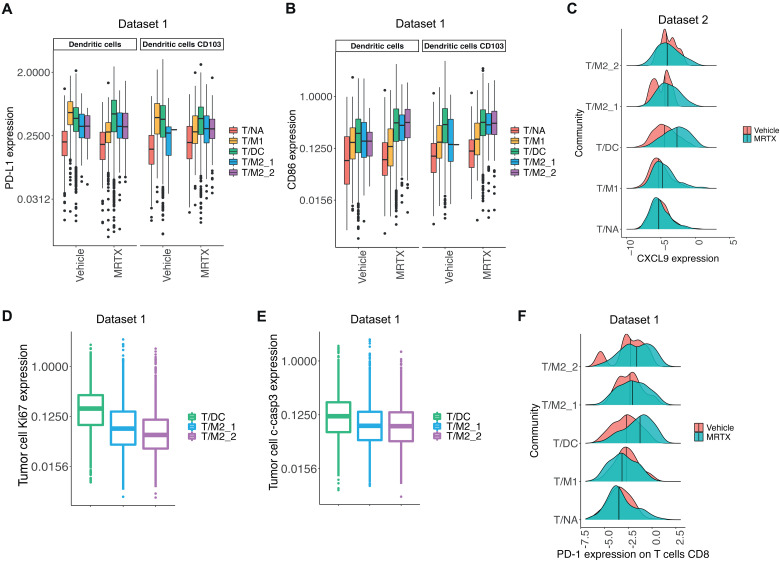
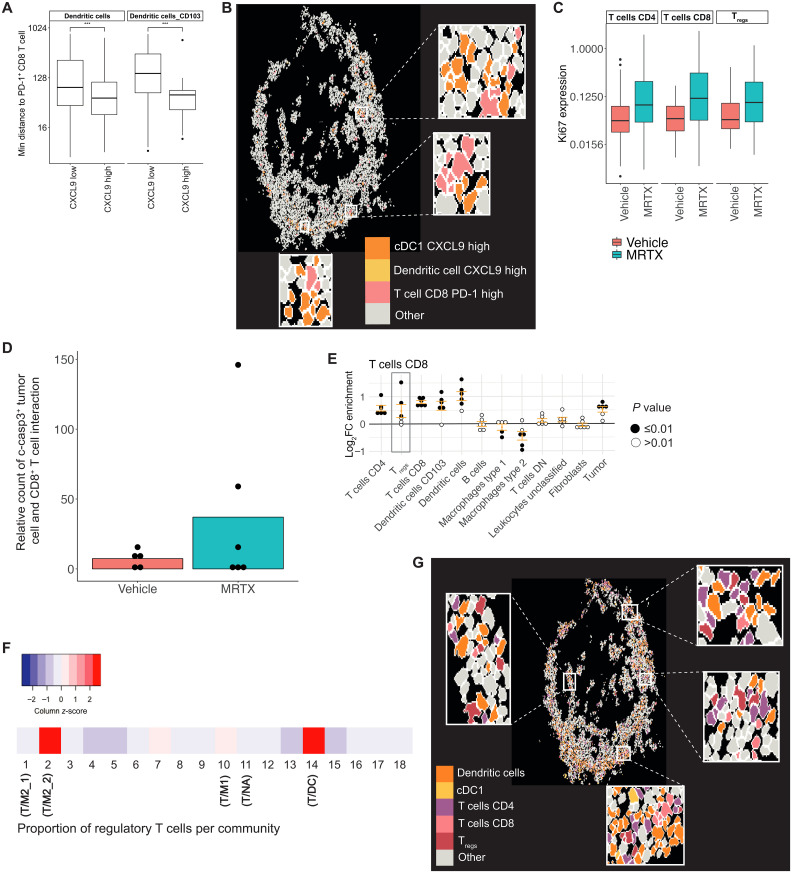
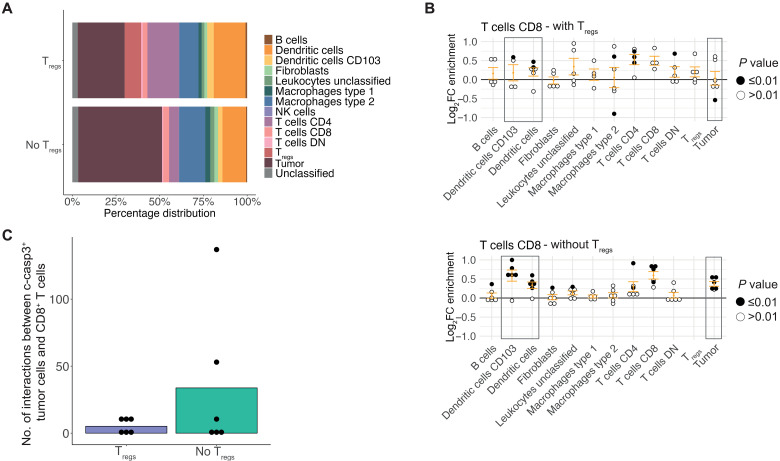
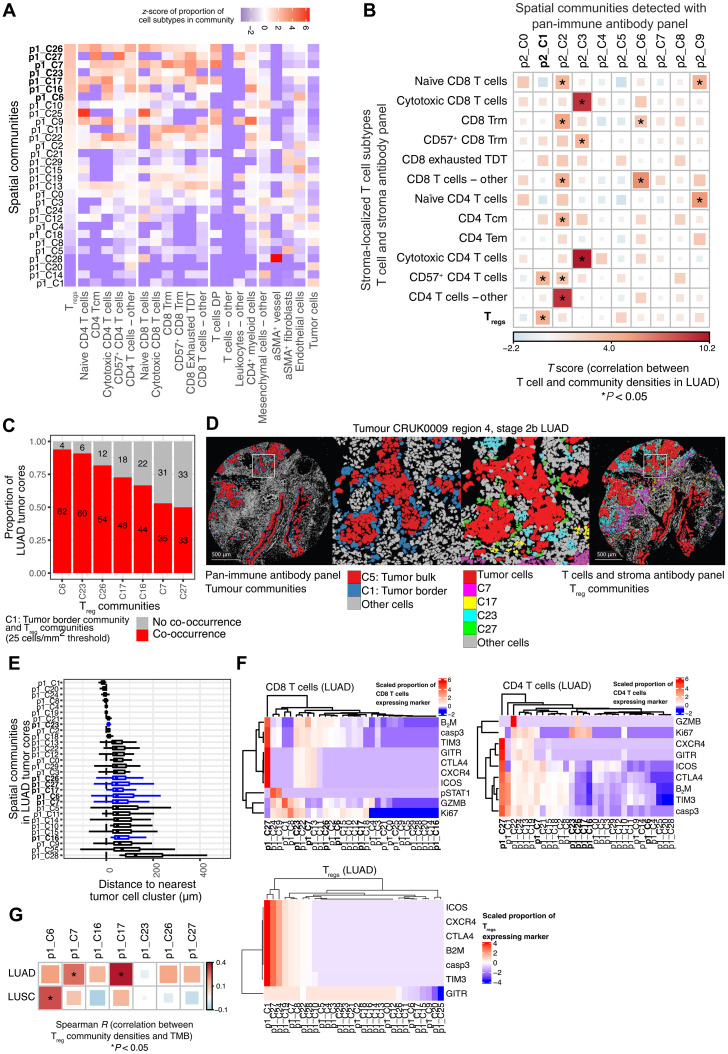
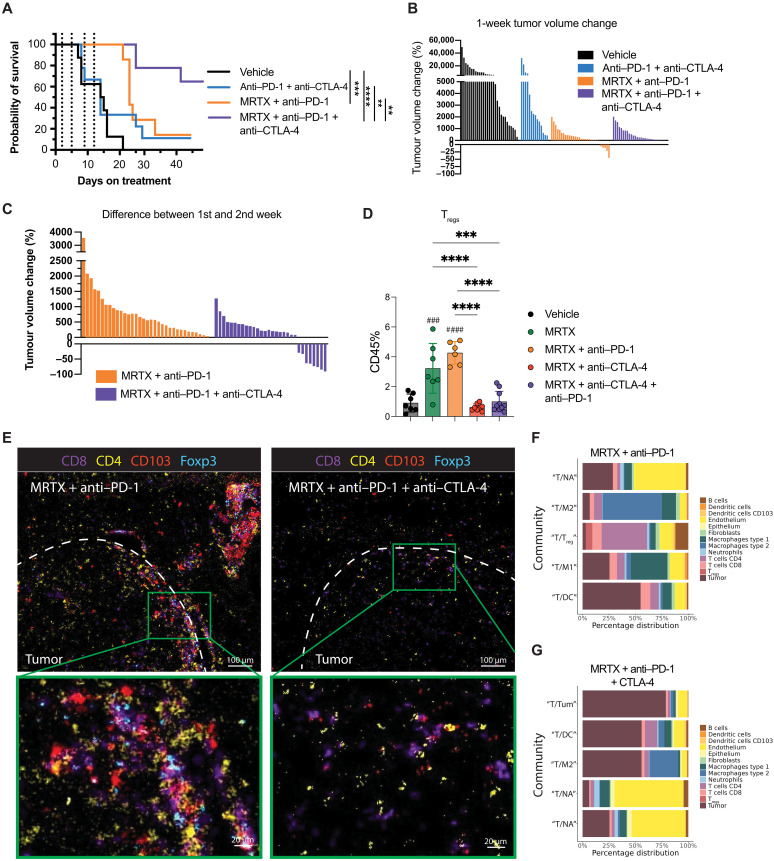
Kirsten rat sarcoma virus (KRAS)-G12C inhibition causes remodeling of the lung tumor immune microenvironment and synergistic responses to anti-PD-1 treatment, but only in T cell infiltrated tumors. To investigate mechanisms that restrain combination immunotherapy sensitivity in immune-excluded tumors, we used imaging mass cytometry to explore cellular distribution in an immune-evasive KRAS mutant lung cancer model. Cellular spatial pattern characterization revealed a community where CD4+ and CD8+ T cells and dendritic cells were gathered, suggesting localized T cell activation. KRAS-G12C inhibition led to increased PD-1 expression, proliferation, and cytotoxicity of CD8+ T cells, and CXCL9 expression by dendritic cells, indicating an effector response. However, suppressive regulatory T cells (Tregs) were also found in frequent contact with effector T cells within this community. Lung adenocarcinoma clinical samples showed similar communities. Depleting Tregs led to enhanced tumor control in combination with anti-PD-1 and KRAS-G12C inhibitor. Combining Treg depletion with KRAS inhibition shows therapeutic potential for increasing antitumoral immune responses.


Figures

Fig. 1.
Fig. 1.. Clustering of cells based on their neighbors yield spatial communities.
(A) Workflow of generating spatial communities using the data generated from lung tissue slices. (B) Cluster tree of 62 communities generated using Rphenograph with a k-input value of 250, agglomerated to 30 communities and subsequently agglomerated again to 18 communities, where each circle represents a community and lines indicate communities that were merged during agglomeration. (C) tSNE plot of 62 communities generated with a k-input value of 250 and 47 communities generated with a k-input value of 350 into Rphenograph using dataset 1, where tSNE analysis was run on the basis of the proportion of each cell type contributing to each community. (D and E) Eighteen spatial communities generated from clustering based on neighbor proportions of each cell type for (D) dataset 1 and (E) dataset 2, with the size of each bar representing cell count of that community and colors indicating the contribution of each cell type. Bars are ordered by decreasing tumor cell count. NK, natural killer; DN, double negative.
Fig. 2.
Fig. 2.. Spatial communities reflect refined tissue architecture and have functional relevance.
(A and B) Cell count per community relative to cross section through the tissue, where 0 represents the center point of the tumor in (A) vehicle and (B) MRTX1257 treatment settings. (C) Percentage distribution of each community across vehicle (left) and MRTX1257 (right) treatment groups. Bars are ordered by increasing percentage distribution in vehicle setting. (D) Hierarchical clustering of community proportion per ROI for dataset 1, with the use of dendrograms to show relationships between similar ROIs, similar communities, and community distribution across the treatment groups. (E) Pearson correlation calculation on the proportion of each cell type pair within each community. *P < 0.05, **P < 0.01, and ***P < 0.001. Cell types were clustered on the basis of correlation value. MRTX, MRTX1257.
Fig. 3.
Fig. 3.. Spatial communities that are abundant in CD8+ T cells are diverse in composition and spatial distribution.
(A) Percentage distribution of cell types contributing to the top five communities with the highest CD8+ T cell count from dataset 1 (left) and dataset 2 (right), ordered in pairs based on proportions of shared cell types and labeled with the names T/NA, T/M1, T/DC, T/M2_1, and T/M2_2. (B) Cell count of each of the top five communities relative to the cross section through the tissue, where 0 represents the center point of the tumor. (C) Visualization of cell outlines from cells assigned to T/NA, T/M1, T/DC, T/M2_1, and T/M2_2 communities, with each outline filled with a color, associating it to one of the five communities, in vehicle- and MRTX1257-treated tumors for datasets 1 and 2.
Fig. 4.
Fig. 4.. T cell–rich communities respond differently to KRAS-G12C inhibition.
(A and B) Mean expression of (A) PD-L1 and (B) CD86 on DCs and CD103+ DCs in T/NA, T/M1, T/DC, T/M2_1, and T/M2_2 communities following vehicle and MRTX1257 treatments for dataset 1 only. Values were log2 scaled. (C) Mean expression of CXCL9 on DCs, CD103+ DCs, macrophages type 1, and macrophages type 2 combined for T/NA, T/M1, T/DC, T/M2_1, and T/M2_2 communities in vehicle- and MRTX1257-treated groups in dataset 2. Values were log2 scaled. Center line shows median expression for each treatment group. (D and E) Mean expression of (D) Ki67 and (E) c-casp3 on tumor cells in T/DC, T/M2_1, and T/M2_2 communities following treatment with MRTX1257 for dataset 1. Values were log2 scaled. (F) Mean expression of PD-1 on CD8+ T cells in communities T/NA, T/M1, T/DC, T/M2_1, and T/M2_2 in vehicle- and MRTX1257-treated groups for dataset 1. Values were log2 scaled. Center line shows median expression for each treatment group. MRTX, MRTX1257.
Fig. 5.
Fig. 5.. Positive and negative regulations of antitumoral immune responses come together in the T/DC community.
(A) Minimum distance of DCs and CD103+ DCs that have “low” or “high” CXCL9 expression (threshold = 0.5) to PD-1+ CD8+ T cells within 800 pixels in T/DC community from dataset 2. Distance values were log2 scaled. ***P < 0.001. (B) Visualization of cell outlines for cells assigned to T/DC community in MRTX1257-treated tissues from dataset 2, with CXCL9-high DCs, CD103+ DCs, and PD-1+ CD8+ T cells colored in to show spatial proximity of these cell phenotypes. Some regions were expanded for easier visualization. (C) Mean expression of Ki67 on CD4+ and CD8+ T cells and Tregs within the T/DC community for vehicle and MRTX1257 treatment groups from dataset 2. Values were log2 scaled. (D) The number of times a c-casp3+ tumor cell is found in the 15-pixel neighborhood of a CD8+ T cell within the T/DC community, compared across vehicle and MRTX1257 treatment groups for dataset 2, averaged per ROI. Count is relative to the proportion of tumor cells that were c-casp3+ in vehicle versus MRTX1257 treatment groups. Each dot represents the value of one ROI. (E) Log2 fold changes (log2FC) in enrichment from neighbouRhood analysis for CD8+ T cells in the T/DC community following treatment with MRTX1257. Filled circles represent images from which enrichment was statistically significant compared to randomized spatial arrangements following treatment with MRTX1257 for dataset 2. (F) Scaled proportion of Tregs contributing to each of the 18 original communities for dataset 2. (G) Visualization of cell outlines for cells assigned to the T/DC community in MRTX1257-treated tissues for dataset 2. DCs, CD103+ DCs, CD4+ and CD8+ T cells, and Tregs were filled in to illustrate spatial proximity of these cell types. Some regions were expanded for easier visualization. MRTX, MRTX1257.
Fig. 6.
Fig. 6.. Tregs dampen local antitumoral immune responses.
(A) Percentage distribution of cell types contributing to neighborhoods with Tregs (“Tregs”) and neighborhoods without Tregs (“No Tregs”) within the T/DC community following treatment with MRTX1257. (B) Log2 fold changes in enrichment from neighbouRhood analysis for CD8+ T cells in Tregs (top) and no Tregs (bottom) neighborhoods within the T/DC community following treatment with MRTX1257. Filled circles represent images from which enrichment value was statistically significant compared to randomization of the spatial arrangements within the T/DC community following treatment with MRTX1257 for dataset 2. (C) Number of times a c-casp3+ tumor cell is found in the 15-pixel neighborhood of a CD8+ T cell within the T/DC community, compared across Treg and no Treg neighborhoods in dataset 2, averaged per ROI. Count is relative to the proportion of tumor cells that were c-casp3+ in Treg versus no Treg groups.
Fig. 7.
Fig. 7.. Treg spatial communities are also found in human NSCLC.
(A) Thirty spatial communities detected in 135 tumor cores from 69 patients with NSCLC. The z-score of the proportion of cell subtypes, detected using the T cells and stroma antibody panel (20), in each spatial community is shown. Communities p1_C6, p1_C7, p1_C16, p1_C17, p1_C23, p1_C26, and p1_C27 (bold lettering) contain the highest proportions of Tregs. (B) Correlation between the density of stroma-localized T cell subtypes detected using the T cells and stroma antibody panel and the cell density of 10 spatial communities detected using the pan-immune antibody panel, in 66 LUAD tumor cores from 39 patients. Analysis of variance (ANOVA) was conducted using the linear mixed-effects model with patient as a random covariate; P values are unadjusted. *P < 0.05. (C) Proportion of LUAD tumor cores that contain at least 25 cells/mm2 of Treg communities (p1_C6, p1_C7, p1_C16, p1_C17, p1_C23, and p1_C27) and p2_C1: tumor border communities. Sixty-six LUAD tumor cores from 39 patients. (D) Pseudo-colored images highlighting cells in the p2_C1: tumor border communities corresponding to cells in Treg communities in serial tumor cores. (E) Per-image median distance between cells of a community and their nearest tumor cell cluster. Tumor cell clustering method described in (71). Seventy LUAD tumor cores from 40 patients. (F) Heatmap displaying the scaled proportion of CD8+ T cells, CD4+ T cells, and Tregs expressing phenotypes of interest. Color scales indicate proportion of cells considered positive, defined by a threshold. β2-Microglobulin (β2M) is expected to be expressed on all nucleated cells; therefore, this threshold indicates high or low expression (71). Seventy LUAD tumor cores from 40 patients. (G) Spearman correlation between the density of Treg communities and total harmonized tumor mutational burden. Sixty-nine LUAD cores from 40 patients and 49 LUSC cores from 21 patients. Tcm, central memory T cells; Trm, Tissue resident memory T cells; TDT, Terminally differentiated T cells; DP, double positive; aSMA, alpha smooth muscle actin.
Fig. 8.
Fig. 8.. Depletion of Tregs rescues antitumoral immune responses.
(A) Kaplan-Meier analysis of the survival of mice using the 3LL orthotopic lung carcinoma model under vehicle (n = 8 mice), anti–PD-1 + anti–CTLA-4 (n = 9 mice), MRTX849 + anti–PD-1 (n = 7 mice), and MRTX849 + anti–PD-1 + anti–CTLA-4 (n = 9 mice) treatment groups. **P < 0.01, ***P < 0.001, ****P < 0.0001. (B) Tumor volume changes after 1 week of treatment as measured by microcomputed tomography (μCT) scanning. Multiple tumors per mouse are shown for vehicle (n = 8 mice), anti–PD-1 + anti–CTLA-4 (n = 9 mice), MRTX849 + anti–PD-1 (n = 7 mice), and MRTX849 + anti–PD-1 + anti–CTLA-4 (n = 9 mice). (C) Tumor volume changes after the second week of treatment as measured by μCT scanning for MRTX849 + anti–PD-1 (n = 6 mice) and MRTX849 + anti–PD-1 + anti–CTLA-4 (n = 8 mice) treatment groups. (D) Percentage of all CD45+ cells identified as Tregs (gated as CD45+ CD3+ CD4+ Foxp3+) measured by flow cytometry in the tumor. Data are mean values ± SD. Each dot represents a mouse. Statistics were calculated using one-way ANOVA. ***P < 0.001, ****P < 0.0001, ###P < 0.001, ####P < 0.0001. (E) IMC images of a representative tumor area from lungs treated with either MRTX849 + anti–PD-1 or MRTX849 + anti–PD-1 + anti–CTLA-4. Tumor edge is indicated with a dashed line. Underneath a magnification from a CD8 T cell–rich area is shown. For visualization purposes, the images were processed in Fiji with a median and Gaussian filter (radius, 0.5). (F and G) Top five communities from (F) MRTX849 + anti–PD-1–treated tumors (n = 3) and (G) MRTX849 + anti–PD-1 + anti–CTLA-4–treated tumors (n = 4). Similarity to communities found in the vehicle- and MRTX849-treated tumors from datasets 1 and 2, based on visual comparison, is indicated with quotation marks around the label (e.g. “T/DC”). Asterisks indicate statistics between samples, and hashtags indicate statistics compared to vehicle. MRTX, MRTX849.

References

    1. Borghaei H., Paz-Ares L., Horn L., Spigel D. R., Steins M., Ready N. E., Chow L. Q., Vokes E. E., Felip E., Holgado E., Barlesi F., Kohlhäufl M., Arrieta O., Burgio M. A., Fayette J., Lena H., Poddubskaya E., Gerber D. E., Gettinger S. N., Rudin C. M., Rizvi N., Crinò L., Blumenschein G. R. Jr., Antonia S. J., Dorange C., Harbison C. T., Graf Finckenstein F., Brahmer J. R., Nivolumab versus docetaxel in advanced nonsquamous non-small-cell lung cancer. N. Engl. J. Med. 373, 1627–1639 (2015). - PMC - PubMed
    1. Gettinger S. N., Wurtz A., Goldberg S. B., Rimm D., Schalper K., Kaech S., Kavathas P., Chiang A., Lilenbaum R., Zelterman D., Politi K., Herbst R. S., Clinical features and management of acquired resistance to PD-1 axis inhibitors in 26 patients with advanced non-small cell lung cancer. J. Thorac. Oncol. 13, 831–839 (2018). - PMC - PubMed
    1. de Langen A. J., Johnson M. L., Mazieres J., Dingemans A. C., Mountzios G., Pless M., Wolf J., Schuler M., Lena H., Skoulidis F., Yoneshima Y., Kim S. W., Linardou H., Novello S., van der Wekken A. J., Chen Y., Peters S., Felip E., Solomon B. J., Ramalingam S. S., Dooms C., Lindsay C. R., Ferreira C. G., Blais N., Obiozor C. C., Wang Y., Mehta B., Varrieur T., Ngarmchamnanrith G., Stollenwerk B., Waterhouse D., Paz-Ares L., CodeBrea K. I., Sotorasib versus docetaxel for previously treated non-small-cell lung cancer with KRAS(G12C) mutation: A randomised, open-label, phase 3 trial. Lancet 401, 733–746 (2023). - PubMed
    1. Skoulidis F., Li B. T., Dy G. K., Price T. J., Falchook G. S., Wolf J., Italiano A., Schuler M., Borghaei H., Barlesi F., Kato T., Curioni-Fontecedro A., Sacher A., Spira A., Ramalingam S. S., Takahashi T., Besse B., Anderson A., Ang A., Tran Q., Mather O., Henary H., Ngarmchamnanrith G., Friberg G., Velcheti V., Govindan R., Sotorasib for lung cancers with KRAS p.G12C mutation. N. Engl. J. Med. 384, 2371–2381 (2021). - PMC - PubMed
    1. Molina-Arcas M., Samani A., Downward J., Drugging the undruggable: Advances on RAS targeting in cancer. Genes 12, 899 (2021). - PMC - PubMed

Publication types

MeSH terms

Substances