. 2024 Nov;10(44):eadp3481.
doi: 10.1126/sciadv.adp3481. Epub 2024 Nov 1.

High mitochondrial DNA levels accelerate lung adenocarcinoma progression

Affiliations

High mitochondrial DNA levels accelerate lung adenocarcinoma progression

Mara Mennuni et al. Sci Adv. 2024 Nov.

Abstract

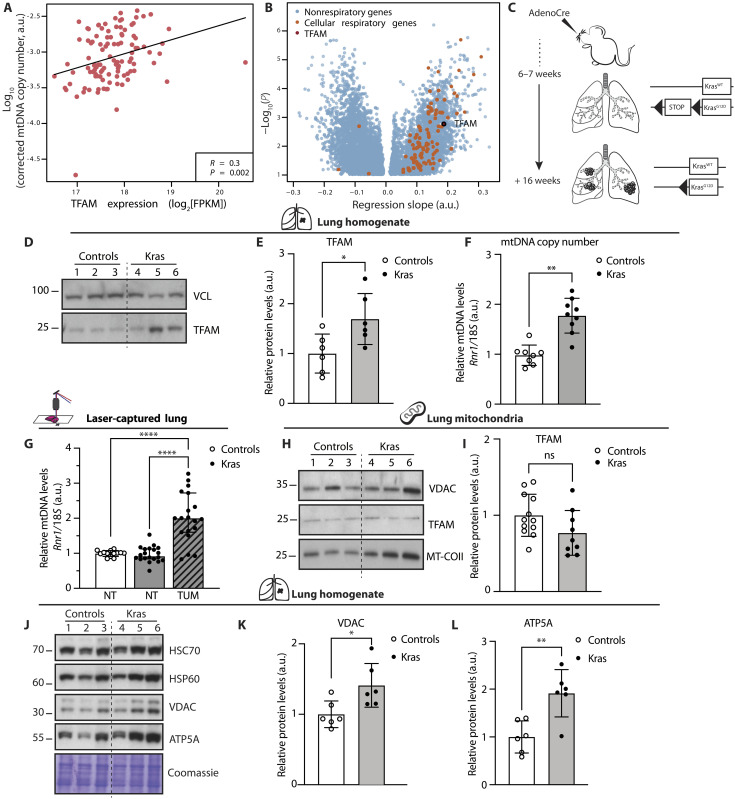
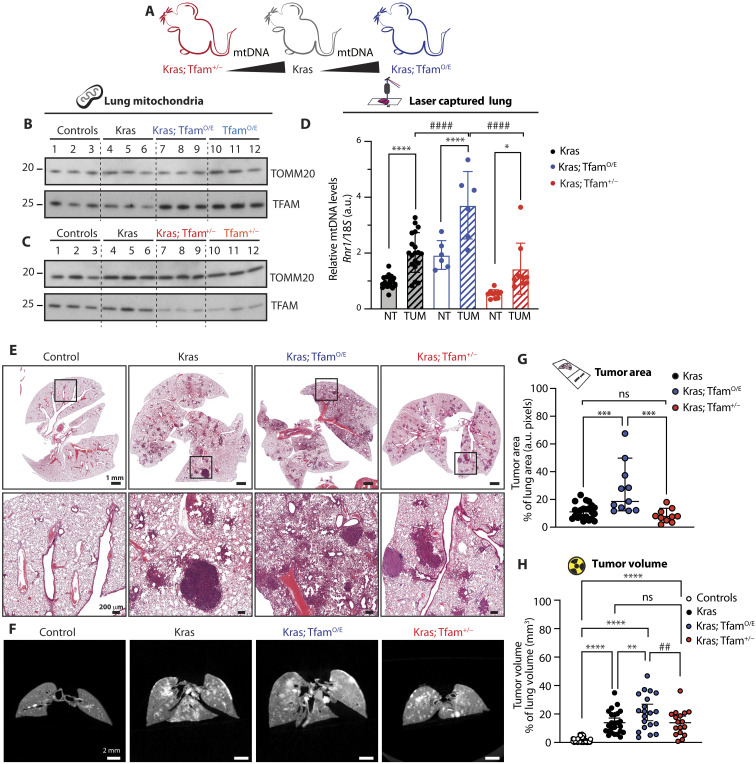
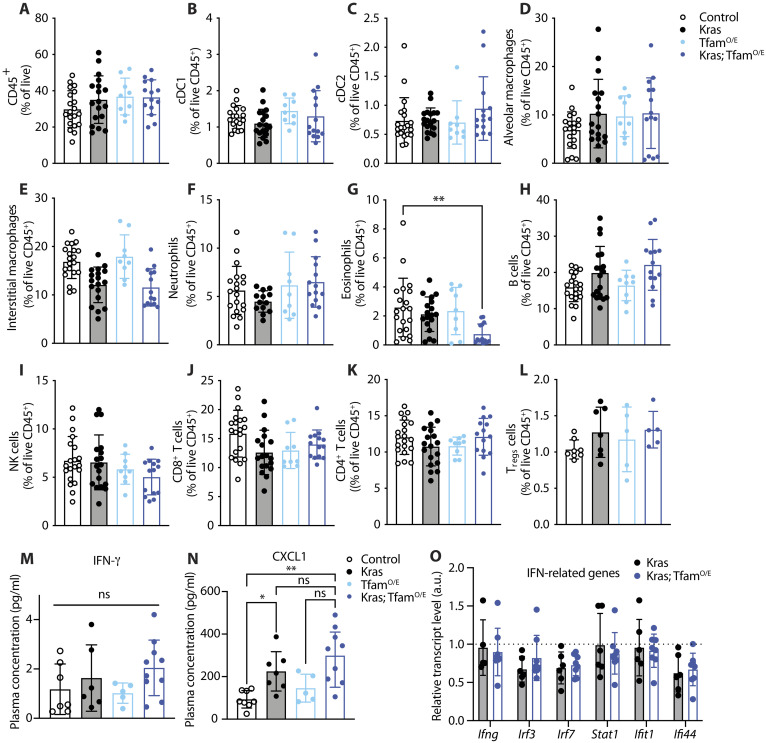
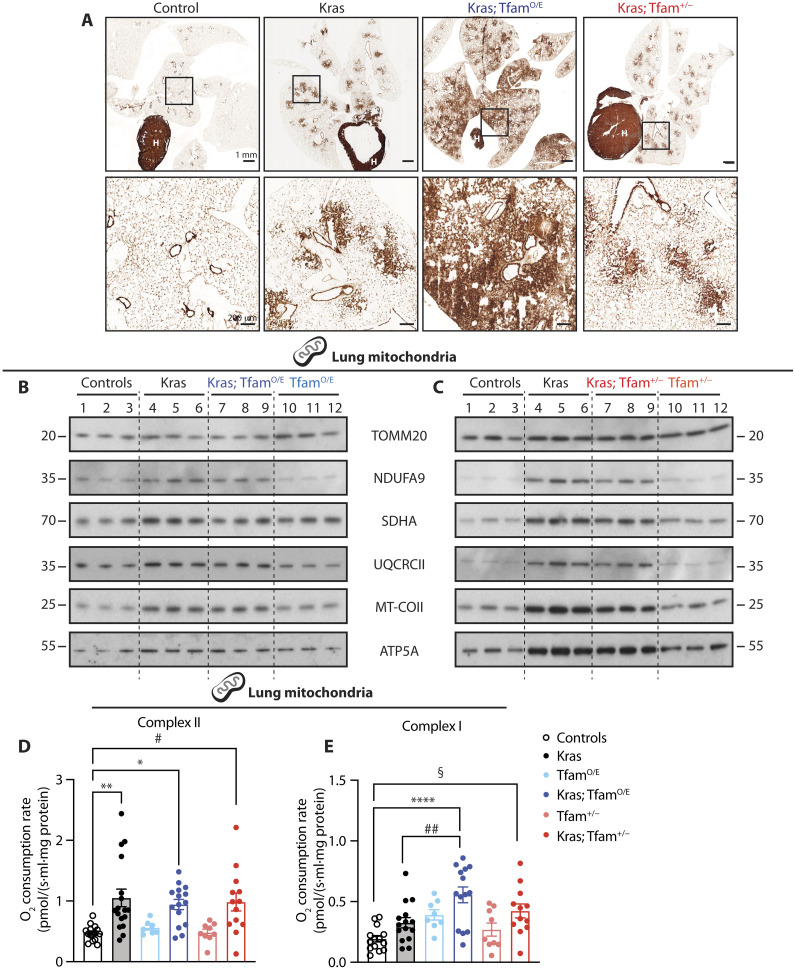
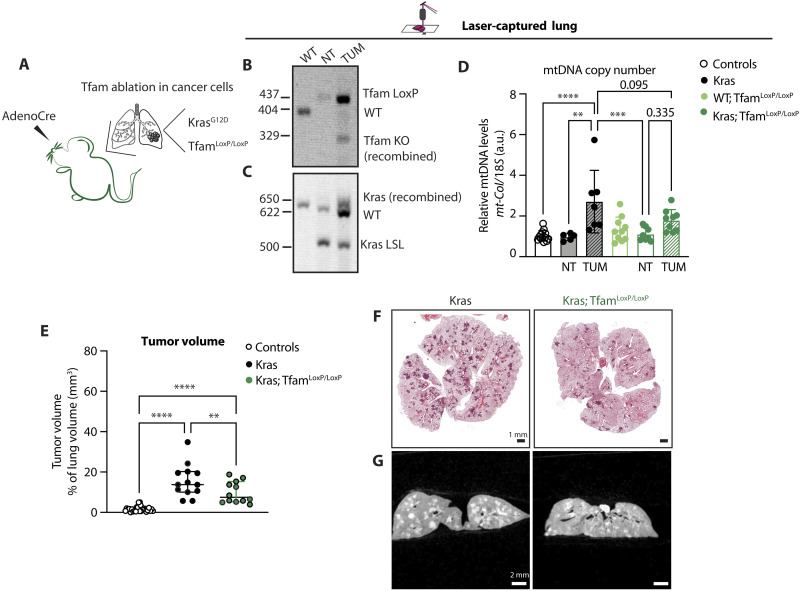
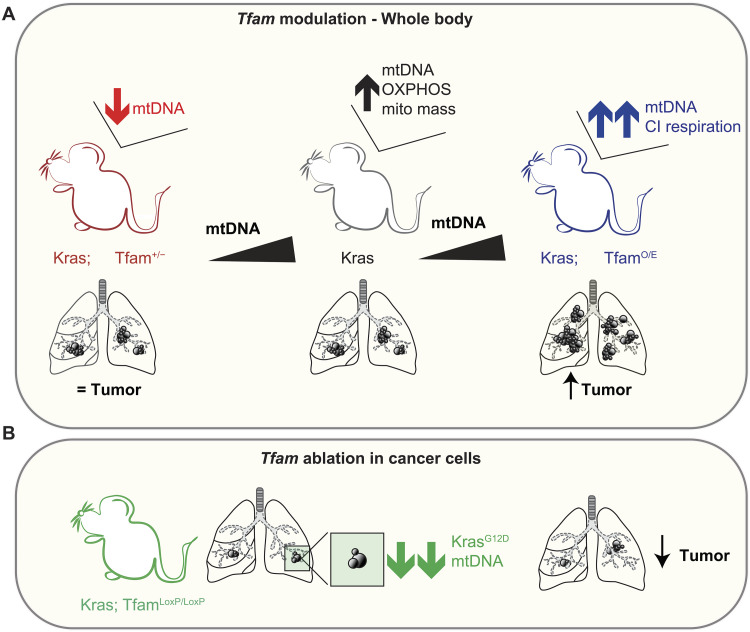
Lung adenocarcinoma is a common aggressive cancer and a leading cause of mortality worldwide. Here, we report an important in vivo role for mitochondrial DNA (mtDNA) copy number during lung adenocarcinoma progression in the mouse. We found that lung tumors induced by KRASG12D expression have increased mtDNA levels and enhanced mitochondrial respiration. To experimentally assess a possible causative role in tumor progression, we induced lung cancer in transgenic mice with a general increase in mtDNA copy number and found that they developed a larger tumor burden, whereas mtDNA depletion in tumor cells reduced tumor growth. Immune cell populations in the lung and cytokine levels in plasma were not affected by increased mtDNA levels. Analyses of large cancer databases indicate that mtDNA copy number is also important in human lung cancer. Our study thus reports experimental evidence for a tumor-intrinsic causative role for mtDNA in lung cancer progression, which could be exploited for development of future cancer therapies.


Figures

Fig. 1.
Fig. 1.. The levels of mtDNA are increased in human and mouse LUAD.
(A) Correlation coefficient and P value for the regression slope between TFAM expression and mtDNA levels in LUAD (14). (B) Linear regression models fitted with gene expression as explanatory and mtDNA levels as response variables. FPKM, fragments per kilobase per million reads. (C) Schematic timeline from tumor induction to collection of the KrasG12D model. (D) Western blot analyses showing the steady-state levels of TFAM in lung homogenates from controls and Kras mice; vinculin (VCL) is used as loading control. (E) Densitometric quantification of TFAM protein levels from Western blots. N = 6; *P = 0.0250. (F) Relative mtDNA levels measured in lung homogenate from controls and Kras mice. N > 8; **P = 0.0058. (G) mtDNA levels measured in laser-captured tumor portions (TUM) and normal lung (NT). Controls: N = 14, Kras: N = 20 ****P < 0.0001. (H) Western blot analyses of TFAM and cytochrome c oxidase subunit 2 (MT-COII) levels in lung mitochondria; voltage-dependent anion channel (VDAC) is used as loading reference. (I) Quantification of TFAM protein levels from Western blots. Controls: N = 12; Kras: N = 9; ns, not significant. (J) Western blot analyses of the steady-state levels of heat shock protein 60 (HSP60), VDAC, and adenosine 5′-triphosphate (ATP) synthase F1 subunit alpha (ATP5A) in lungs; heat shock cognate 70 (HSC70) and Coomassie are used as loading references. (K and L) Quantifications of VDAC and ATP5A levels from Western blots normalized against the loading control. N = 6; *P = 0.0198 and **P = 0.0038. Scatter plots show individual data points and the mean values ± SD. Two-tailed t test was used for statistical analysis of (E), (F), (I), (K), and (L), and one-way analysis of variance (ANOVA) was used for (G). a.u., arbitrary unit.
Fig. 2.
Fig. 2.. Increasing mtDNA levels before tumor induction increases tumor burden in mice.
(A) Schematic representation of the mouse models used to generate Kras-driven LUADs with different mtDNA levels. (B and C) Representative Western blot analyses of TFAM steady-state levels in mitochondria isolated from lung of controls, Kras, TfamO/E, Kras; TfamO/E (B), Tfam+/−, and Kras; Tfam+/− (C). Mitochondrial import receptor subunit TOM20 (TOMM20) is used as a loading control. (D) Relative mtDNA levels measured in laser captured tumor portions (TUM) and normal surrounding lung tissue (NT) isolated from the aforementioned groups. Scatter plots show individual data points and the mean values ± SD. One-way ANOVA was used for the statistical analysis; Kras: N = 20, Kras; TfamO/E: N = 6, and Kras; Tfam+/−: N = 10. *P = 0.0185, ****P < 0.0001, and ####P < 0.0001. (E and F) Representative hematoxylin and eosin (H&E) staining of lung tissue sections (E) and μCT images (F) of the lungs from controls, Kras, Kras; TfamO/E, and Kras; Tfam+/− mice. Scale bars, H&E: 1 mm (top) and 200 μm (bottom) and μCT: 2 mm. (G) Tumor area over total lung area quantified from H&E sections. Scatter plots show individual data points and the median + 95% confidence interval (CI) for each group. Statistical significance was calculated with one-way ANOVA test. Kras: N = 23; Kras; TfamO/E: N = 11, and Kras; Tfam+/−: N = 10; ***P = 0.0004. (H) Quantification of tumor volume and airways from μCT 3D images expressed as percentage of total lung volume. Scatter plots show individual data points and the median + 95% CI. Statistical significance was calculated with one-way ANOVA test. Controls: N > 30; Kras: N = 25; Kras; TfamO/E: N = 20; and Kras; Tfam+/−: N = 17. ****P < 0.0001, **P = 0.032, and ##P = 0.0092.
Fig. 3.
Fig. 3.. The increase in mtDNA levels does not influence the immune cell populations in the lung and cytokine levels in plasma.
(A to L) Relative quantification of immune cells populations analyzed in lungs from control, Kras, TfamO/E, and Kras; TfamO/E mice. (A) Total immune cells (CD45+). (B and C) Dendritic cells type 1 and 2 (cDC1 and cDC2). (D and E) Alveolar and interstitial macrophages. (F) Neutrophils. (G) Eosinophils. (H) B cells. (I) Natural killer (NK) cells. (J and K) CD8+ and CD4+ cells. (L) T regulatory cells (Tregs). **P = 0.005. (M and N) Scatter plots of the levels of selected cytokines and chemokines: interferon-γ (IFN-γ) and growth-regulated alpha protein (CXCL1). *P = 0.0388, **P = 0.0017. (O) Relative transcript levels measured in lung homogenates from Kras and Kras; TfamO/E mice showing the expression levels of IFN-related genes relative to controls (dotted line); n ≥ 4. Scatter plots show individual data points and the mean values ± SD. One-way ANOVA was used for the statistical analysis.
Fig. 4.
Fig. 4.. High mtDNA levels boost complex I–driven oxygen consumption rates.
(A) COX enzyme activity performed on frozen lung tissue sections from controls, Kras, Kras; TfamO/E, and Kras; Tfam+/− mice. Scale bars, 1 mm (top) and 200 μm (bottom). H, heart. (B and C) Western blot analyses of the steady-state level of OXPHOS proteins in mitochondria isolated from lung tissue of controls, Kras, TfamO/E, Kras; TfamO/E (B), Tfam+/−, and Kras; Tfam+/− (C). Complex I: NADH dehydrogenase 1 alpha subunit 9 (NDUFA9), complex II: succinate dehydrogenase [ubiquinone] flavoprotein subunit A (SDHA), complex III: cytochrome b-c1 complex subunit 2 (UQCRCII), complex IV: cytochrome c oxidase subunit 2 (MT-COII), and complex V: ATP synthase F1 subunit alpha (ATP5A). TOMM20 is used as loading reference. (D and E) Oxygen consumption rates through complex II (D) and complex I (E) measured by high-resolution respirometry in mitochondria isolated from lungs of controls, Kras, TfamO/E, Kras; TfamO/E, Tfam+/−, and Kras; Tfam+/− mice. Scatter plots show individual data points ± SEM. Statistical significance was calculated with one-way ANOVA test. *P = 0.0229, **P = 0.0016, #P = 0.0148; §P = 0.0162, ##P = 0.0091, and ****P < 0.0001. Controls: N = 14; Kras: N = 15; TfamO/E: N = 8; Kras; TfamO/E: N = 14; Tfam+/−: N = 9; and Kras; Tfam+/−: N = 12.
Fig. 5.
Fig. 5.. Depletion of mtDNA in tumor cells impairs tumor formation.
(A) Schematics of the Kras; TfamLoxP/LoxP mouse model and expected outcome upon Cre recombination. (B and C) Recombination status of Tfam (B) and Kras (C) gene upon adenoCre induction in DNA extracted from laser-captured lung portions of controls [wild type (WT)] and Kras; TfamLoxP/LoxP mice. (D) Relative mtDNA levels normalized to nuclear DNA measured in laser-captured lungs portions from KRAS-induced tumor tissue (TUM) and normal surrounding tissue (NT) in controls (WT), Kras, TfamLoxP/LoxP (WT; TfamLoxP/LoxP), and Kras; TfamLoxP/LoxP mice. Scatter plots show individual data points and the mean ± SD. Statistical significance is calculated with one-way ANOVA test. **P = 0.0010, ***P = 0.0005, and ****P < 0.0001. Controls: N = 12; Kras: N = 6; WT; TfamLoxP/LoxP: N = 6; Kras; TfamLoxP/LoxP: N = 8. (E) Quantification of tumor volume and airways in controls, Kras, and Kras; TfamLoxP/LoxP groups expressed as percentage of tumor over total lung tissue volume. Scatter plots show individual data points and the median + 95% CI for each group. Statistical significance is calculated with one-way ANOVA test. ****P < 0.0001 and **P = 0.0087. Controls: N = 27; Kras: N = 13; and Kras; TfamLoxP/LoxP: N = 12. (F and G) Representative H&E-stained images of lung tissue sections (F) and μCT scans (G) of the lungs isolated from Kras and TfamLoxP/LoxP mice. Scale bars, H&E: 1 mm and μCT: 2 mm.
Fig. 6.
Fig. 6.. Summary of findings and proposed model.
Schematic representation of the proposed model based on our findings. (A) Effect of whole body increased or reduced mtDNA levels on tumor burden. (B) Consequences of mtDNA depletion in tumor cells on tumor burden.

References

    1. Warburg O., On the origin of cancer cells. Science 123, 309–314 (1956). - PubMed
    1. Vasan K., Werner M., Chandel N. S., Mitochondrial metabolism as a target for cancer therapy. Cell Metab. 32, 341–352 (2020). - PMC - PubMed
    1. Weinberg S. E., Chandel N. S., Targeting mitochondria metabolism for cancer therapy. Nat. Chem. Biol. 11, 9–15 (2014). - PMC - PubMed
    1. Hensley C. T., Faubert B., Yuan Q., Lev-Cohain N., Jin E., Kim J., Jiang L., Ko B., Skelton R., Loudat L., Wodzak M., Klimko C., Millan E. M., Butt Y., Ni M., Oliver D., Torrealba J., Malloy C. R., Kernstine K., Lenkinski R. E., De Berardinis R. J., Metabolic heterogeneity in human lung tumors. Cell 164, 681–694 (2016). - PMC - PubMed
    1. Ždralević M., Brand A., Di Ianni L., Dettmer K., Reinders J., Singer K., Peter K., Schnell A., Bruss C., Decking S.-M., Koehl G., Felipe-Abrio B., Durivault J., Bayer P., Evangelista M., O’Brien T., Oefner P. J., Renner K., Pouysségur J., Kreutz M., Double genetic disruption of lactate dehydrogenases A and B is required to ablate the “Warburg effect” restricting tumor growth to oxidative metabolism. J. Biol. Chem. 293, 15947–15961 (2018). - PMC - PubMed

Substances