. 2024 Nov;10(44):eadq3539.
doi: 10.1126/sciadv.adq3539. Epub 2024 Nov 1.

Mouse α-synuclein fibrils are structurally and functionally distinct from human fibrils associated with Lewy body diseases

Affiliations

Mouse α-synuclein fibrils are structurally and functionally distinct from human fibrils associated with Lewy body diseases

Arpine Sokratian et al. Sci Adv. 2024 Nov.

Abstract

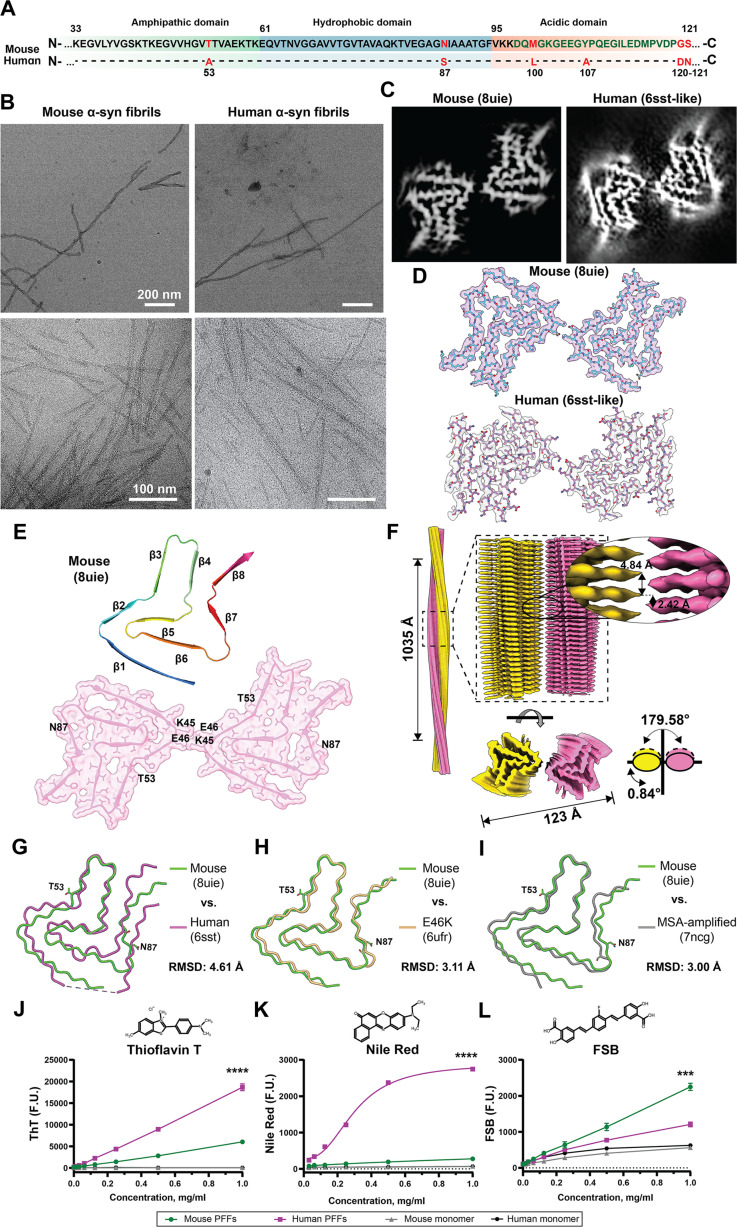
The intricate process of α-synuclein aggregation and fibrillization holds pivotal roles in Parkinson's disease (PD) and multiple system atrophy (MSA). While mouse α-synuclein can fibrillize in vitro, whether these fibrils commonly used in research to induce this process or form can reproduce structures in the human brain remains unknown. Here, we report the first atomic structure of mouse α-synuclein fibrils, which was solved in parallel by two independent teams. The structure shows striking similarity to MSA-amplified and PD-associated E46K fibrils. However, mouse α-synuclein fibrils display altered packing arrangements, reduced hydrophobicity, and heightened fragmentation sensitivity and evoke only weak immunological responses. Furthermore, mouse α-synuclein fibrils exhibit exacerbated pathological spread in neurons and humanized α-synuclein mice. These findings provide critical insights into the structural underpinnings of α-synuclein pathogenicity and emphasize a need to reassess the role of mouse α-synuclein fibrils in the development of related diagnostic probes and therapeutic interventions.


Figures

Fig. 1.
Fig. 1.. Mouse α-syn fibrils are structurally similar to human E46K-mutated and MSA-amplified α-syn fibrils.
(A) Primary amino acid sequence comparing mouse and human α-syn, with indicated divergent residues highlighted in red. Depicted three domains are amphipathic in green, hydrophobic in blue, and acidic in orange. (B) Representative TEM (top row) and cryo-EM (bottom row) micrographs of mouse and human α-syn fibrils. (C) Central slice of the 3D cryo-EM map of mouse and human α-syn fibrils. (D) Cryo-EM density map surfaces of α-syn fibril single filaments. (E) Cartoon depiction of the fitted atomic model of mouse α-syn structural arrangement with β-strand positions and a cross-sectional view of the cryo-EM density map with an overlaid molecular model representation of the 3D density surface rendering of the fibril core. Highlighted are residues involved in the formation of a salt bridge between protofilaments (K45-E46) and residues that differ between mouse and human α-syn sequence. (F) Side view of the density map of mouse α-syn left-handed helices with a crossover distance of 1035 Å and a twist of −0.84°. The densities of the two intertwining protofilaments are colored yellow and magenta. An overlay of one layer of mouse α-syn (8uie, green) with (G) recombinant human (6sst, magenta), (H) recombinant E46K (6ufr, yellow), and (I) MSA-amplified (7ncg, gray) structures with visualized T53 and N87 amino acid schematics and indicated aligned total RMSD values. Alignments shown are with respect to fibril core-based best fitting (see table S2). Chemical structure and binding curves of ThT (J), Nile Red (K), and FSB (L) to mouse and human sonicated α-syn fibrils (average radii: 16.68 ± 1.44 nm and 15.14 ± 4.02 nm, respectively). F.U., fluorescence units. Data points indicate means from three independent experiments, and error bars are SEM. ****P < 0.0001 and ***P < 0.01 from two-tailed t tests.
Fig. 2.
Fig. 2.. Distinct β-fold stacking arrangements in mouse α-syn fibrils contribute to low tensile strength and resilience.
(A) Cross–β-structure of five protofilament rungs, and schematic representation of stacking arrangements with estimated coordinates against the assigned baseline position (i) as the horizontal plane (37 to 57 amino acids) mouse (8uie) and (B) human (6sst) cryo-EM models. (C) Representation of proposed model of fibril fragmentation for tensile strength estimation used to simulate the MMGBSA energy of α-syn fibrils rupture and group analysis of MMGBSA energy required to disrupt a stack of six rungs. Error bars represent SD from 100 independent simulations. (D) Group comparison of fibril breakage under sonication conditions shown as the percent of size population of 10 to 100 nm (e.g., short fibrils) at 0, 2, and 30 min, measured by DLS. Error bars indicate SEM of three independent experiments, with 30 acquisition measurements corresponding to each experiment. (E) Filter-trap slot-blot analysis of sonicated fibrils (i.e., PFFs) exposed to different concentrations of guanidinium chloride (GuHCl), and then remaining fibrils detected with the fibril-selective antibody MJFR-14-6-4-2. Error bars indicate SEM from three independent experiments. (F) DLS analysis of PFFs after incubation with GuHCl. Error bars indicate SEM of three independent experiments with 10 acquisition measurements for each biological sample. Curves in (E) and (F) show asymmetric sigmoidal models with a goodness of fit >0.96, and **P < 0.01, **P < 0.001, ****P < 0.0001 from unpaired two-tailed t tests.
Fig. 3.
Fig. 3.. Mouse α-syn fibrils fail to elicit robust cytokine and lysosome damage in macrophages.
(A) Representative orthogonal views of LAMP1 immunostaining in human MDMs after 2 hours of incubation with mouse or human α-syn PFFs (1 μg/ml). Magnified boxes highlight PFF-positive LAMP1 vesicles. Scale bars, 5 μm and 0.5 μm. (B) Internalized Alexa Fluor 647–PFFs (% area) inside cells and (C) percent of LAMP1-positive vesicles positive for PFFs. Each data point represents the means of cells analyzed from at least eight images from three independent experiments. (D) ELISA analysis of the extracellular IL-6 and (E) CCL5 from MDM cultures treated with PFFs (1 μg/ml) for 3 and 24 hours. Each data point represents the mean from two technical replicates from four independent experiments. (F) Percent of Gal3-positive vesicles calculated per mm2 of cell surface area in PFF-treated MDM cultures after 24 hours of incubation and (G) percent of Gal3-positive vesicles also positive for DQ-PFFs after 48 hours of PFF incubation. Data points show the mean values from cells imaged across three independent experiments with at least eight images analyzed per group. (H) Representative images of Gal3 immunostaining after 24 hours of treatment with Alexa Fluor 647– or DQ-labeled PFFs. Orthogonal views of sequential z-stacks are shown. Side left image = x,y plane, side right image = y,z plane; top image = x,z plane. Scale bar, 5 μm. Error bars represent SEM and ***P < 0.001, *P < 0.05, and ns for not significant from unpaired two-tailed t tests (B, C, F, and G) or from Tukey’s post hoc test after analysis of variance (ANOVA) (D and E).
Fig. 4.
Fig. 4.. Mouse and human α-syn fibril uptake in neurons is similar and clathrin dependent.
(A) Time-dependent dynamics of pHrodo-labeled mouse or human PFF (1 μg/ml) internalization over 24 hours into human-PAC-wt-SNCA+/+/Snca−/− hippocampal primary neuronal cultures at DIV7, with normalized pHrodo-channel intensity to DAPI counts at the indicated time point. Each dot represents mean values from four images each from three independent neuronal cultures. (B) Representative immunofluorescence images of pHrodo-labeled PFF internalization at 24 hours. Merged images incorporate overlays of pHrodo-labeled PFF signal colored in magenta, DAPI in blue, and phase contrast in gray. (C) Representative images of ~60-day-old iPSC midbrain dopaminergic neurons treated with Alexa Fluor 568–labeled mouse or human PFFs at a concentration of 10 μg/ml. Merged images include Celltag labeling of total cell membrane in green, Alexa Fluor 568–labeled PFFs in red, and DAPI in blue. Owing to the high concentration of labeled fibrils used on iPSC-derived neurons, extracellular signals were quenched using 0.1% trypan blue. Cell masks highlight perinuclear and neuritic areas used for analysis. (D) Alexa Fluor 568 intensity in dopaminergic neurons and (E) intensity exclusively in the perinuclear area 8 hours after PFF incubation. Each dot represents the mean value of one image with at least 20 images collected from three independent experiments. (F) Calculated uptake of pHrodo-labeled α-syn PFFs at 24 hours in the presence of endocytosis inhibitors with signals normalized to vehicle only controls and (G) representative images. Merged images include the pHrodo-PFF signal indicated in magenta, DAPI in blue, and phase contrast in gray. Each dot in (F) represents the mean value of four images evaluated per condition from three independent experiments. Error bars for each group analysis represent SEM, and ns is not significant from two-tailed t tests.
Fig. 5.
Fig. 5.. Mouse α-syn fibril pathology propagation is more efficient than human α-syn in primary neurons.
(A) Representative immunostaining of neurons cultured from human-PAC-wt-SNCA+/+/Snca−/− hippocampal primary neuron culture treated with α-syn PFFs (1 μg/ml) for 14 days, or equivalent amounts of monomer as indicated, and stained against pS129–α-syn (magenta), Tau (gray), and NeuN (green), with levels of pS129–α-syn signal assessed relative to the number of neurons in the corresponding cultures. (B) To ensure the specificity of pS129–α-syn signals, control groups show the lack of signal in neurons cultured from Snca−/− mice following 14 days of incubation with α-syn PFFs or monomer as shown. (C) Representative images of inclusions in the cell bodies (indicated with arrows) and neurites (outlined in square boxes) in human-PAC-wt-SNCA+/+/Snca−/− neurons 14 days after PFF exposure. Scale bar, 50 μm and 10 μm (magnified images). (D) Abundance of distinct pS129–α-syn signals in cell bodies or neuritic morphology in neuronal cells treated with mouse or human α-syn PFFs (1 μg/ml). (E) Proportion of pS129–α-syn occupancy in cell body and neurites in primary hippocampal cultures incubated with mouse or human α-syn PFFs for 14 days. (F) ELISA quantification of α-syn aggregate levels in cell lysates from human-PAC-wt-SNCA+/+/Snca−/− or Snca−/− neuronal cultures treated with fibril PFFs or monomeric protein for 14 days. (G) Group analysis of NeuN-positive nuclei abundance normalized to DAPI count. Each data point in a group in the graphs represents the mean of signal from an individual litter with two technical replicates per litter and at least 25 images analyzed for each replicate, with error bars indicating SEM. Significance was determined by two-tailed t tests: **P < 0.001, ****P < 0.0001.
Fig. 6.
Fig. 6.. Mouse PFF induced α-syn pathology spreads through the mouse brain to seed human α-syn pathology more efficiently than human α-syn PFFs.
(A) Representative immunofluorescence images of pS129–α-syn pathology (magenta) and DAPI (gray) 3 months after PFF injection into human α-syn–expressing SNCA-OVX mice (lacking Snca expression). Matched (size and concentration) PFFs (10 μg) were unilaterally injected into the dorsal striatum. Analysis of pS129–α-syn pathology in the piriform cortex (top row), thalamus (middle row), and dorsal striatum (bottom row) is separated to indicate ipsilateral (Ipsi) and contralateral (Contr.) sides. Scale bars, 100 μm (top and middle rows) and 500 μm (bottom row). (B) Group analysis of α-syn pathology propagation ratio to contralateral side in piriform cortex, (C) thalamus, and (D) dorsal striatum, quantified as proportion of pSyn neuronal inclusion spread between ipsilateral and contralateral areas. (E) Analysis of pS129–α-syn pathology near the injection site within the ipsilateral dorsal striatum. Each data point (n = 5 per group) in group analysis plots represents the mean of the signal from 20 to 25 sections from an individual animal, and error bars indicate SEM. Significance was determined by two-tailed t tests: *P < 0.05.
Fig. 7.
Fig. 7.. Recruitment of human α-syn monomer into mouse PFFs leads to the generation of mouse-like fibrils.
(A) Representative aggregation assays showing mouse and human PFF-templated aggregation with human α-syn monomer, with (B) the calculated lag phase. Data points represent normalized ThT fluorescence from three independent experiments, with error bars indicating SEM. (C) Representative filter-trap slot-blot membranes stained with MJFR-14-6-4-2 α-syn aggregate-specific antibodies for the detection of aggregated α-syn in corroboration of aggregation kinetics without amyloid dyes. (D) Representative images of labeled (Alexa Fluor 647, magenta) mouse or human α-syn PFF-templated aggregation with human α-syn monomer, collected after 48 hours of incubation. Resultant fibril products were stained with ThT (green) shown with an overlay of PFFs (magenta). Scale bars, 0.5 μm. (E) Group analysis of ThT binding from chimeric or homogeneous sequence–extracted, monomer-free, sonicated α-syn fibril (PFF) products, as well as (F) Nile Red binding. Each data point in (E) and (F) represents a mean from an individual experiment measured in duplicate with three independent experiments. Error bars indicate SEM, **P < 0.01 from a two-tailed t test, and ***P < 0.001 from Tukey’s post hoc test after ANOVA.

Similar articles

Cited by

References

    1. Pollanen M. S., Dickson D. W., Bergeron C., Pathology and biology of the Lewy body. J. Neuropathol. Exp. Neurol. 52, 183–191 (1993). - PubMed
    1. Spillantini M. G., Schmidt M. L., Lee V. M., Trojanowski J. Q., Jakes R., Goedert M., α-Synuclein in Lewy bodies. Nature 388, 839–840 (1997). - PubMed
    1. Schweighauser M., Shi Y., Tarutani A., Kametani F., Murzin A. G., Ghetti B., Matsubara T., Tomita T., Ando T., Hasegawa K., Murayama S., Yoshida M., Hasegawa M., Scheres S. H. W., Goedert M., Structures of α-synuclein filaments from multiple system atrophy. Nature 585, 464–469 (2020). - PMC - PubMed
    1. Yang Y., Shi Y., Schweighauser M., Zhang X., Kotecha A., Murzin A. G., Garringer H. J., Cullinane P. W., Saito Y., Foroud T., Warner T. T., Hasegawa K., Vidal R., Murayama S., Revesz T., Ghetti B., Hasegawa M., Lashley T., Scheres S. H. W., Goedert M., Structures of α-synuclein filaments from human brains with Lewy pathology. Nature 610, 791–795 (2022). - PMC - PubMed
    1. Yang Y., Garringer H. J., Shi Y., Lövestam S., Peak-Chew S., Zhang X., Kotecha A., Bacioglu M., Koto A., Takao M., Spillantini M. G., Ghetti B., Vidal R., Murzin A. G., Scheres S. H. W., Goedert M., New SNCA mutation and structures of α-synuclein filaments from juvenile-onset synucleinopathy. Acta Neuropathol. 145, 561–572 (2023). - PMC - PubMed

MeSH terms