. 2024 Nov;10(44):eado8307.
doi: 10.1126/sciadv.ado8307. Epub 2024 Nov 1.

Proteomimetic polymer blocks mitochondrial damage, rescues Huntington's neurons, and slows onset of neuropathology in vivo

Affiliations

Proteomimetic polymer blocks mitochondrial damage, rescues Huntington's neurons, and slows onset of neuropathology in vivo

Wonmin Choi et al. Sci Adv. 2024 Nov.

Abstract

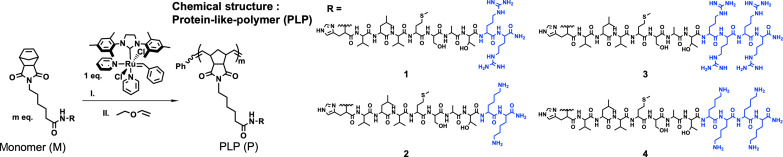
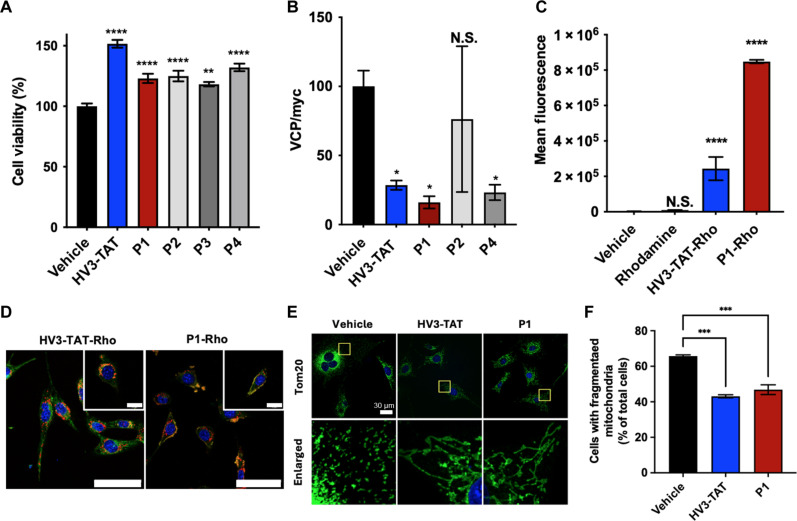
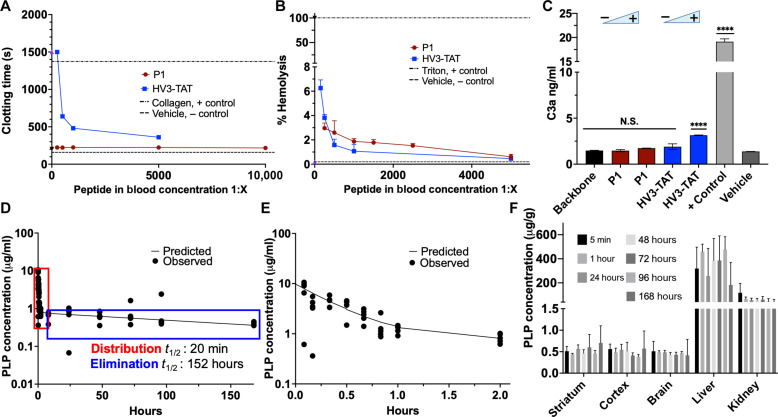
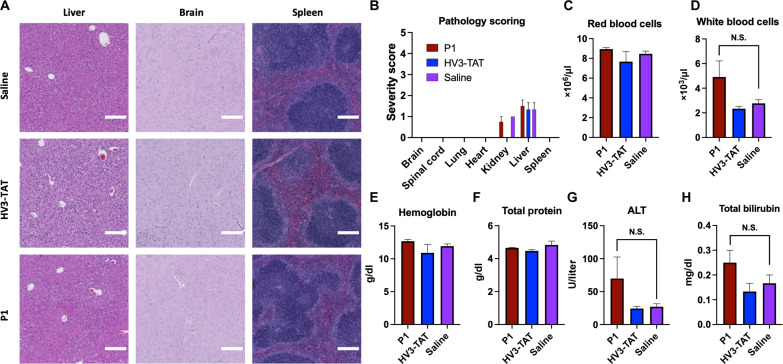
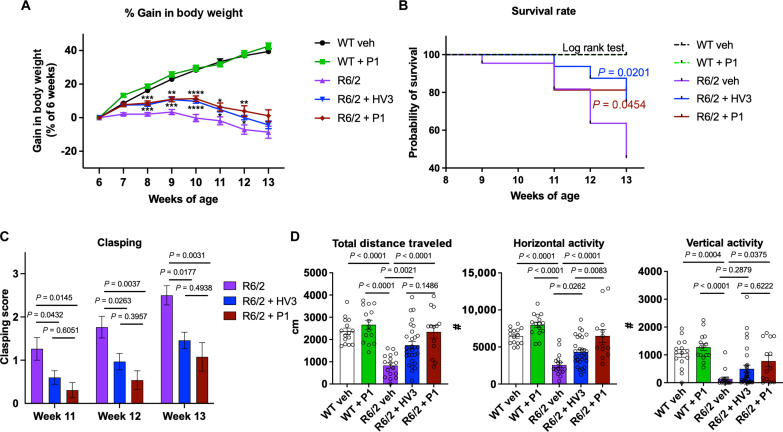
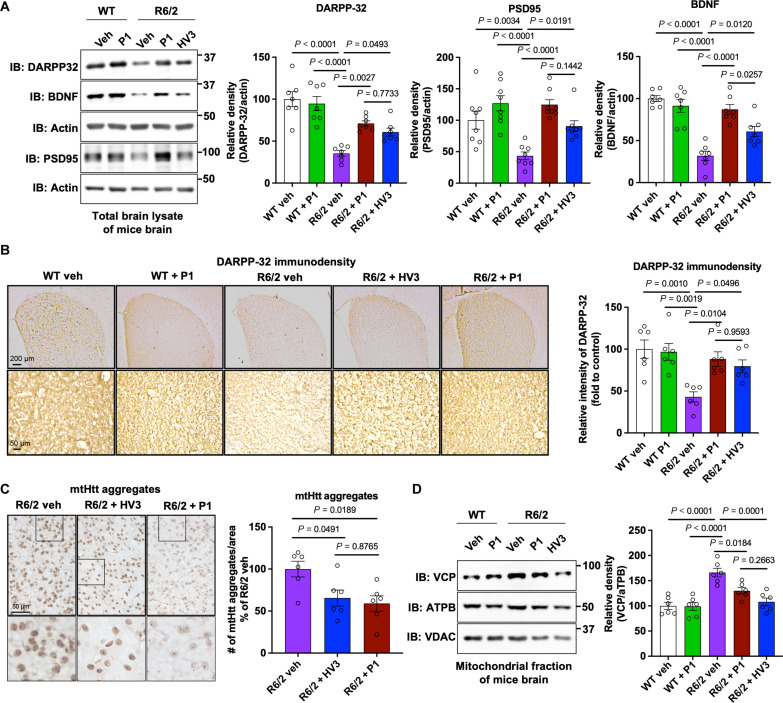
Recently, it has been shown that blocking the binding of valosin-containing protein (VCP) to mutant huntingtin (mtHtt) can prevent neuronal mitochondrial autophagy in Huntington's disease (HD) models. Herein, we describe the development and efficacy of a protein-like polymer (PLP) for inhibiting this interaction in cellular and in vivo models of HD. PLPs exhibit bioactivity in HD mouse striatal cells by successfully inhibiting mitochondrial destruction. PLP is notably resilient to in vitro enzyme, serum, and liver microsome stability assays, which render analogous control oligopeptides ineffective. PLP demonstrates a 2000-fold increase in circulation half-life compared to peptides, exhibiting an elimination half-life of 152 hours. In vivo efficacy studies in HD transgenic mice (R6/2) confirm the superior bioactivity of PLP compared to free peptide through behavioral and neuropathological analyses. PLP functions by preventing pathologic VCP/mtHtt binding in HD animal models; exhibits enhanced efficacy over the parent, free peptide; and implicates the PLP as a platform with potential for translational central nervous system therapeutics.


Figures

Fig. 1.
Fig. 1.. Structure of PLP.
HV3 peptide analogs with different number of positive charged amino acids (blue) were polymerized into PLPs P1, P2, P3, and P4 using ROMP polymerization technique.
Fig. 2.
Fig. 2.. In vitro efficacy assays.
(A) Cell viability of HV3-TAT peptide and PLPs. Concentration, 3 μM with respect to peptide (n = 8). (B) Association of VCP to mtHtt (Q73) was quantified by IP followed by Western blot upon treatment of HV3-TAT peptide or PLPs (n = 5). (C) Quantification of mean fluorescence output of flow cytometry cellular uptake in HdhQ111 cells. Treatments: HV3-TAT-Rho peptide, P1-Rho, rhodamine dye, and vehicle (n = 3). (D) Mitochondrial localization in live HdhQ111 cells. HdhQ111 cells were treated with HV3-TAT-Rho peptide, P1-Rho, and rhodamine dye alone at a concentration of 3 μM. Yellow indicates colocalization of green and red channels, signifying localization to the mitochondria. Mitochondria, MitoTracker Green FM (green channel). Material, Rhodamine (red channel). Nuclei, Hoechst 33342 stain (blue channel). Scale bars, 60 μm; 20 μm (inset). (E) Mitochondrial fragmentation assay. Mitochondrial morphology was determined by staining cells with anti-Tom20 antibody (Green). Nuclei, Hoechst 33342 stain (blue channel). Scale bar, 30 μm. The yellow boxes in the top panel have been magnified in the panel below for a more detailed view. (F) Mitochondrial fragmentation assay. The percentage of HdhQ111 cells with fragmented mitochondria relative to the total number of cells was quantitated. At least 95 cells per group were counted (n = 3). One-way analysis of variance (ANOVA) with multiple comparisons of the mean in each group with that of vehicle was used for analysis. Statistical significance was defined as follows: N.S. P > 0.05, *P ≤ 0.05, **P ≤ 0.01, ***P ≤ 0.001, and ****P ≤ 0.0001. Values are means ± SEM.
Fig. 3.
Fig. 3.. Biocompatibility and pharmacokinetic profiling for P1.
(A) Viscosity-based assay of ACTs of whole human blood. One-way ANOVA with repeated measures compared to mean of the positive control, collagen (n = 4). (B) % Hemolysis of red blood cells after the addition of P1 and HV3-TAT. One-way ANOVA with repeated measures compared to mean of the vehicle (n = 4). (C) Complement C3a activation ELISA to assess immunogenicity of P1 versus HV3-TAT. Positive control is cobra venom factor. One-way ANOVA performed with respect to vehicle (n = 4). (D) Pharmacokinetic profile of P1-Gd with predicted two-compartment model trend outlined overlayed with pharmacokinetic data. Elimination half-life is 152 hours (n = 5). (E) Distribution phase of the pharmacokinetic profile of P1-Gd from 5 min to 2 hours. Distribution half-life is 20 min (n = 5). (F) Biodistribution of P1-Gd. Micrograms of P1 per gram of organ across main time points, organized by organ (n = 5). One-way ANOVA comparisons of the mean of each group (striatum, cortex, and brain) was used for analysis (F). Statistical significance was defined as follows: N.S. P > 0.05, ****P ≤ 0.0001. Values are means ± SEM.
Fig. 4.
Fig. 4.. Representative optical micrographs and selected data for toxicity pathology analysis.
(A) WT C57BL/6J mice were dosed with saline or 3 mg kg−1 day−1 (with respect to peptide) of P1 or HV3-TAT from 6 to 13 weeks of age. Continuous dose administered via Alzet osmotic pump. Photomicrographs of hematoxylin and eosin (H&E)–stained tissue showing similar morphology across all groups. Scale bar, 200 μm. (B) Pathology severity scoring of H&E-stained tissue. Full scoring comments in table S6. (C to H) Representative graphs from complete blood count and blood biochemistry panel (remaining graphs in figs. S33 and S34). Group: Vehicle (n = 3), HV3-TAT (n = 3), P1 (n = 4). One-way ANOVA comparisons of the mean of each group were used for analysis [(C) to (H)]. Statistical significance was defined as follows: N.S. P > 0.05. Values are means ± SEM.
Fig. 5.
Fig. 5.. Behavioral analysis of P1 treatments in HD mice.
Male HD R6/2 mice and WT littermates were dosed with 3 mg kg−1 day−1 of HV3-TAT peptide, labeled HV3 in the graphs, and 1.69 mg kg−1 day−1 of P1 (3 mg kg−1 day−1 with respect to peptide) from 6 to 13 weeks of age. Continuous dose administered via Alzet osmotic pump. (A) Body weight was recorded from the age of 6 to 13 weeks (at week 6: WT, n = 15; WT + P1, n = 15; R6/2 veh, n = 22; R6/2 + HV3, n = 32; and R6/2 + P1, n = 16). Statistical significance was defined as follows: *P < 0.05, **P < 0.01, ***P < 0.001, and ****P < 0.0001. (B) Survival was recorded from the age of 6 to 13 weeks and analyzed by the log-rank (Mantel-Cox) test [same n number of each group with body weight in (A)]. (C) Hindlimb clasping was assessed through tail suspension test once a week from the ages of 11 to 13 weeks (at week 11: R6/2 veh, n = 19; R6/2 + HV3, n = 30; and R6/2 + P1, n = 13). (D) One hour of overall movement activity in R6/2 mice and WT littermates (total traveled distance, horizontal and vertical activities) was determined by locomotion activity chamber at the age of 12 weeks (WT, n = 15; WT + P1, n = 15; R6/2 veh, n = 17; R6/2 + HV3, n = 30; and R6/2 + P1: n = 13). All values are reported as means ± SEM. Data were compared using one-way ANOVA with Tukey’s post hoc test in (A), (C), and (D). Exact P values are shown in the figures. Values are means ± SEM.
Fig. 6.
Fig. 6.. Neuropathology analysis of P1 treatments in HD mice.
Male HD R6/2 mice and WT littermates were dosed with HV3-TAT peptide, labeled HV3 in the graphs for brevity, and P1 from 6 to 13 weeks of age via Alzet osmotic pump. (A) Total lysates from the striatum of 13-week-old R6/2 mice and WT littermates were subjected to WB with the indicated antibodies. Shown blots are representative of independent experiments. Histogram: the relative abundance of DARPP-32, PSD95, and BDNF. Actin was used as a loading control. n = 7 mice for DARPP-32 and BDNF, and n = 8 mice for PSD95. Brain sections of 13-week-old R6/2 mice and WT littermates were stained with (B) anti-DARPP-32 and (C) anti-Htt (clone EM48) antibodies. (B) DARPP-32 immunodensity was examined and quantified in the dorsolateral striatum of mice. n = 6 mice per group. (C) mtHtt aggregate numbers per area were quantified. n = 6 mice per group. (D) Mitochondrial fractions were isolated from the striatum of 13-week-old R6/2 mice and WT littermates and subjected to WB with the indicated antibodies. ATPB was used as a loading control of mitochondria. Left, representative blots from six independent experiments. Right, relative density of VCP in contrast to ATPB. All values are reported as means ± SEM. Data were compared using one-way ANOVA with Tukey’s post hoc test in (A) to (D). Exact P values are shown in the figures. Values are means ± SEM.

Similar articles

References

    1. Frank S., Treatment of Huntington’s disease. Neurotherapeutics 11, 153–160 (2014). - PMC - PubMed
    1. Pan L., Feigin A., Huntington’s disease: New frontiers in therapeutics. Curr. Neurol. Neurosci. Rep. 21, 10 (2021). - PubMed
    1. Gupta S., Khan A., Vishwas S., Gulati M., Gurjeet T., Dua K., Kumar S., Najda A., Sayed A. A., Almeer R., Abdel-daim M. M., Demethyleneberberine: A possible treatment for Huntington’s disease. Med. Hypotheses 153, 110639 (2021). - PubMed
    1. Gibson J. S., Isaacs D. A., Claassen D. O., Stovall J. G., Lifetime neuropsychiatric symptoms in Huntington’s disease: Implications for psychiatric nursing. Arch. Psychiatr. Nurs. 35, 284–289 (2021). - PubMed
    1. Ferguson M. W., Kennedy C. J., Palpagama T. H., Waldvogel H. J., Faull R. L. M., Kwakowsky A., Current and possible future therapeutic options for Huntington’s disease. J. Cent. Nerv. Syst. Dis. 14, 117957352210925 (2022). - PMC - PubMed

MeSH terms