. 2024 Nov;10(44):eadk8801.
doi: 10.1126/sciadv.adk8801. Epub 2024 Nov 1.

Pathogenic mitochondrial DNA mutations inhibit melanoma metastasis

Affiliations

Pathogenic mitochondrial DNA mutations inhibit melanoma metastasis

Spencer D Shelton et al. Sci Adv. 2024 Nov.

Abstract

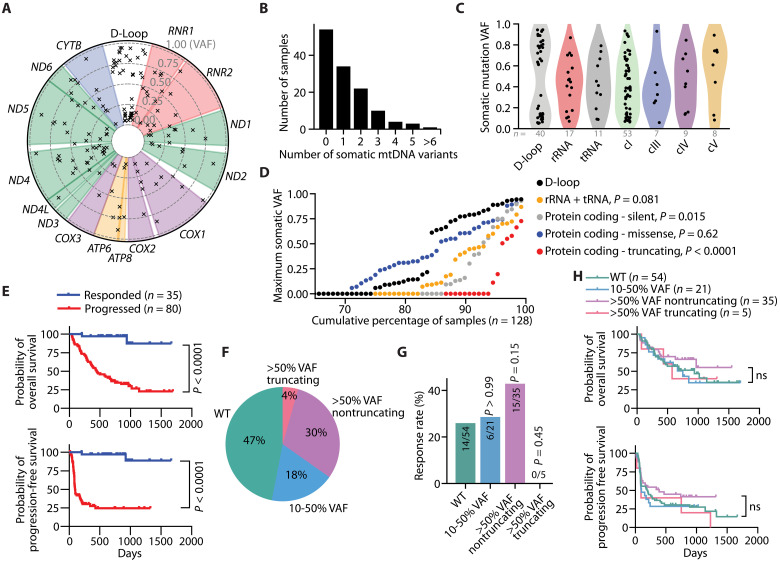
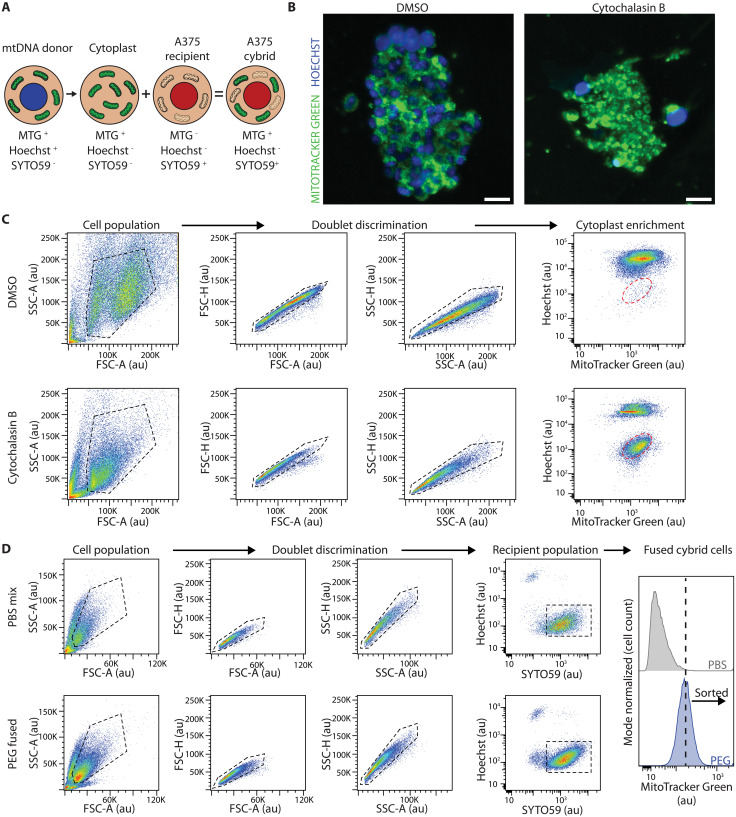
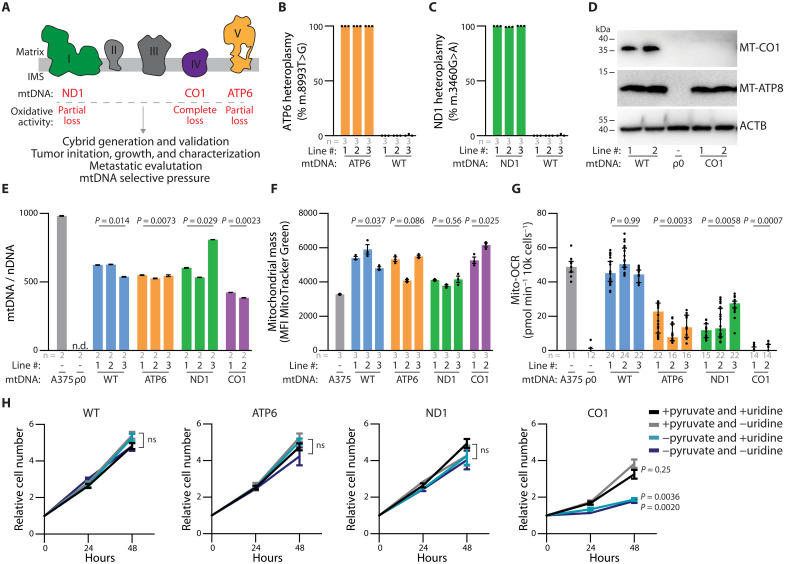
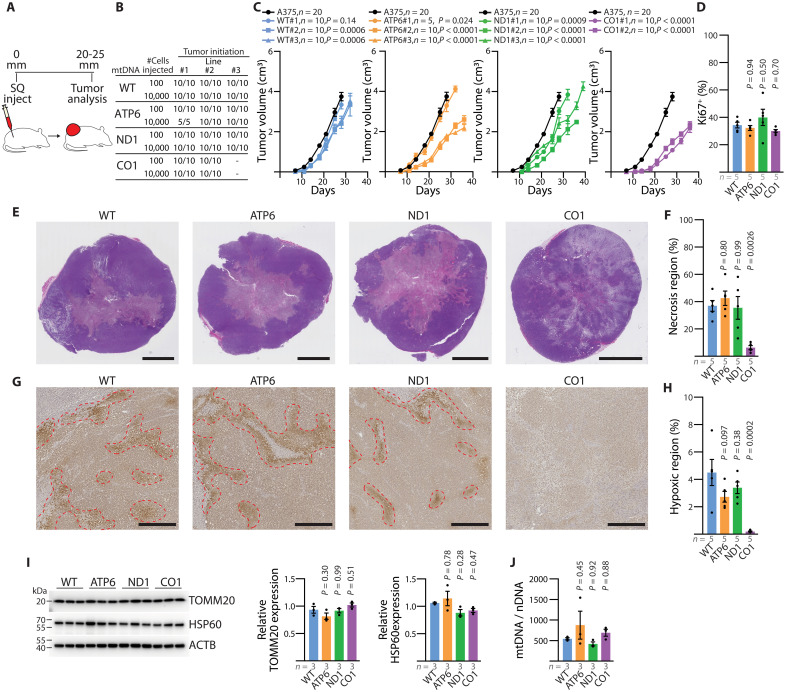
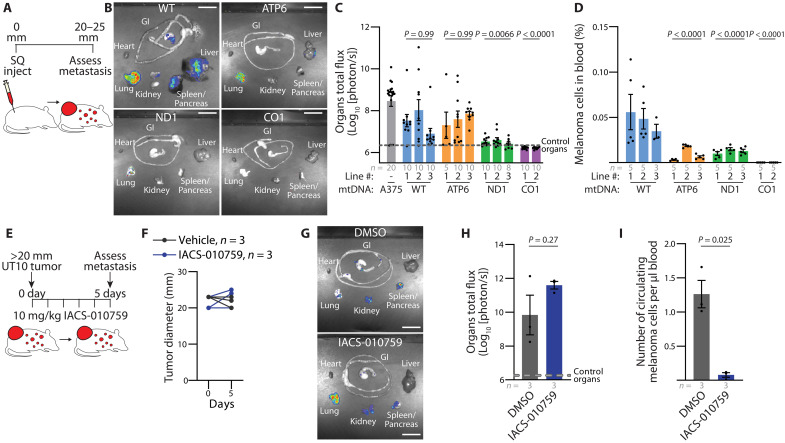
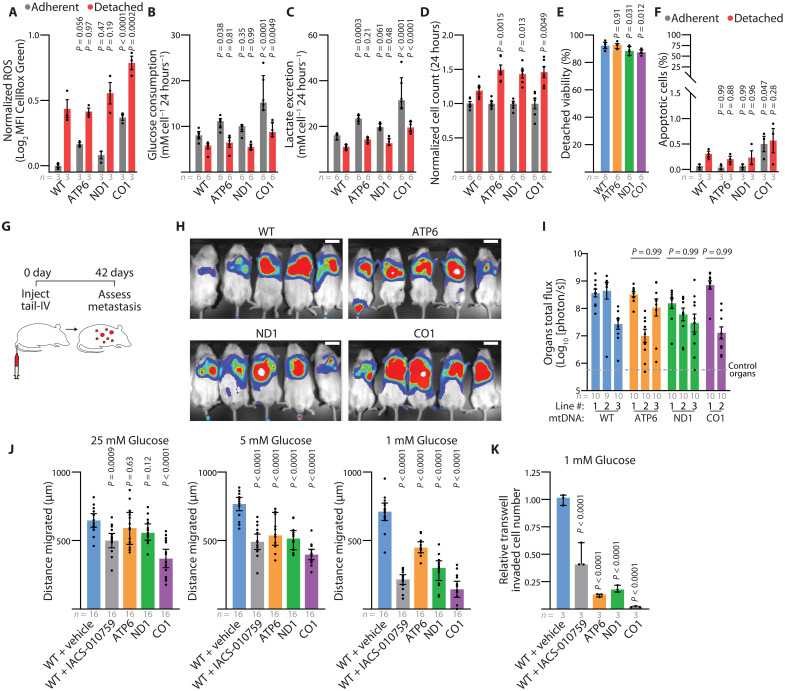
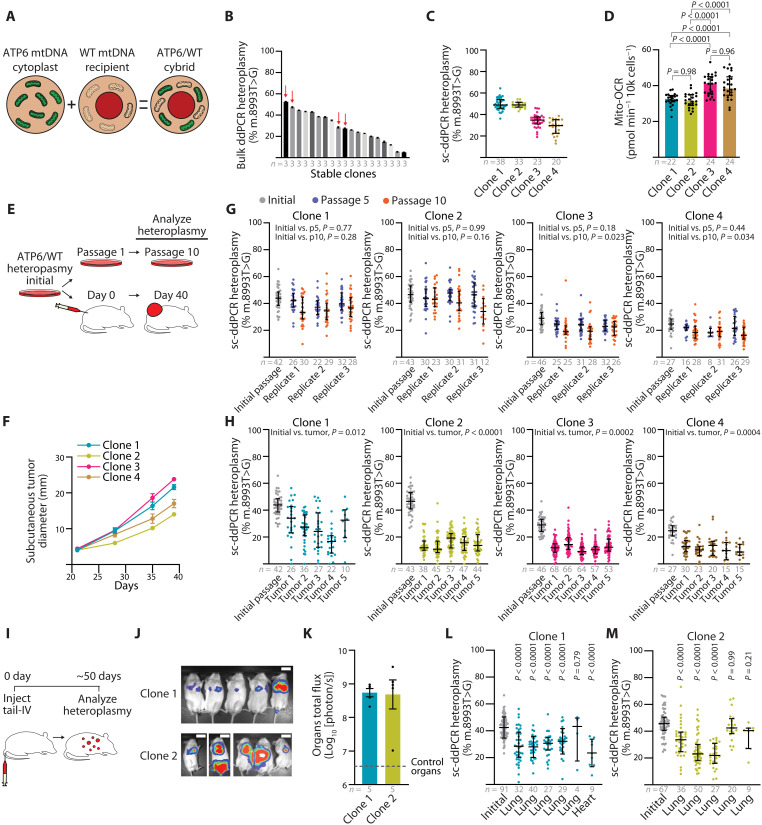
Mitochondrial DNA (mtDNA) mutations are frequent in cancer, yet their precise role in cancer progression remains debated. To functionally evaluate the impact of mtDNA variants on tumor growth and metastasis, we developed an enhanced cytoplasmic hybrid (cybrid) generation protocol and established isogenic human melanoma cybrid lines with wild-type mtDNA or pathogenic mtDNA mutations with partial or complete loss of mitochondrial oxidative function. Cybrids with homoplasmic levels of pathogenic mtDNA reliably established tumors despite dysfunctional oxidative phosphorylation. However, these mtDNA variants disrupted spontaneous metastasis from primary tumors and reduced the abundance of circulating tumor cells. Migration and invasion of tumor cells were reduced, indicating that entry into circulation is a bottleneck for metastasis amid mtDNA dysfunction. Pathogenic mtDNA did not inhibit organ colonization following intravenous injection. In heteroplasmic cybrid tumors, single-cell analyses revealed selection against pathogenic mtDNA during melanoma growth. Collectively, these findings experimentally demonstrate that functional mtDNA is favored during melanoma growth and supports metastatic entry into the blood.


Figures

Fig. 1.
Fig. 1.. Somatic mtDNA variants commonly arise in late-stage melanomas.
(A) Circos plot presenting all somatic mtDNA mutations identified within the melanoma cohort (n = 128 samples). The radial depth of the circos plot, extending from the center to the outer edge, reflects the variant allelic frequency (VAF) of each somatic mutation. (B) The number of somatic mutations identified within each melanoma sample. (C) Variant allele frequencies of somatic mtDNA mutations across different coding regions of mtDNA. (D) The cumulative distribution of the maximum mtDNA variant allele frequency categorized by mutation type. P values reflect comparisons with D-loop. (E) Kaplan-Meier plots showing overall survival (top) and progression-free survival (bottom) in melanomas with sufficient mtDNA read depth coverage. (F) The percentage of samples with annotated clinical outcomes (n = 115 total) for each mtDNA status. The WT group had no detectable somatic mtDNA mutations >0.1 VAF, while the missense and nonsense groups had the described somatic mtDNA mutations >0.5 VAF. (G) The percentage of samples responding to anti-PD1 therapies for each mtDNA status group. (H) Kaplan-Meier plot for overall survival among nonresponders to anti-PD1 therapy across samples with different mtDNA statuses. The number of samples (biological replicates) analyzed per group is indicated. Statistical significance was assessed using Mann-Whitney U test (D), Mantel-Cox (log-rank) [(E) and (H)] or χ2 test (G).
Fig. 2.
Fig. 2.. A flow-cytometry protocol to transplant mitochondrial genomes.
(A) Illustration of the cellular fractionation and staining used during generation of A375 cybrids. Donor mtDNA lines were stained with MitoTracker Green (MTG) and Hoechst before cytoplast generation. Cytoplasts were generated, enriched via flow cytometry, and then fused with mtDNA-depleted A375 ρ0 cells that were prestained with SYTO59. Successful cybrid cells were further enriched based on the presence of the SYTO59 signal and MitoTracker Green signal and on the absence of Hoechst signal. (B) Representative epifluorescence images of stained mtDNA donor 143Bnuclear Wild-typemtDNA cells following treatment with DMSO vehicle (left) and cytochalasin B (right) and centrifugation to generate cytoplasts. Scale bar, 25 μm. (C) Enrichment of cytoplasts following differential centrifugation with treatment of DMSO (top) or cytochalasin B (bottom). Cell gating populations are displayed with black dashed lines and sorted cytoplast population is shown with red dashed lines. SSC-A, side scatter area; SSC-H, side scatter height; FSC-A, forward scatter area; FSC-H, forward scatter height; au, arbitrary intensity units. (D) Flow cytometric enrichment of PBS (phosphate-buffered saline)–mixed (top) and PEG (polyethylene glycol)–fused cybrid cells (bottom). Cell gating populations are displayed with black dashed lines. Fusion positive populations were sorted for an enrichment of MitoTracker Green in the PEG-fused cybrid cells relative to the PBS-mixed cells.
Fig. 3.
Fig. 3.. mtDNA pathogenic variants in A375 homoplasmic cybrid lines affect mitochondria ETC activity.
(A) Schematic of electron transport chain with complexes labeled to display subunits with mtDNA variants investigated in this study. (B and C) ddPCR quantitation of allelic fraction for (B) MT-ATP6 mutation m.8993 T>G and (C) MT-ND1 mutation m.3460G>A in homoplasmic cybrid lines. (D) Western blot analysis for the indicated mtDNA-encoded proteins in homoplasmic cybrid cell lines. ACTB levels are shown as loading control. (E) Mitochondrial genome (mtDNA)–to–nuclear genome (nDNA) ratios in the indicated homoplasmic cybrid lines. n.d., not detected. P values reflect comparisons with the A375 parental line. (F) Mitochondrial mass as assessed by flow cytometric analysis of MTGreen staining in the indicated homoplasmic cybrid lines. P values reflect comparisons with the A375 parental line. MFI, mean fluorescence intensity. (G) Mitochondrial oxygen consumption rates (Mito-OCR) in indicated homoplasmic cybrid lines. P values reflect comparisons with the A375 parental line. (H) A375 cybrid in vitro growth rates in culture conditions deplete of pyruvate and/or uridine. P values reflect comparisons with complete media condition (+pyruvate and +uridine) at the 48-hour time point. ns, not significant. The number of samples (biological replicates) analyzed per group is indicated. Data are mean [(B) and (C)], mean ± SEM [(E), (F), and (H)], and median ± interquartile range (G). Statistical significance was assessed using one-way ANOVA with Dunn’s multiple comparison adjustment (D), nested one-way ANOVA with Dunn’s multiple comparison adjustment [(F) and (G)], and two-way ANOVA with Dunn’s multiple comparison adjustment (H).
Fig. 4.
Fig. 4.. Functional mtDNA is dispensable for primary melanoma growth.
(A) Illustration of subcutaneous injection to assess primary tumors of homoplasmic cybrid lines. (B) Frequency of tumor formation for indicated injection counts across homoplasmic cybrid lines. (C) Tumor growth rate of indicated cybrid lines following 10,000 cell subcutaneous injection. Homoplasmic growth data (black circle) are repeated as a reference in all panels. P values reflect comparison with the wild-type (WT) group. (D) Quantitation of the percentage of Ki67+ nuclei across subcutaneous tumors. P values reflect comparison with the WT group. (E) Representative H&E images of subcutaneous tumors. Scale bars, 5000 μm. (F) Quantitation of necrotic region as a percentage of tumor cross-sectional area. P values reflect comparison with the WT group. (G) Representative immunohistochemistry images for pimonidazole staining from subcutaneous tumors of the indicated mtDNA haplotype. Scale bars, 500 μm. (H) Quantitation of pimonidazole positive (hypoxic) regions as a percentage of tumor cross-sectional area. P values reflect comparison with the WT group. (I) Western blot analysis of mitochondrial outer membrane protein TOMM20 and matrix protein HSP60. ACTB expression is shown as loading control. P values reflect comparison with the WT group. (J) Mitochondrial genome content (mtDNA/nDNA) for subcutaneous tumors of the indicated mtDNA haplotype. The number of samples (biological replicates) analyzed per group is indicated. Data are mean ± SEM [(C), (D), (F), (H), (I), and (J)]. Statistical significance was assessed using exponential growth least squares fitting on the mean values of replicates followed by extra sum-of-squares F test with Holm-Sidak’s adjustment (C) and one-way ANOVA with Dunn’s multiple comparison adjustment [(D), (F), (H), (I), and (J)].
Fig. 5.
Fig. 5.. Spontaneous metastasis is reduced by dysfunctional mtDNA.
(A) Illustration of subcutaneous injection to assess spontaneous metastasis. (B and C) Representative images (B) and quantitation (C) of metastatic bioluminescence signal of organs from mice with late-stage subcutaneous xenografts of indicated cybrid lines. P values indicate comparisons with the A375 (parental) group. Scale bars, 20 mm. (D) Frequency of circulating melanoma cells from mice (as a percentage of DAPI negative events) with late-stage subcutaneous xenografts of indicated cybrid lines. P values indicate comparisons with the WT group. (E) Illustration of acute pharmacological evaluation of IACS-010759 to assess metastasis in the late-stage PDX model UT10. (F) Tumor diameter of xenografted UT10 mice treated with IACS-010759 or vehicle. (G and H) Representative images (G) and quantitation (H) of organ bioluminescence signal of UT10 xenograft following treatment with IACS-010759 or vehicle. Scale bars, 20 mm. (I) Circulating melanoma cells normalized to total blood volume of xenografted UT10 mice following treatment with IACS-010759 or vehicle. The number of samples (biological replicates) analyzed per group is indicated. Data are mean ± SEM [(C), (D), (H), and (I)]. Statistical significance was assessed using nonparametric Kruskal-Wallis test with Dunn’s multiple comparison adjustment (C), nested one-way ANOVA with Dunn’s multiple comparison adjustment (D), and two-tailed unpaired t test with Welch’s correction [(H) and (I)].
Fig. 6.
Fig. 6.. Dysfunctional mtDNA disrupts migratory potential in human melanoma.
(A to D) Reactive oxygen species (A), glucose consumption (B), lactate excretion (C), and cell count (D) for indicated cybrid cells after 24-hour adherent and detached culture. P values indicate comparison with WT group for each condition. MFI, mean fluorescence intensity. Same color scheme throughout. (E) Detached viability of indicated cybrid lines following 24 hours of culture. P values indicate comparison with the WT group. (F) Percentage of apoptotic cells following 24-hour culture in adherent or detached conditions. P values indicate comparison with the WT group. (G) Illustration of intravenous injection of cybrid lines to assess organ colonization. (H and I) Representative bioluminescence imaging of live mice (H) and quantitation of metastatic bioluminescence signal of organs (I) following intravenous injection of indicated cybrid lines. P values indicate comparisons with the WT group. Scale bars, 50 mm. (J) Twenty-four–hour wound healing assay quantification for indicated cybrid lines at 25, 5, and 1 mM glucose concentrations. Gap distance was quantified from the difference of the 0- and 24-hour wound gap. P values indicate comparisons with the WT + vehicle group for each glucose concentration. (K) Relative transwell invaded cells at 1 mM glucose concentration. P values indicate comparisons with the WT + vehicle group for each glucose concentration. The number of samples (biological replicates) analyzed per group is indicated. Data are mean ± SEM (A) and median ± interquartile range [(I), (J), and (K)]. Statistical significance was assessed using one-way ANOVA with Dunn’s multiple comparison adjustment (E), nonparametric Kruskal-Wallis test with Dunn’s multiple comparison adjustment (I), two-way ANOVA with Dunn’s multiple comparison adjustment [(A), (B), (C), (D), and (F)], and one-way ANOVA with Dunn’s multiple comparison adjustment [(J) and (K)].
Fig. 7.
Fig. 7.. Purifying mtDNA selection is a feature of melanoma growth.
(A) Overview of the ATP6/WT heteroplasmic cybrid generation. (B) Bulk ddPCR analysis of m.8993 T>G heteroplasmic frequency for ATP6/WT cybrids after clonal line establishment. Data from technical replicates are provided. Clones 1 to 4 selected for experiments are indicated with red arrows. (C) Single-cell ddPCR (sc-ddPCR) analysis of m.8993 T>G heteroplasmy for selected ATP6/WT cybrid clones. (D) Mitochondrial oxygen consumption rate of ATP6/WT heteroplasmic clones. (E) Illustration of heteroplasmic selection experiment. Initial cells were passaged for extended in vitro culture or xenografted for subcutaneous tumors in NSG mice. (F) Subcutaneous tumor diameter over time after xenograft of 100 cells from heteroplasmic ATP6/WT clones. (G) Single-cell ddPCR analysis of m.8993 T>G heteroplasmy for ATP6/WT heteroplasmic clones at passage 5 (p5) and passage 10 (p10) of in vitro culture. Three replicates were independently passaged and analyzed for each clone. (H) Single-cell ddPCR analysis of m.8993 T>G heteroplasmy for ATP6/WT heteroplasmic clones of subcutaneous xenograft of 100 cells following tumor growth. (I) Illustration of heteroplasmic selection assay following tail vein intravenous injection of ATP6/WT heteroplasmic clones. (J) Bioluminescence imaging of live mice following intravenous injection of 1000 cybrid cells. Scale bars, 50 mm. (K) Quantification of organ bioluminescence total flux following intravenous injections. (L and M) Single-cell ddPCR analysis of m.8993 T>G heteroplasmy for ATP6/WT heteroplasmic clones’ tumor nodules following intravenous injection. P values reflect comparisons with the initial passage. The number of samples (biological replicates, unless otherwise indicated) analyzed per group is indicated. Data are mean ± SEM [(B) and (F)] and median ± interquartile range [(C), (D), (G), (H), (K), and (L)]. Statistical significance was assessed by one-way ANOVA with Tukey’s multiple comparison adjustment (D). Nested one-way ANOVA with Dunn’s multiple comparison adjustment [(G) and (H)], one-way ANOVA with Dunn’s multiple comparison adjustment (L), and nonparametric Kruskal-Wallis test with Dunn’s multiple comparison adjustment (M).

Update of

References

    1. Holt I. J., Harding A. E., Morgan-Hughes J. A., Deletions of muscle mitochondrial DNA in patients with mitochondrial myopathies. Nature 331, 717–719 (1988). - PubMed
    1. Tuppen H. A., Blakely E. L., Turnbull D. M., Taylor R. W., Mitochondrial DNA mutations and human disease. Biochim. Biophys. Acta 1797, 113–128 (2010). - PubMed
    1. Gorman G. S., Chinnery P. F., DiMauro S., Hirano M., Koga Y., McFarland R., Suomalainen A., Thorburn D. R., Zeviani M., Turnbull D. M., Mitochondrial diseases. Nat. Rev. Dis. Primers. 2, 16080 (2016). - PubMed
    1. Ju Y. S., Alexandrov L. B., Gerstung M., Martincorena I., Nik-Zainal S., Ramakrishna M., Davies H. R., Papaemmanuil E., Gundem G., Shlien A., Bolli N., Behjati S., Tarpey P. S., Nangalia J., Massie C. E., Butler A. P., Teague J. W., Vassiliou G. S., Green A. R., Du M.-Q., Unnikrishnan A., Pimanda J. E., Teh B. T., Munshi N., Greaves M., Vyas P., El-Naggar A. K., Santarius T., Collins V. P., Grundy R., Taylor J. A., Hayes D. N., Malkin D.; ICGC Breast Cancer Group; ICGC Chronic Myeloid Disorders Group; ICGC Prostate Cancer Group, Foster C. S., Warren A. Y., Whitaker H. C., Brewer D., Eeles R., Cooper C., Neal D., Visakorpi T., Isaacs W. B., Bova G. S., Flanagan A. M., Futreal P. A., Lynch A. G., Chinnery P. F., Dermott U. M., Stratton M. R., Campbell P. J., Origins and functional consequences of somatic mitochondrial DNA mutations in human cancer. eLife 3, e02935 (2014). - PMC - PubMed
    1. Gorelick A. N., Kim M., Chatila W. K., La K., Hakimi A. A., Berger M. F., Taylor B. S., Gammage P. A., Reznik E., Respiratory complex and tissue lineage drive recurrent mutations in tumour mtDNA. Nat. Metab. 3, 558–570 (2021). - PMC - PubMed

Publication types

Substances