. 2024 Nov;10(44):eadp7725.
doi: 10.1126/sciadv.adp7725. Epub 2024 Nov 1.

Membrane potential stimulates ADP import and ATP export by the mitochondrial ADP/ATP carrier due to its positively charged binding site

Affiliations

Membrane potential stimulates ADP import and ATP export by the mitochondrial ADP/ATP carrier due to its positively charged binding site

Vasiliki Mavridou et al. Sci Adv. 2024 Nov.

Abstract

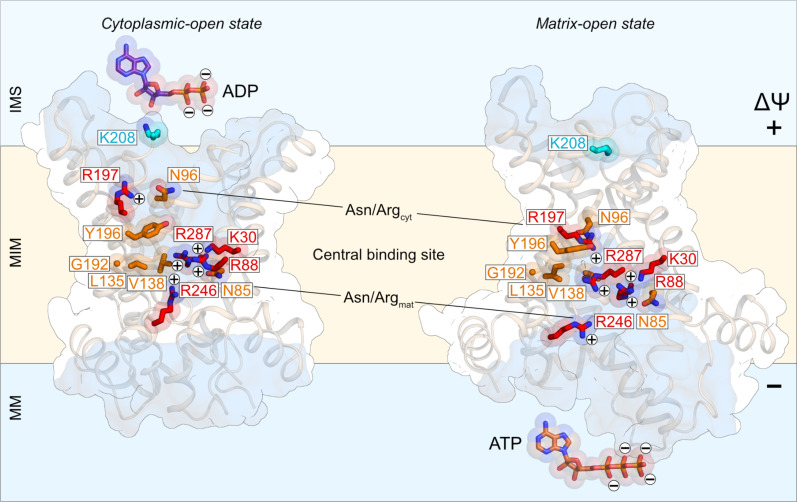
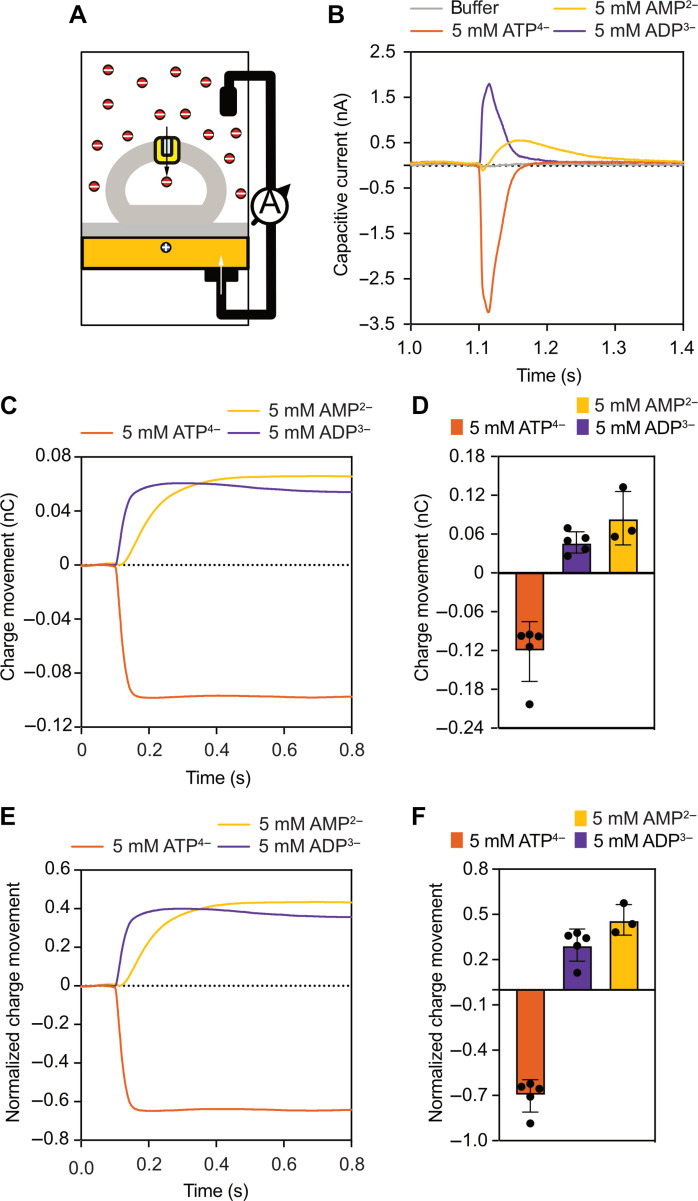
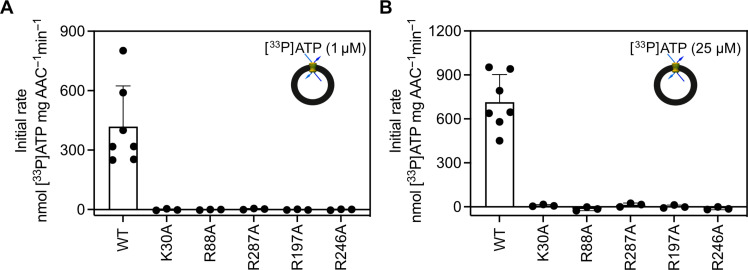
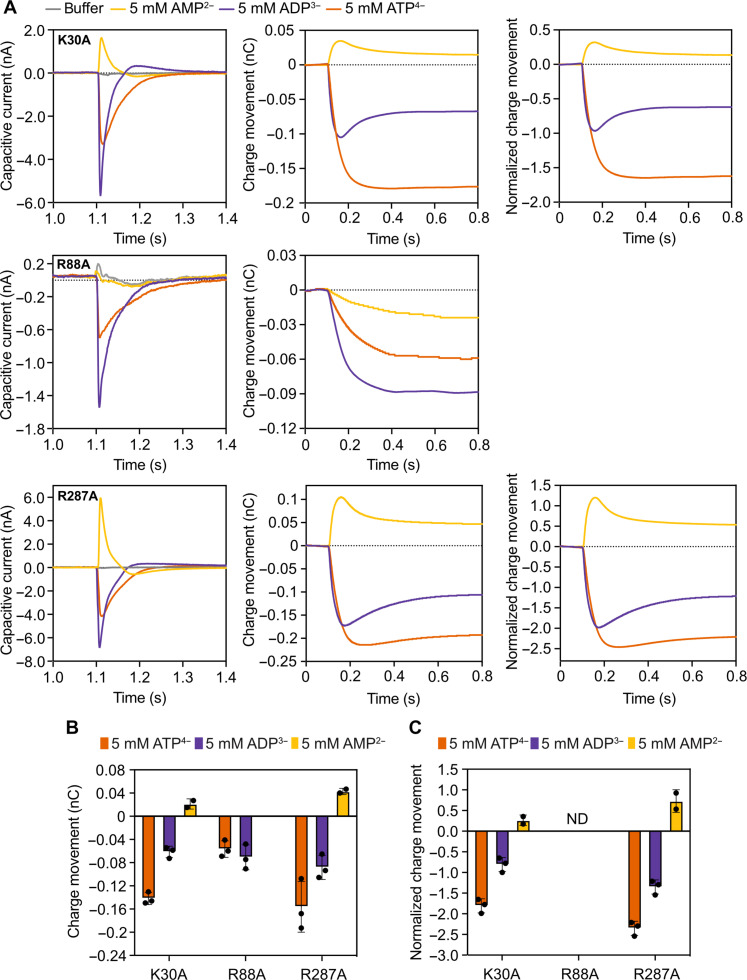
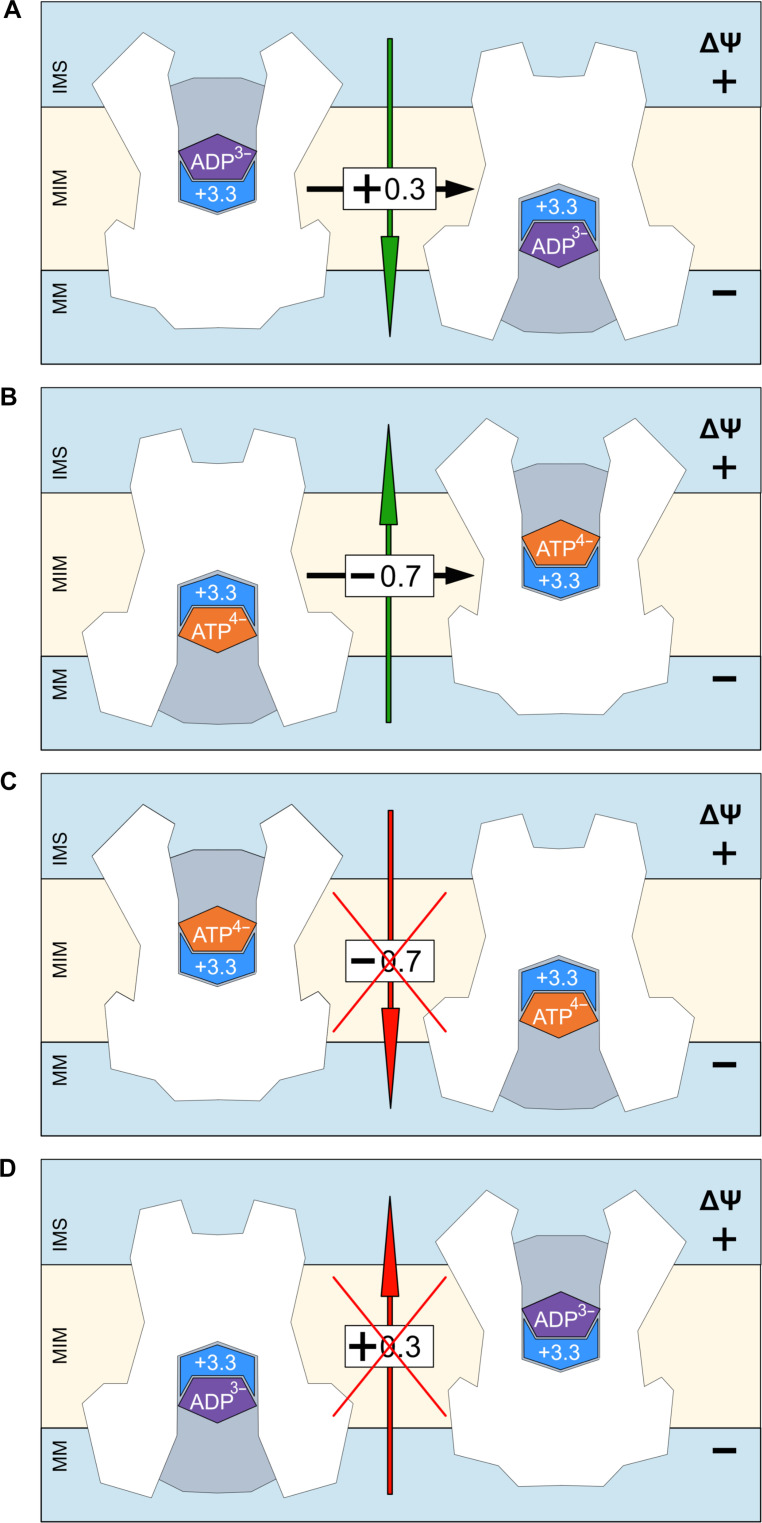
The mitochondrial adenosine 5'-diphosphate (ADP)/adenosine 5'-triphosphate (ATP) carrier imports ADP into the mitochondrion and exports ATP to the cell. Here, we demonstrate that 3.3 positive charges are translocated with the negatively charged substrate in each transport step. They can be assigned to three positively charged residues of the central substrate-binding site and two asparagine/arginine pairs. In this way, the membrane potential stimulates not only the ATP4- export step, as a net -0.7 charge is transported, but also the ADP3- import step, as a net +0.3 charge is transported with the electric field. These positive charge movements also inhibit the import of ATP and export of ADP in the presence of a membrane potential, allowing these nucleotides to be maintained at high concentrations in the cytosol and mitochondrial matrix to drive the hydrolysis and synthesis of ATP, respectively. Thus, this is the mechanism by which the membrane potential drives adenine nucleotide exchange with high directional fluxes to fuel the cellular processes.


Figures

Fig. 1.
Fig. 1.. Positively charged residues putatively involved in charge movements.
Lateral views of the cytoplasmic-open state [ScAac2, Protein Data Bank (PDB) code 4c9h, chain A] (left) and matrix-open state (TtAac, PDB code 6gci, chain A) (right) of the mitochondrial ADP/ATP carrier. The interacting residues of ScAac2 are conserved in TtAac, and to facilitate comparison, we used the TtAac labeling. The water-accessible surfaces, determined by HOLE59, are shown in transparent blue. The positively charged residues with an essential role in substrate binding are shown in red (red labeling), whereas neutral residues that are also important for substrate binding are shown in orange (orange labeling). K208, which serves as a control, is shown in cyan. The substrates ADP and ATP are shown in purple and salmon red, respectively. MM, mitochondrial matrix; MIM, mitochondrial inner membrane; IMS, mitochondrial intermembrane space.
Fig. 2.
Fig. 2.. Charge movements by the mitochondrial ADP/ATP carrier.
(A) Experimental setup for measurements of charge movements using solid-supported membrane-based electrophysiology. (B) Capacitive currents induced by 5 mM AMP, ADP, or ATP, measured by using empty liposomes (no internal substrate) in which the wild-type ADP/ATP carrier was reconstituted. The curves represent one example experiment, with each current being recorded twice. (C) Charge movements (nC) over time. Integrated data taken from (B). (D) Average of charge movements. The bars and error bars represent the mean and SD of three to five independent biological repeats. For each biological repeat, one to three sensor preparations were averaged, and each capacitive current was recorded twice on each sensor. (E) Normalized charge movements over time, using the formal charge difference between ADP and ATP. Data taken from (B). (F) Average of normalized charge movements, induced by 5 mM AMP, ADP, or ATP. The bars and error bars represent the mean and SD of three to five independent biological repeats.
Fig. 3.
Fig. 3.. Alanine replacement mutants of the positively charged residues involved in substrate binding do not transport ATP.
Initial transport rates determined from the linear part of the uptake curves. Proteoliposomes containing the wild-type (WT) or Ala variants were loaded with 1 mM unlabeled ATP. Transport was initiated by adding 1 μM (A) or 25 μM (B) [33P]ATP externally. Proteoliposomes with no internal substrate were used as controls, and the rates were subtracted from the rates achieved with loaded liposomes for each protein. The bars and error bars represent the mean and SD of seven biological repeats for the wild type and three for the variants. AAC, mitochondrial ADP/ATP carrier.
Fig. 4.
Fig. 4.. Charge movements by the central binding site replacement mutants of the mitochondrial ADP/ATP carrier.
(A) Capacitive currents (nA), charge movements (nC), and normalized charge movements over time, induced by 5 mM AMP, ADP, or ATP for K30A (top), R88A (middle), and R287A (bottom). The capacitive currents were measured by using empty proteoliposomes (no internal substrate) in which the indicated mutant was reconstituted. The curves represent one example experiment, with each current being recorded twice. (B) Average of charge movements. The bars and error bars represent the mean and SD of two to three independent biological repeats. For each biological repeat, one to three sensor preparations were averaged, and each capacitive current was recorded twice on each sensor. (C) Averaged normalized charge movements over time by using the formal charge difference between ADP and ATP. The bars and error bars represent the mean and SD of two to three independent biological repeats. ND, not determined.
Fig. 5.
Fig. 5.. Charge movements by the replacement mutants of the Asn/Arg pairs of the mitochondrial ADP/ATP carrier.
(A) Capacitive currents (nA), charge movements (nC), and normalized charge movements over time, induced by 5 mM AMP, ADP, or ATP for R197A (top) and R246A (bottom). The capacitive currents were measured by using empty proteoliposomes (no internal substrate) in which the indicated mutant was reconstituted. The curves represent one example experiment, with each current being recorded twice. (B) Average of charge movements. The bars and error bars represent the mean and SD of three independent biological repeats. For each biological repeat, one to three sensor preparations were averaged, and each capacitive current was recorded twice on each sensor.
Fig. 6.
Fig. 6.. Charge movements dictate the directionality of adenine nucleotide transport in the presence of a membrane potential.
(A) Import of ADP and (B) export of ATP, transport steps that are both stimulated by the membrane potential. (C) Import of ATP and (D) export of ADP, transport steps that are both opposed by the membrane potential because of charge movements of the substrate-binding site residues. The substrates ADP and ATP are shown in purple and salmon red, respectively, whereas the +3.3 charges of the binding site of the carrier are shown schematically in blue.

References

    1. Ruprecht J. J., Kunji E. R. S., Structural mechanism of transport of mitochondrial carriers. Annu. Rev. Biochem. 90, 535–558 (2021). - PubMed
    1. Ruprecht J. J., Kunji E. R. S., Structural changes in the transport cycle of the mitochondrial ADP/ATP carrier. Curr. Opin. Struct. Biol. 57, 135–144 (2019). - PMC - PubMed
    1. Kunji E. R., Aleksandrova A., King M. S., Majd H., Ashton V. L., Cerson E., Springett R., Kibalchenko M., Tavoulari S., Crichton P. G., Ruprecht J. J., The transport mechanism of the mitochondrial ADP/ATP carrier. Biochim. Biophys. Acta 1863, 2379–2393 (2016). - PubMed
    1. R. Garrett, C. M. Grisham, Biochemistry (Brooks/Cole, Cengage Learning, ed. 4, 2010).
    1. Buono M. J., Kolkhorst F. W., Estimating ATP resynthesis during a marathon run: A method to introduce metabolism. Adv. Physiol. Educ. 25, 70–71 (2001).

MeSH terms

Substances

LinkOut - more resources