. 2024 Nov 12;19(11):1620-1634.
doi: 10.1016/j.stemcr.2024.10.003. Epub 2024 Oct 31.

Neural crest precursors from the skin are the primary source of directly reprogrammed neurons

Affiliations

Neural crest precursors from the skin are the primary source of directly reprogrammed neurons

Justin J Belair-Hickey et al. Stem Cell Reports. .

Abstract

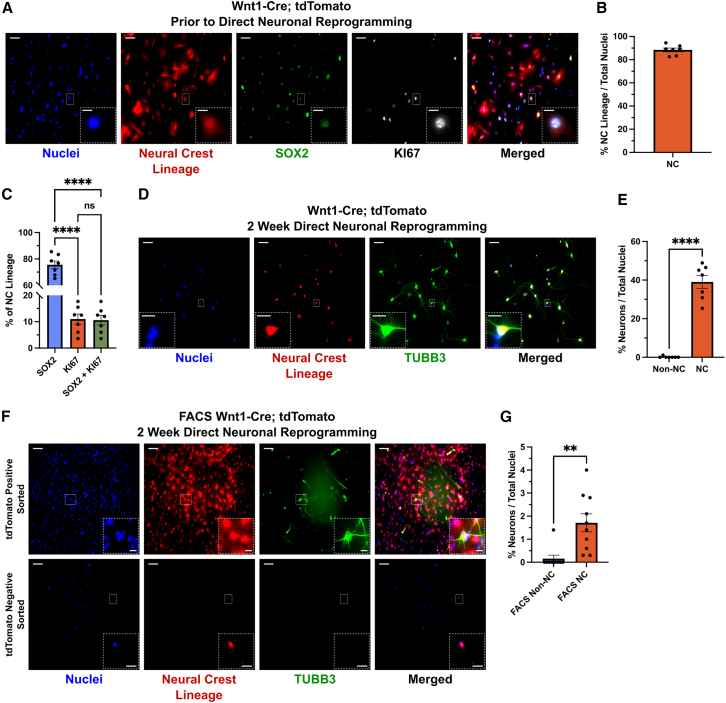
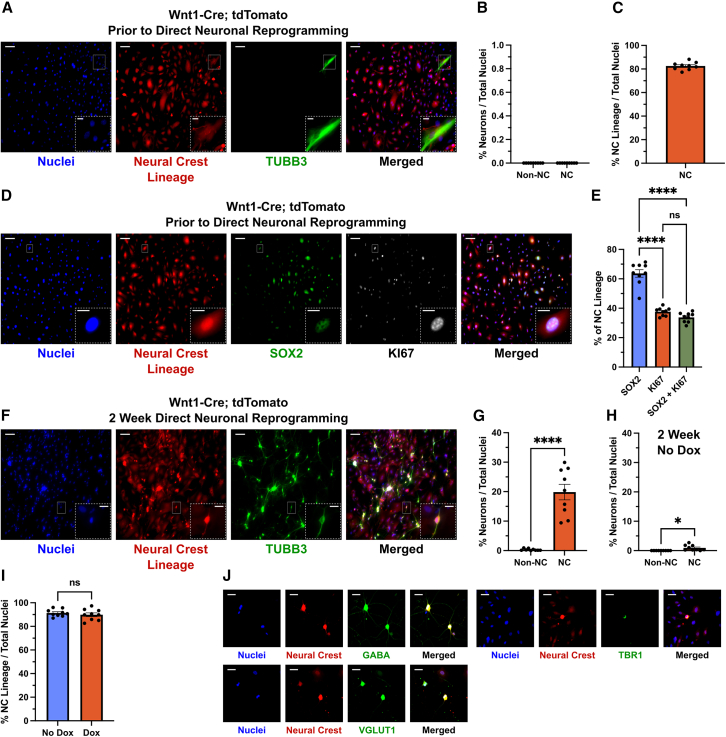
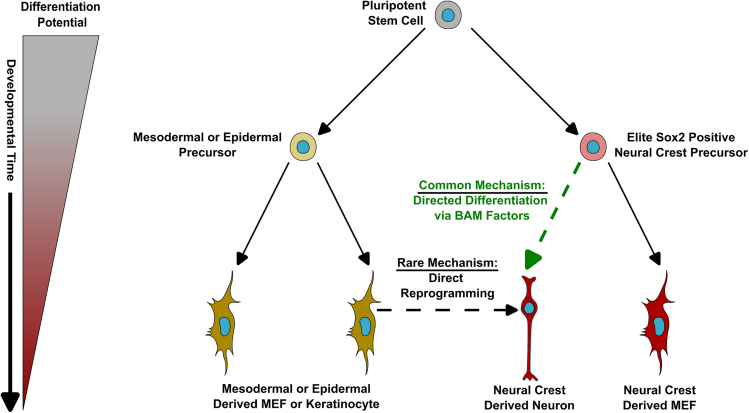
Direct reprogramming involves the conversion of differentiated cell types without returning to an earlier developmental state. Here, we explore how heterogeneity in developmental lineage and maturity of the starting cell population contributes to direct reprogramming using the conversion of murine fibroblasts into neurons. Our hypothesis is that a single lineage of cells contributes to most reprogramming and that a rare elite precursor with intrinsic bias is the source of reprogrammed neurons. We find that nearly all reprogrammed neurons are derived from the neural crest (NC) lineage. Moreover, when rare proliferating NC precursors are selectively ablated, there is a large reduction in the number of reprogrammed neurons. Previous interpretations of this paradigm are that it demonstrates a cell fate conversion across embryonic germ layers (mesoderm to ectoderm). Our interpretation is that this is actually directed differentiation of a neural lineage stem cell in the skin that has intrinsic bias to produce neuronal progeny.

Keywords: cell identity; direct reprogramming; embryonic lineage; fate mapping; germ layer; neural crest; neuron; plasticity; precursor cell differentiation; skin.


Conflict of interest statement

Declaration of interests The authors declare no competing interests.

Figures

Figure 1
Figure 1
iNs are derived from skin NC cells (A) Representative immunofluorescent micrographs of p3 skin cells derived from e14.5 Wnt1-Cre; tdTomato mice prior to direct iN reprogramming. (B) Quantification of the percentage of total cells that are derived from the NC prior to direct reprogramming (shown in A). N = 7 wells from 3 embryos. (C) Quantification of the percentage of total tdTomato-positive cells that are SOX2, KI67, or double-positive prior to direct reprogramming (shown in A). N = 7 wells from 3 embryos; one-way ANOVA with Tukey’s multiple comparisons test, ∗∗∗∗p < 0.0001. (D) Representative immunofluorescent micrographs after 2 weeks of direct iN reprogramming. (E) Quantification of the percentage of total cells that are iNs in the NC and non-NC lineage after 2 weeks of direct iN reprogramming (shown in D). N = 7 wells from 3 embryos; two-tailed unpaired Student’s t test, ∗∗∗∗p < 0.0001. (F) Representative immunofluorescent micrographs of p3 skin cells that were first FACS purified for the presence or absence of tdTomato and then reprogrammed for 2 weeks. (G) Quantification of the percentage of total cells that are iNs in the NC and non-NC sorted fractions (shown in F). Non-NC, n = 9 wells from 3 embryos; NC, n = 10 wells from 3 embryos; two-tailed unpaired Student’s t test, ∗∗p = 0.0025. For all micrographs, main scale bar is 100 μm and any insert is 25 μm. Error bars represent mean ± SEM.
Figure 2
Figure 2
NC lineage iNs display typical electrophysiological properties (A) Representative traces showing the action potentials triggered by injecting a series of current steps from −20 to +200 pA in an NC lineage iN (left). Typical traces displaying the voltage-gated ion currents evoked by stepping the membrane potentials to a series of potentials from −80 to +60 mV in an NC lineage iN (right). Inset displays voltage-gated Na+ currents. (B) Histogram showing the amplitude and half-width of action potentials, the resting membrane potentials, input resistance, and voltage-gated Na+ (measured at −10 mV) and K+ currents (measured at +60 mV) in 11 recorded cells. Error bars represent mean ± SEM. (C) Representative traces showing the evoked action potentials, triggered by injecting a series of current steps from −20 to +200 pA, were blocked by tetrodotoxin at 0.5 μM in an NC lineage iN.
Figure 3
Figure 3
Limb-derived MEFs are predominantly NC lineage and display an NC bias in direct iN reprogramming (A) Representative immunofluorescent micrographs of p3 limb MEFs derived from e14.5 Wnt1-Cre; tdTomato mice prior to direct iN reprogramming. (B) Quantification of the percentage of total cells that are iNs in the NC and non-NC lineage prior to direct reprogramming (shown in A). (C) Quantification of the percentage of total cells that are derived from the NC prior to direct reprogramming (shown in A). (D) Representative immunofluorescent micrographs of proliferating NC lineage MEFs prior to direct reprogramming. (E) Quantification of the percentage of total tdTomato-positive cells that are SOX2, KI67, or double-positive prior to direct reprogramming (shown in D). One-way ANOVA with Tukey’s multiple comparisons test, ∗∗∗∗p < 0.0001. (F) Representative immunofluorescent micrographs of limb MEFs after 2 weeks of direct iN reprogramming. (G) Quantification of the percentage of total cells that are iNs in the NC and non-NC lineage after 2 weeks of direct reprogramming (shown in F). Two-tailed unpaired Student’s t test, ∗∗∗∗p < 0.0001. (H) Quantification of the percentage of total cells that are iNs in the NC and non-NC lineage after 2 weeks in culture without the addition of DOX to induce direct reprogramming factor (BAM) expression. Two-tailed unpaired Student’s t test, p = 0.0109. (I) Quantification of the percentage of total cells that are NC lineage after 2 weeks with or without DOX reprogramming induction. Two-tailed unpaired Student’s t test, p = 0.4332. (J) Representative immunofluorescent micrographs of NC lineage limb MEFs after 2 weeks of direct reprogramming expressing excitatory (VGLUT1 and TBR1) and inhibitory (GABA) neuron markers. Scale bar is 50 μm. For all graphs, n = 9 wells from 3 embryos. Unless stated, micrograph main scale bar is 100 μm and any insert is 25 μm. Error bars represent mean ± SEM.
Figure 4
Figure 4
Epidermal lineage cells rarely directly reprogram to iNs (A) Representative immunofluorescent micrographs of p3 skin cells derived from e14.5 K15-CrePR1; tdTomato mice prior to direct reprogramming. Cells shown were treated with mifepristone (Cre inducer) for three passages prior to staining and imaging. (B) Quantification of the percentage of total cells that are epidermal lineage prior to direct reprogramming (shown in A). (−)Mif n = 9 wells from 3 embryos, (+)Mif n = 16 wells from 5 embryos; two-tailed unpaired Student’s t test; ∗∗∗∗p < 0.0001. (C) Quantification of percentage of total cells that are iNs prior to direct reprogramming (shown in A). All cells here are treated with mifepristone. N = 13 wells from 5 embryos. (D) Representative immunofluorescent micrographs of proliferating skin cells prior to direct reprogramming as described in (A). (E) Quantification of the percentage of non-epi. and epi. cells that are proliferating (shown in D). N = 12 wells from 5 embryos; two-tailed unpaired Student’s t test; p = 0.1737. (F) Representative immunofluorescent micrographs of mifepristone-treated skin cells after 2 weeks of direct reprogramming as described in (A). (G) Quantification of the percentage of total cells that are iNs in the epidermal and non-epidermal lineages (shown in F). N = 18 wells from 5 embryos; two-tailed unpaired Student’s t test; ∗∗∗∗p < 0.0001. (H) Quantification of the total length of all neurites per iN (shown in F). Mann-Whitney test; ∗∗p = 0.0074. (I) Quantification of complexity index per iN (shown in F). Mann-Whitney test; ∗∗p = 0.0012. (G and H) Non-epi. n = 95 neurons; epi. n = 65 neurons. For all micrographs, main scale bar is 100 μm and any insert is 25 μm. Error bars represent mean ± SEM.
Figure 5
Figure 5
NC precursor cells are the source of most iNs (A) Representative immunofluorescent micrographs of p3 skin cells derived from e14.5 Sox2-CreERT2; ROSA-DTA mice prior to direct reprogramming. (B) Quantification of the percentage of total cells that are NC precursors (SOX2 and KI67 positive) as shown in (A). (−)Tam cells are cultured without tamoxifen (no SOX2 kill) and (+)Tam cells are treated 3 days with tamoxifen (SOX2 kill). (−)Tam, n = 9 wells; (+)Tam, n = 10 wells; from 3 embryos; two-tailed unpaired Student’s t test, ∗∗∗∗p < 0.0001. (C) Representative immunofluorescent micrographs of Sox2-CreERT2; ROSA-DTA skin cells after 2 weeks of direct reprogramming. (D) Quantification of the percentage of total cells that are iNs after 2 weeks of direct reprogramming with or without prior tamoxifen treatment (shown in C). (−)Tam, n = 10 wells; (+)Tam, n = 10 wells; from 4 embryos; two-tailed unpaired Student’s t test, ∗∗p = 0.0030. (E) Quantification of the total length of all neurites per iN (shown in C). Mann-Whitney test; ∗∗p = 0.0061. (F) Quantification of complexity index per iN (shown in C). Mann-Whitney test; ∗∗p = 0.0049. (E and F) (−)Tam, n = 45 neurons; (+)Tam, n = 34 neurons. (G) Quantification of the percentage of total cells that are iNs after 2 weeks of direct reprogramming with or without prior tamoxifen treatment in vivo. Two-tailed unpaired Student’s t test, ∗∗∗∗p < 0.0001. (−)Cre, n = 1 well from 4 pups; (+)Cre, n = 5 wells from 3 pups. For all micrographs, main scale bar is 100 μm and any insert is 25 μm. Error bars represent mean ± SEM.
Figure 6
Figure 6
Updated model of how iNs arise in direct reprogramming experiments

References

    1. Achilleos A., Trainor P.A. Neural crest stem cells: discovery, properties and potential for therapy. Cell Res. 2012;22:288–304. doi: 10.1038/cr.2012.11. - DOI - PMC - PubMed
    1. Biddy B.A., Kong W., Kamimoto K., Guo C., Waye S.E., Sun T., Morris S.A. Single-cell mapping of lineage and identity in direct reprogramming. Nature. 2018;564:219–224. doi: 10.1038/s41586-018-0744-4. - DOI - PMC - PubMed
    1. Biernaskie J., Paris M., Morozova O., Fagan B.M., Marra M., Pevny L., Miller F.D. SKPs Derive from Hair Follicle Precursors and Exhibit Properties of Adult Dermal Stem Cells. Cell Stem Cell. 2009;5:610–623. doi: 10.1016/j.stem.2009.10.019. - DOI - PMC - PubMed
    1. Bocchi R., Masserdotti G., Götz M. Direct neuronal reprogramming: Fast forward from new concepts toward therapeutic approaches. Neuron. 2022;110:366–393. doi: 10.1016/j.neuron.2021.11.023. - DOI - PubMed
    1. Bowles K.R., Tcw J., Qian L., Jadow B.M., Goate A.M. Reduced variability of neural progenitor cells and improved purity of neuronal cultures using magnetic activated cell sorting. PLoS One. 2019;14 doi: 10.1371/journal.pone.0213374. - DOI - PMC - PubMed

Publication types

LinkOut - more resources