. 2024 Nov 12;19(11):1598-1619.
doi: 10.1016/j.stemcr.2024.09.009. Epub 2024 Oct 31.

Genome-wide screening reveals essential roles for HOX genes and imprinted genes during caudal neurogenesis of human embryonic stem cells

Affiliations

Genome-wide screening reveals essential roles for HOX genes and imprinted genes during caudal neurogenesis of human embryonic stem cells

Shay Kinreich et al. Stem Cell Reports. .

Abstract

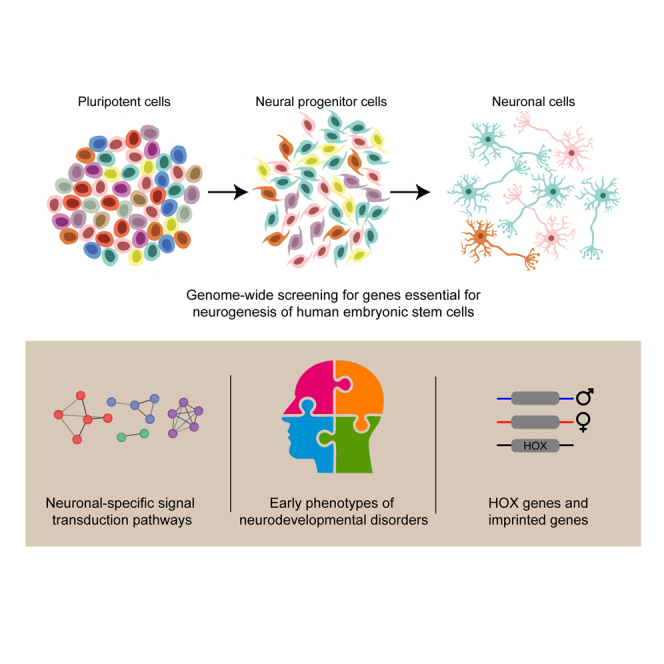
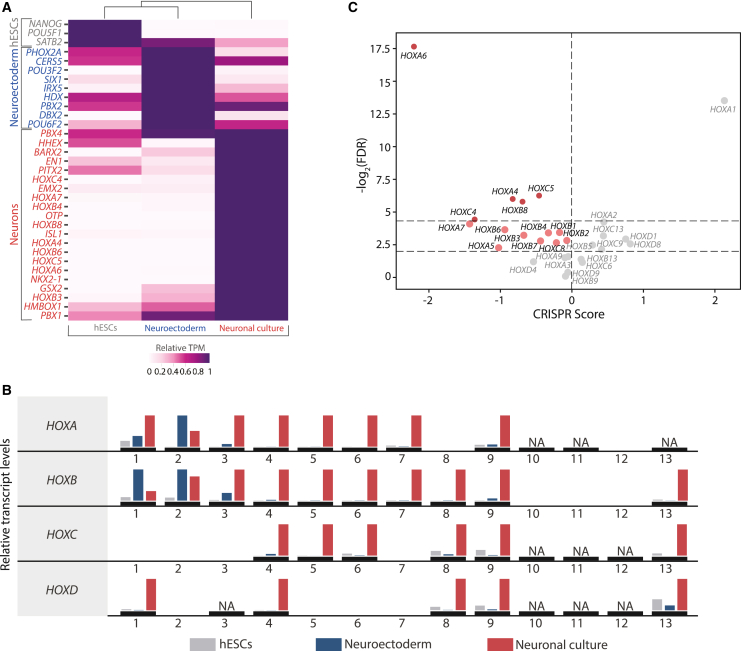
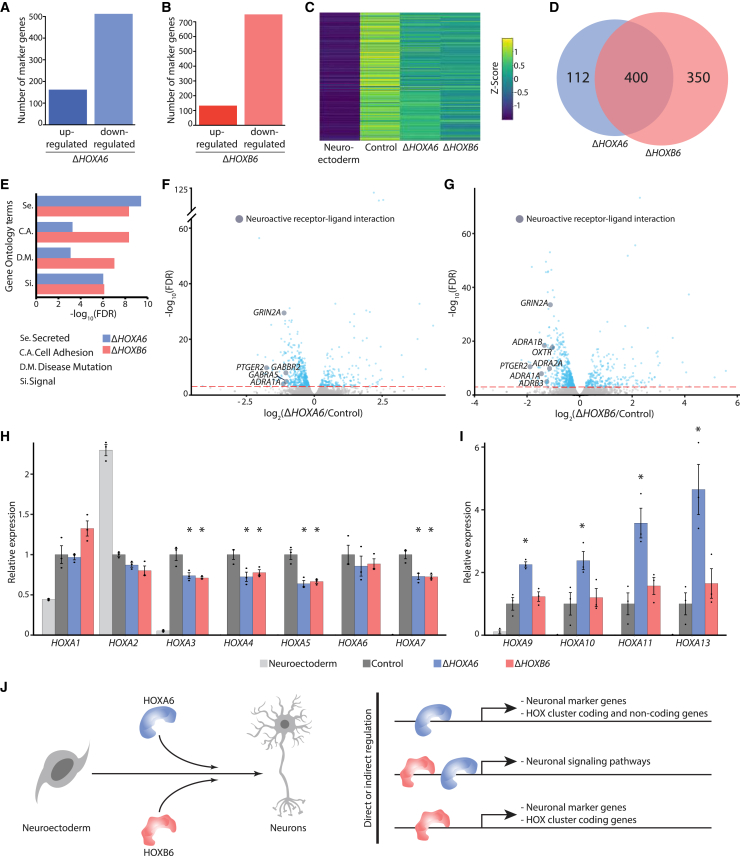
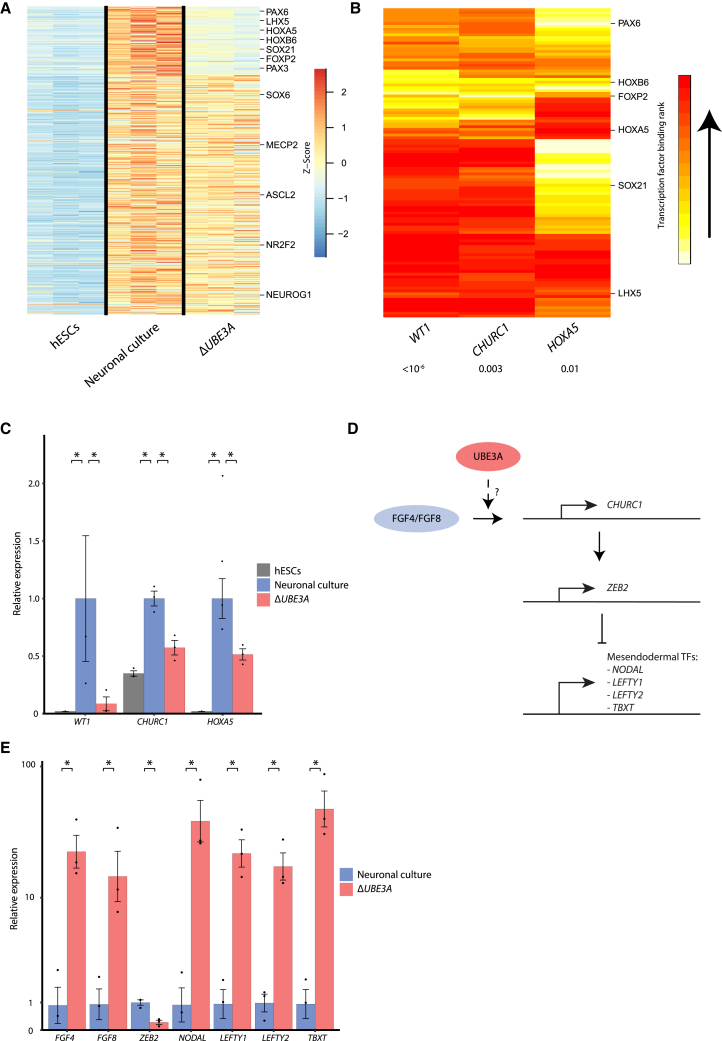
Mapping the essential pathways for neuronal differentiation can uncover new therapeutics and models for neurodevelopmental disorders. We thus utilized a genome-wide loss-of-function library in haploid human embryonic stem cells, differentiated into caudal neuronal cells. We show that essential genes for caudal neurogenesis are enriched for secreted and membrane proteins and that a large group of neurological conditions, including neurodegenerative disorders, manifest early neuronal phenotypes. Furthermore, essential transcription factors are enriched with homeobox (HOX) genes demonstrating synergistic regulation and surprising non-redundant functions between HOXA6 and HOXB6 paralogs. Moreover, we establish the essentialome of imprinted genes during neurogenesis, demonstrating that maternally expressed genes are non-essential in pluripotent cells and their differentiated germ layers, yet several are essential for neuronal development. These include Beckwith-Wiedemann syndrome- and Angelman syndrome-related genes, for which we suggest a novel regulatory pathway. Overall, our work identifies essential pathways for caudal neuronal differentiation and stage-specific phenotypes of neurological disorders.

Keywords: HOX genes; genome-wide screening; human pluripotent stem cells; neuronal differentiation; parental imprinting.


Conflict of interest statement

Declaration of interests The authors declare no competing interests.

Figures

None
Graphical abstract
Figure 1
Figure 1
Establishment of a genome-wide loss-of-function library to identify essential genes for neuronal differentiation of human embryonic stem cells (A) Heatmap demonstrating relative transcript levels of the markers of pluripotency, neural stem cells, and neurogenesis in undifferentiated hESCs, neuroectoderm, and neuronal culture (9 and 28 days of differentiation, respectively. n = 3 independent replicates, for each differentiation stage). (B) Log2 ratio of the percentage of essential genes in neuroectoderm and neuronal culture to that in hESCs for each cellular compartment. (C) Volcano plot demonstrating −log2 (FDR) and CRISPR scores (CS) (the average log2 ratio of the abundance of mutants in the neuronal cultures to their abundance in the neuroectoderm cultures) of genes that are associated with the plasma membrane and the extracellular matrix. Kolmogorov-Smirnov test was performed to determine the significance of depleted genes (n = 10–40 sgRNAs). 171 essential genes are labeled in pink. Signaling pathways identified by analyzing the predicted protein-protein interactions among the essential genes are highlighted in the schematic illustrations on the right. The thickness of the lines connecting the essential genes in the schematics indicates the level of the confidence for the interaction. Essential genes shown in the schematics within predicted signaling pathways are labeled in red in the volcano plot. See also Figures S1–S3.
Figure 2
Figure 2
Analysis of early differentiation phenotypes associated with neurological disorders (A) Pie chart demonstrating the distribution of percentages of neurological disease groups that are associated with essential genes for neuronal differentiation. (B–F) Percentage of essential genes for neuronal differentiation within all the genes that are associated with specific neurological conditions under broader categories of movement disorders (B), cephalies (C), ataxia and atrophies (D), autism and mental disorders (E), and developmental conditions (F). Less common types of movement disorders, cephalies, and mental disorders are averaged in one column. (G) Bar plot demonstrating the percentage of neurodegeneration-related genes with a low score based on their CRISPR scores and the level of their statistical significance (lower than −10, see experimental procedures for further details), in undifferentiated hESCs and in differentiated neuroectoderm cells or neuronal culture as indicated. ND, neurodegeneration. (H) Dot plots displaying scores of parkinsonism-related genes in undifferentiated hESCs and in differentiated neuroectoderm cells or neuronal culture as indicated. Genes are ordered alphabetically. Genes with a score lower than −10 are labeled with their gene symbol. See also Figure S4.
Figure 3
Figure 3
Essentiality of homeobox genes for neuronal differentiation (A) Heatmap demonstrating the relative expression levels of essential homeobox genes with an enriched expression for each developmental stage: hESCs, neuroectoderm and neuronal culture (n = 3 independent replicates, for each differentiation stage). Gene names for these stages are labeled in gray, blue, and red, respectively. (B) Relative transcript levels of HOX genes normalized to the developmental stage, at which it is expressed the most (hESCs in gray, neuroectoderm in blue, or neuronal culture in red). NA indicates expression values of transcripts per million (TPM) <1.5. Four HOX gene clusters (A–D) are shown with the genomic order of the paralogs they contain. Numbers in the x axis indicate the specific gene in the HOX cluster. (C) Volcano plot showing the −log2(FDR) values and CRISPR scores for HOX genes that are expressed in neuronal culture (TPM > 1.5, Kolmogorov-Smirnov test, n = 10–40 sgRNAs). Upper dashed line shows a significance cutoff of FDR <0.05, while the lower dashed line indicates a more permissive cutoff of FDR <0.25. Essential genes are labeled in red based on the more stringent statistical cutoff and in pink based on the more permissive cutoff. See also Figure S4.
Figure 4
Figure 4
Regulation of neuronal differentiation by HOXA6 and HOXB6 (A and B) The number of up- and downregulated neuronal marker genes in differentiated cultures of ΔHOXA6 (A) and ΔHOXB6 (B) as compared to differentiated control cultures. Marker genes were defined as those that were differentially expressed between the neuroectodermal cells and control neuronal cultures (fold change ≥ 2, n = 3 independent replicates, FDR < 0.05). (C) Heatmap demonstrating the relative expression levels of neuronal marker genes, which are downregulated in mutant cultures, between neuroectoderm, control, and ΔHOXA6 and ΔHOXB6 neuronal cultures. (D) Venn diagram showing the overlap and the differences between the downregulated neuronal marker genes in ΔHOXA6 and ΔHOXB6 neuronal cultures. (E) GO analysis of downregulated marker genes in ΔHOXA6 and ΔHOXB6 neuronal cultures. Shown are the highest-ranking common GO terms between the two mutants. (F and G) Volcano plots showing the expression ratio of plasma membrane- and extracellular matrix-associated genes between the ΔHOXA6 (F) or ΔHOXB6 (G) and the control neuronal culture. Dashed lines indicate a significance threshold of FDR <0.05 (n = 3 independent replicates). Genes that are labeled in gray are those among the top 35 significantly downregulated genes that are associated with the neuroactive receptor-ligand interaction in both mutants. (H and I) Relative transcript levels of proximal (H) and distal (I) HOXA cluster genes in neuroectodermal cells (light gray), control (dark gray),ΔHOXA6 (blue), and ΔHOXB6 (red) neuronal cultures. Expression values are normalized to the levels of control neuronal cultures for each gene. Statistically significant changes are labeled with an asterisk (n = 3 independent replicates, FDR <0.05, error bars represent standard error of the mean). (J) Schematics illustrating the roles of HOXA6 and HOXB6 in neuronal differentiation. Both genes have essential roles during differentiation (left). While they directly or indirectly regulate the expression of similar neuronal signaling pathways, they also have their unique targets among neuronal marker genes, coding, and non-coding genes within the HOX clusters (right). See also Figure S5.
Figure 5
Figure 5
The essentialome of maternally expressed genes during neurogenesis (A) Volcano plot demonstrating −log2(p value) and CRISPR scores of maternally expressed genes in loss-of-function screens of early embryonic stages using hESCs, endodermal, mesodermal, neuroectodermal, and neuronal cells. Kolmogorov-Smirnov test was performed to determine the significance of depleted genes. (B) Principal-component analysis plot of the transcriptome of three embryonic stages during neuronal differentiation (hESCs, neuroectoderm, and neuronal culture) and mutant neuronal cultures of UBE3A, PHLDA2, or SLC22A18 genes, and of both PHLDA2 and SLC22A18 genes (ΔPHLDA2/SLC22A18). (C) Bar plots showing the expression levels of markers of pluripotency (top), neurogenesis (middle), and five neuronal stage-specific HOX genes (bottom) in control hESC, neuroectodermal, and neuronal cells, and in mutant neuronal cultures of UBE3A, PHLDA2, or SLC22A18 genes, and of both PHLDA2 and SLC22A18 genes (ΔPHLDA2/SLC22A18). Statistically significant changes compared to control neuronal culture are indicated by asterisk (FDR < 0.05, n = 3 independent replicates for all samples except ΔPHLDA2/SLC22A18 where n = 2 independent replicates, error bars represent standard error of the mean). (D) −log(FDR) values of GO terms enriched within the downregulated genes in mutant compared to control neuronal cultures. Shown are the highest-ranking GO terms in ΔUBE3A. See also Figure S6.
Figure 6
Figure 6
UBE3A regulates lineage determination during neurogenesis (A) Heatmap demonstrating the relative expression levels of neuronal marker genes, which are downregulated in the mutant culture, between hESCs, control, and ΔUBE3A neuronal cultures (n = 3 independent replicates. (B) Heatmap showing the predicted genome-wide nuclear factor binding ranks of top three transcription factors that are predicted to regulate the neurogenesis-related nuclear factors that are downregulated in ΔUBE3A neuronal cultures. The statistical significance for the predicted regulation of the top three transcription factors is indicated underneath their gene name. (C) Bar plot representing the expression of the top three transcription factors suggested to be regulated by UBE3A. Shown are expression levels in undifferentiated hESCs, control, and ΔUBE3A neuronal cultures. Statistically significant changes compared to control neuronal culture are indicated by asterisk (FDR < 0.05, n = 3 independent replicates, error bars represent standard error of the mean). (D) Putative schematics showing the role of CHURC1 in lineage determination. (E) Bar plot demonstrating expression levels of the genes in CHURC1 pathway in control and ΔUBE3A neuronal cultures. Statistically significant changes are indicated by asterisk (FDR < 0.05, n = 3 independent replicates, error bars represent standard error of the mean). See also Figure S6.

References

    1. Amberger J.S., Bocchini C.A., Schiettecatte F., Scott A.F., Hamosh A. OMIM.org: Online Mendelian Inheritance in Man (OMIM®), an online catalog of human genes and genetic disorders. Nucleic Acids Res. 2015;43:D789–D798. doi: 10.1093/NAR/GKU1205. - DOI - PMC - PubMed
    1. Ambu R., Vinci L., Gerosa C., Fanni D., Obinu E., Faa A., Fanos V. WT1 expression in the human fetus during development. Eur. J. Histochem. 2015;59:2499. doi: 10.4081/ejh.2015.2499. - DOI - PMC - PubMed
    1. Angelman H. ‘Puppet’ children a report on three cases. Dev. Med. Child Neurol. 1965;7:681–688. doi: 10.1111/j.1469-8749.1965.tb07844.x. - DOI - PubMed
    1. Armstrong J.F., Pritchard-Jones K., Bickmore W.A., Hastie N.D., Bard J.B. The expression of the Wilms’ tumour gene, WT1, in the developing mammalian embryo. Mech. Dev. 1993;40:85–97. doi: 10.1016/0925-4773(93)90090-K. - DOI - PubMed
    1. Avior Y., Sagi I., Benvenisty N. Pluripotent stem cells in disease modelling and drug discovery. Nat. Rev. Mol. Cell Biol. 2016;17:170–182. doi: 10.1038/nrm.2015.27. - DOI - PubMed

Publication types

MeSH terms

Substances

LinkOut - more resources