. 2024 Nov 13;4(11):100692.
doi: 10.1016/j.xgen.2024.100692. Epub 2024 Oct 31.

Genetics of Latin American Diversity Project: Insights into population genetics and association studies in admixed groups in the Americas

Victor Borda  1 Douglas P Loesch  2 Bing Guo  2 Roland Laboulaye  2 Diego Veliz-Otani  2 Jennifer N French  2 Thiago Peixoto Leal  3 Stephanie M Gogarten  4 Sunday Ikpe  2 Mateus H Gouveia  5 Marla Mendes  6 Gonçalo R Abecasis  7 Isabela Alvim  6 Carlos E Arboleda-Bustos  8 Gonzalo Arboleda  8 Humberto Arboleda  8 Mauricio L Barreto  9 Lucas Barwick  10 Marcos A Bezzera  11 John Blangero  12 Vanderci Borges  13 Omar Caceres  14 Jianwen Cai  15 Pedro Chana-Cuevas  16 Zhanghua Chen  17 Brian Custer  18 Michael Dean  19 Carla Dinardo  20 Igor Domingos  11 Ravindranath Duggirala  12 Elena Dieguez  21 Willian Fernandez  8 Henrique B Ferraz  13 Frank Gilliland  17 Heinner Guio  22 Bernardo Horta  23 Joanne E Curran  12 Jill M Johnsen  24 Robert C Kaplan  25 Shannon Kelly  26 Eimear E Kenny  27 Barbara A Konkle  28 Charles Kooperberg  29 Andres Lescano  21 M Fernanda Lima-Costa  30 Ruth J F Loos  31 Ani Manichaikul  32 Deborah A Meyers  33 Michel S Naslavsky  34 Deborah A Nickerson  35 Kari E North  36 Carlos Padilla  37 Michael Preuss  27 Victor Raggio  38 Alexander P Reiner  39 Stephen S Rich  32 Carlos R Rieder  40 Michiel Rienstra  41 Jerome I Rotter  42 Tatjana Rundek  43 Ralph L Sacco  43 Cesar Sanchez  37 Vijay G Sankaran  44 Bruno Lopes Santos-Lobato  45 Artur Francisco Schumacher-Schuh  46 Marilia O Scliar  34 Edwin K Silverman  47 Tamar Sofer  48 Jessica Lasky-Su  47 Vitor Tumas  49 Scott T Weiss  47 Latin American Research Consortium on the Genetics of Parkinson’s Disease (LARGE-PD)National Institute of Neurological Disorders and Stroke (NINDS) Stroke Genetics Network (SiGN) ConsortiumTrans-Omics for Precision Medicine (TOPMed) Population Genetics Working GroupIgnacio F Mata  50 Ryan D Hernandez  51 Eduardo Tarazona-Santos  52 Timothy D O'Connor  53
Affiliations

Genetics of Latin American Diversity Project: Insights into population genetics and association studies in admixed groups in the Americas

Victor Borda et al. Cell Genom. .

Abstract

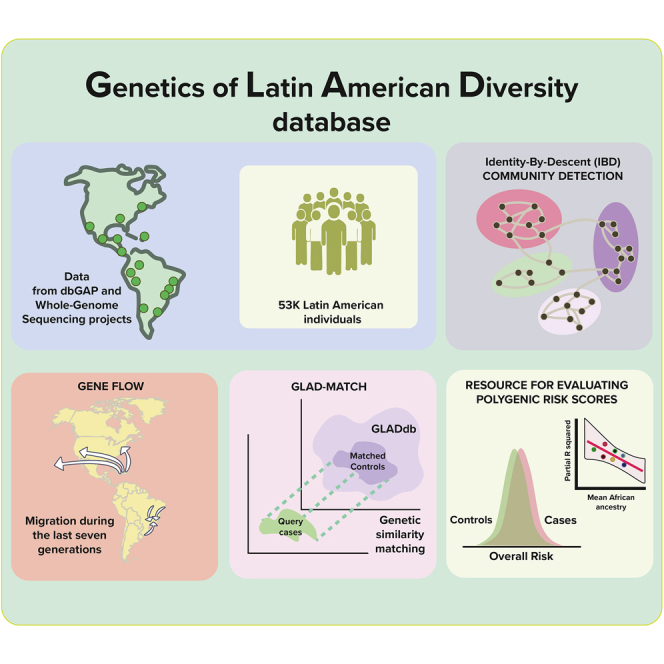
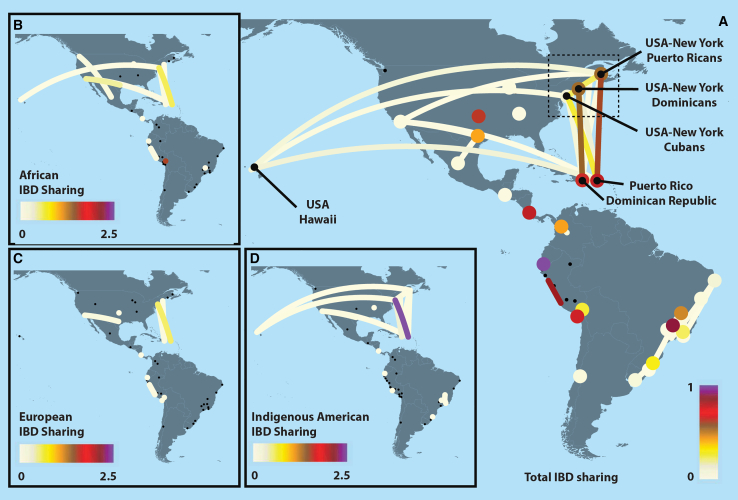
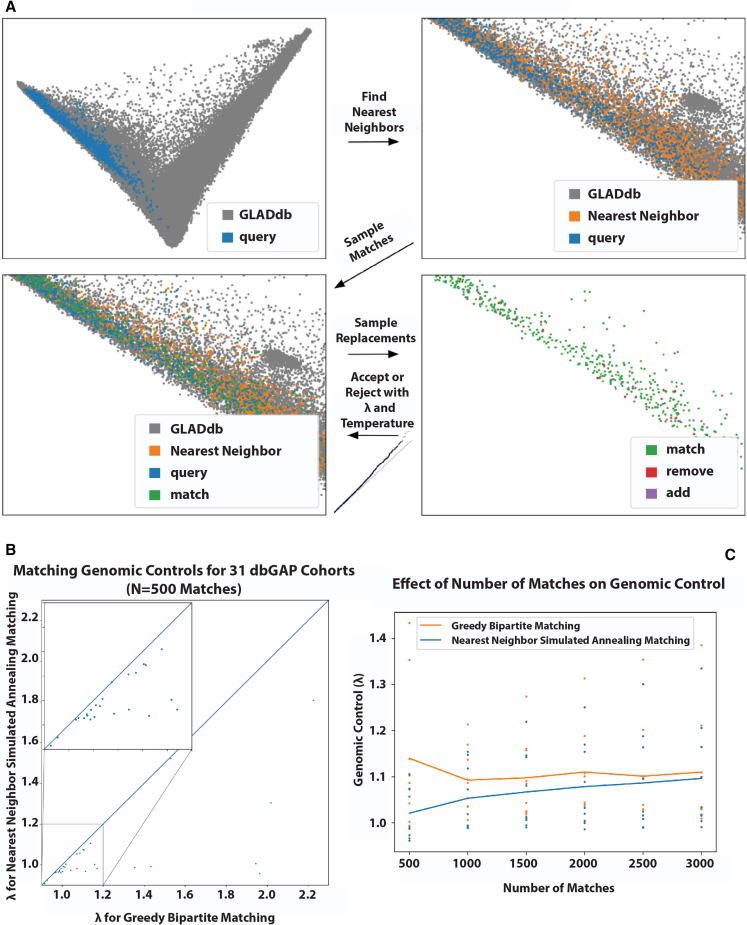
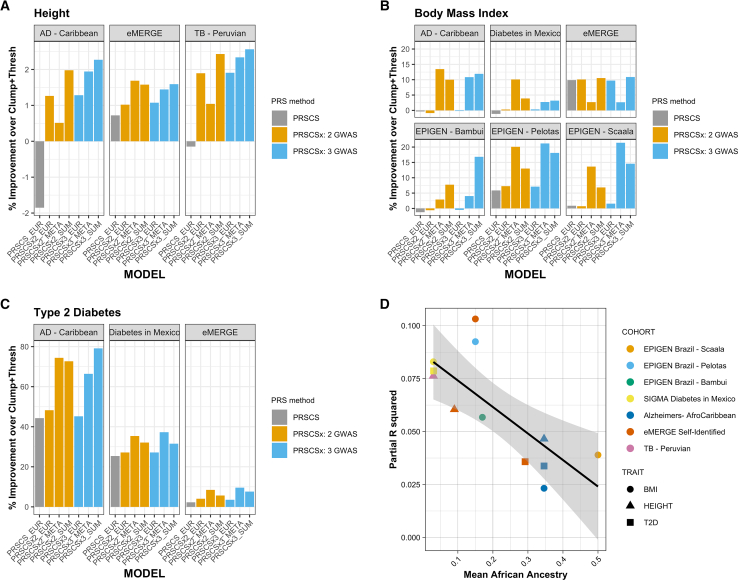
Latin Americans are underrepresented in genetic studies, increasing disparities in personalized genomic medicine. Despite available genetic data from thousands of Latin Americans, accessing and navigating the bureaucratic hurdles for consent or access remains challenging. To address this, we introduce the Genetics of Latin American Diversity (GLAD) Project, compiling genome-wide information from 53,738 Latin Americans across 39 studies representing 46 geographical regions. Through GLAD, we identified heterogeneous ancestry composition and recent gene flow across the Americas. Additionally, we developed GLAD-match, a simulated annealing-based algorithm, to match the genetic background of external samples to our database, sharing summary statistics (i.e., allele and haplotype frequencies) without transferring individual-level genotypes. Finally, we demonstrate the potential of GLAD as a critical resource for evaluating statistical genetic software in the presence of admixture. By providing this resource, we promote genomic research in Latin Americans and contribute to the promises of personalized medicine to more people.

Keywords: GLAD-match; GWAS; Latin America; identity-by-descent; imputation; local ancestry; migration; population structure.


Conflict of interest statement

Declaration of interests The authors declare no competing interests. D.P.L. is now an employee of AstraZeneca. This is unrelated to the work of this paper.

Figures

None
Graphical abstract
Figure 1
Figure 1
Dimensionality reduction of genetic data and ROH for more than 53,000 unrelated LAms from the GLAD database (A) Geographic distribution of GLADdb cohorts. Countries represented in GLADdb are highlighted with colors. (B) PCA of the entire dataset based on high-quality imputed SNPs (Rsq >0.9) showing the sampling spread of LAms. Principal components 2 and 5 were plotted to show the axis of genetic diversity that explains the European-African (EUR-AFR) differentiation (PC2) and the diversity of Indigenous American ancestries from Mexico to Peru (PC5). All principal components are plotted in Figure S9. (C) Distribution of genome-wide amount of ROHs for LAm groups and reference populations included in GLADdb. The upper part of the plot shows continental reference populations, and the lower part details the distribution in Peru and Brazil. Populations are sorted in a north-to-south pattern. This analysis was restricted to ROH segments >1 Mb. For patterns in ROH segments >8 Mb, see Figure S13. CEU, Utah residents with northern and western European ancestry from CEPH collection; ESN, Esan in Nigeria; EUR, European individuals; FIN, Finnish in Finland; GBR, British from England and Scotland; GWD, Gambian in Western Division-Mandinka; IBS, Iberian populations from Spain; LWK, Luhya in Webuye, Kenya; MSL, Mende in Sierra Leone; NAT, Indigenous American individuals; TSI, Toscani in Italia; USA HI, United States, Hawaii; USA NY, United States, New York; YRI, Yoruba in Ibadan, Nigeria.
Figure 2
Figure 2
Clustering of total IBD matrix of unrelated individuals from GLADdb (A) Heatmap of the square root of sample-pair total IBD shared among unrelated individuals sampled from LAm countries or the United States within GLADdb. Each pixel represents a pair of individuals; the x and y axes indicate individual IDs sorted by unsupervised hierarchical clustering. Annotations within the heatmap represent the most enriched geographic labels (countries or cities) in the indicated blocks. Labels with “USA-NY-country” correspond to self-described US-Hispanic living in New York with a specific country of origin. (B) Individual-level annotations for the heatmap. The annotations include (1) labels based on agglomerative clustering in the 1st vertical bar, (2) self-described ethnicity in the 2nd bar, and (3) sampling country (combined indicators in the 3rd bar and country-specific indicators in the 4th–14th bars). Each row in these bars corresponds to an individual. Note that the row orders in all label bars are shared with those of (A). (C) Frequency of labels (log scale) and color keys for agglomerative clustering (bottom), self-described ethnicity (center), and sample country (top), respectively. Note that the “NA” label refers to individuals not assigned any country, self-described ethnicity, or cluster.
Figure 3
Figure 3
IBD network community detection We infer the community structure using the Infomap algorithm based on a matrix of IBD segments >5 cM. (A) Top 20 IBD network communities. Only individuals with connections >30 are included in the layout calculation for visualization purposes. The community labels, such as CA1 and CA2, are named according to the IBD version used and the rank of the community sizes, with CA1 representing the largest community when using all IBD segments, including short (5–9.3 cM) and long (>9.3 cM) segments. (B) Average IBD sharing among the top 30 inferred communities (ordered by agglomerative clustering; the same order is followed in C and D). (C) Distribution of IBD shared among individuals in each community. (D) Enrichment of IBD community membership in the country of origin (i.e., proportions of community labels for individuals born in a given country). Note that for individuals without exact birth country information, broader geographic labels were used when available, such as Central America and South America. To visualize the dynamics before and after the Spanish colonization of the Americas, two different IBD networks were built based on IBD short (Figure S15) and long segments (Figure S16), respectively, which revealed distinct patterns of detected communities.
Figure 4
Figure 4
IBD analyses of Latin American groups We explored the relationship among LAm regions by inferring the average IBD shared among regions (A) and an asIBDscore for AFR (B), EUR (C), and IA ancestries (D). Dots represent LAm regions. Interregional sharing, including <5 pairs, was removed. For IBD sharing (right plot), we removed the intrapopulation sharing in Peru-Ica due to the higher sharing and to improve visualization (for full sharing patterns, see Figure S13).
Figure 5
Figure 5
Nearest-neighbor simulated annealing matching algorithm and results (A) Visual overview of the algorithm. (B) Comparison with baseline bipartite matching algorithm (x axis), where points below the line y = x indicate our algorithm outperforming the baseline (small box highlights high-density region). (C) Effect of a number of matches on improvement over the baseline.
Figure 6
Figure 6
PRS in select cohorts from GLAD-SD (A) Comparison of height model performance as percentage of improvement over a EUR-ancestry GWAS Clumping + Thresholding PRS. Models include PRS-CS using EUR-ancestry GWAS, PRS-CSx using EUR and East Asian-ancestry GWAS, and PRS-CSx using EUR, East Asian, and AFR-ancestry GWAS. All models were compared using the correlation between the prediction and the trait. (B) Comparison of BMI model performance. (C) Comparison of T2D model performance. (D) Total R2 of best PRS model by AFR ancestry. Cohorts are labeled by color; traits are labeled by shape. Partial R2 was calculated by squaring Pearson’s r followed by subtracting the full model (PRS + covariates) from the base model (covariates only, see STAR Methods). AFR ancestry proportions were estimated using ADMIXTURE.

References

    1. Manichaikul A., Palmas W., Rodriguez C.J., Peralta C.A., Divers J., Guo X., Chen W.-M., Wong Q., Williams K., Kerr K.F., et al. Population Structure of Hispanics in the United States: The Multi-Ethnic Study of Atherosclerosis. PLoS Genet. 2012;8 doi: 10.1371/journal.pgen.1002640. - DOI - PMC - PubMed
    1. Plecher H. Statista; 2019. Latin America - Statistics & Facts.https://www.statista.com/topics/3287/latin-america/
    1. Noe-Bustamante L., Hugo Lopez M., Manuel Krogstad J. Pew Res. Cent. US Hisp. Popul. Surpassed 60 Million 2019 Growth Has Slowed. 2020. U.S. Hispanic population surpassed 60 million in 2019, but growth has slowed.https://www.pewresearch.org/fact-tank/2020/07/07/u-s-hispanic-population...
    1. Mills M.C., Rahal C. The GWAS Diversity Monitor tracks diversity by disease in real time. Nat. Genet. 2020;52:242–243. doi: 10.1038/s41588-020-0580-y. - DOI - PubMed
    1. Taliun D., Harris D.N., Kessler M.D., Carlson J., Szpiech Z.A., Torres R., Taliun S.A.G., Corvelo A., Gogarten S.M., Kang H.M., et al. Sequencing of 53,831 diverse genomes from the NHLBI TOPMed Program. Nature. 2021;590:290–299. - PMC - PubMed