Clinical Trial
. 2024 Nov 11;42(11):1898-1918.e12.
doi: 10.1016/j.ccell.2024.10.007. Epub 2024 Oct 31.

Neoadjuvant vidutolimod and nivolumab in high-risk resectable melanoma: A prospective phase II trial

Affiliations
Clinical Trial

Neoadjuvant vidutolimod and nivolumab in high-risk resectable melanoma: A prospective phase II trial

Diwakar Davar et al. Cancer Cell. .

Abstract

Intratumoral TLR9 agonists and anti-PD-1 produce clinical responses and broad immune activation. We conducted a single-arm study of neoadjuvant TLR9 agonist vidutolimod combined with anti-PD-1 nivolumab in high-risk resectable melanoma. In 31 evaluable patients, 55% major pathologic response (MPR) was observed, meeting primary endpoint. MPR was associated with necrosis, and melanophagocytosis with increased CD8+ tumor-infiltrating lymphocytes and plasmacytoid dendritic cells (pDCs) in the tumor microenvironment, and increased frequencies of Ki67+CD8+ T cells peripherally. MPRs had an enriched pre-treatment gene signature of myeloid cells, and response to therapy was associated with gene signatures of immune cells, pDCs, phagocytosis, and macrophage activation. MPRs gut microbiota were enriched for Gram-negative bacteria belonging to the Bacteroidaceae and Enterobacteriaceae families and the small subgroup of Gram-negative Firmicutes. Our findings support that combined vidutolimod and nivolumab stimulates a broad anti-tumor immune response and is associated with distinct baseline myeloid gene signature and gut microbiota. ClinicalTrials.gov identifier: NCT03618641.

Keywords: ICI; PD-1; TLR9; immunotherapy; innate agonist; macrophage; melanoma; neoadjuvant; pDC; vidutolimod.


Conflict of interest statement

Declaration of interests D.D. reports grants/research support (NIH/NCI and Checkmate Pharmaceuticals) and consulting (Checkmate Pharmaceuticals) during the conduct of the study. D.D. also reports grants/research support (Arcus, Immunocore, Merck, Regeneron Pharmaceuticals Inc., Tesaro/GSK.), consulting (ACM Bio, Ascendis, Castle, Clinical Care Options [CCO], Gerson Lehrman Group [GLG], Immunitas, Medical Learning Group [MLG], Replimmune, Trisalus, Xilio Therapeutics), speakers’ bureau (Castle Biosciences), steering committee membership (Immunocore, Replimmune) and patents related to gut microbial signatures of response and toxicity to immune checkpoint blockade (US Patent 63/124,231 and US Patent 63/208,719) outside the submitted work. P.D. is currently employed by Nanostring Technologies and reports stock options. Y.G.N. reports grants/research support (Bristol-Myers Squibb, Merck Sharp & Dohme and Pfizer) and consulting (Checkmate Pharmaceuticals) outside the submitted work. J.J.L. reports grants/research support (multiple), membership on data safety monitoring boards (multiple), membership on scientific advisory boards with no stock ownership or stock options (multiple), membership on scientific advisory boards with stock for (multiple), consulting (multiple) and a provisional patent for cancer immunotherapy (PCT/US18/36052: Microbiome Biomarkers for anti-PD-1/PD-L1 responsiveness: diagnostic, prognostic and therapeutic uses thereof) all outside the submitted work. D.M. is currently employed by Codiak Biosciences and reports stock options. D.B., J.W. and A.K. were formerly employed by CheckMate and report stock options. M.G.F. is currently employed by Regeneron Pharmaceuticals Inc. and reports stock options. J.M.K. reports grants/research support (Bristol-Myers Squibb, Amgen Inc.) and consulting (Bristol-Myers Squibb, Checkmate Pharmaceuticals, Novartis, Amgen Inc., Checkmate, Castle Biosciences, Inc., Immunocore LLC, Iovance, Novartis.) outside the submitted work. J.M.T. reports grants and consulting from Bristol-Myers Squibb, Merck Sharp & Dohme, Astra Zeneca, and Compugen outside the submitted work. H.M.Z. reports grants/research support (NIH/NCI and Checkmate Pharmaceuticals) and consulting (Checkmate Pharmaceuticals) during the conduct of the study. H.M.Z. also reports grants/research support (NIH/NCI, Bristol-Myers Squibb and GlaxoSmithKline), personal fees (GlaxoSmithKline, Bayer, and Vedanta) and pending provisional patents related to gut microbial signatures of response and toxicity to immune checkpoint blockade (US Patent 63/124,231 and US Patent 63/208,719) outside the submitted work.

Figures

Figure 1 ∣
Figure 1 ∣. Pathologic response predicts RFS, DMFS and OS in high-risk resectable melanoma treated with neoadjuvant vidutolimod (vidu) and nivolumab (nivo).
A. Clinical trial schema. B. Distribution of pathological response to neoadjuvant vidu/nivo based on residual viable tumor (%RVT) assessed using immune-related pathologic response criteria-. C. Waterfall plots of RECIST v1.1 assessed ORR along with pathologic response in ITT population (n = 31) wherein dotted line marks threshold for partial response. One patient (UOP-029) had distant progression precluding surgery. D, E and F. Kaplan–Meier estimates of recurrence free survival (RFS) (D), distant metastasis-free survival (DMFS) (E), and overall survival (OS) (F) of treated patients by two-sided log rank test are shown for intention-to-treat (ITT) population (n = 31). Pathologic response is dichotomized into major pathologic response (MPR), comprising pathologic complete response (pCR, 0% RVT) and pathologic major response (pMR, <10% RVT), and non-MPR, comprising pathologic partial response (pPR, 10%–50% RVT), and pathologic non-response (pNR, >50% RVT), denoted separately (MPR, solid blue line; non-MPR dashed red line). RFS was defined as time in months from initiation of therapy to date of relapse (or last follow-up); DMFS was defined as time in months from initiation of therapy to the date of distant metastasis (or last follow-up); and OS was defined as time in months from initiation of therapy to date of death (or last follow-up). See also Figure S1, Tables S1-S4 and Star Methods.
Figure 2 ∣
Figure 2 ∣. Response to neoadjuvant vidu/nivo results in CD8+ T cell accumulation and pDC activation within tumor.
A. Representative pre- and post-treatment images of histopathologic features from four separate patients with pathologic response, including tertiary lymphoid structure (TLS) formation (top left), melanophagocytosis (top right), necrosis (bottom left) and response in injected and non-injected lesions (bottom right). B. Distribution of select histopathologic features shown in (A) in MPR and non-MPR tumors (n=30). The box plots depict the distribution of the values, wherein horizontal lines represent the median, top and bottom ends represent the upper and lower quartiles respectively, and the whiskers extend from the highest to the lowest values. Two-sided P values comparing respective histopathologic features between MPR and non-MPR are from Mann-Whitney U rank-sum test. C. Representative images of MPR tumors stained by NanoString GeoMx Digital Spatial Profile based multiplex immunofluorescence (mIF) using antibodies against CD45 (immune cells, yellow), CD303 (pDCs, red), and PMEL17 (melanoma, green), in combination with SYTO13 nuclear staining (blue). Selected cases with representative histopathologic features shown in (A) including necrosis (UOP-011, top left), melanophagocytosis (UOP-004, top right), and proliferative fibrosis (UOP-007, bottom) demonstrate CD45+ immune cell and CD303+ pDC infiltrates. Insets depict high-magnification images demonstrating co-localization of CD45+ immune cells and CD303+ pDCs. D and E. Comparison of CD45+ immune cell density between MPRs and non-MPRs, in tumor (left) and stromal (right) compartments, respectively (n=15). E. Comparison of CD303+ pDC cell density between MPRs and non-MPRs, in tumor (left) and stromal (right) compartments, respectively (n=18). The box plots depict the distribution of the values, wherein horizontal lines represent the median, top and bottom ends represent the upper and lower quartiles respectively, and the whiskers extend from the highest to the lowest values. Two-sided P values comparing cell densities are from Wilcoxon signed-rank test (D. and E.). See also Figures S1 and S2 and Tables S3 and S5.
Figure 3 ∣
Figure 3 ∣. Spatial transcriptomic (ST) signatures of neoadjuvant vidu/nivo.
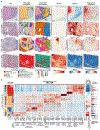
A. Visium FFPE ST from four representative post-treatment cases [n = 2 major pathologic response (MPR) and 2 non-MPR]. Each column displays different features of the four cases, one per row. The first and second columns display the H&E images from the tissue slice used for ST (first column), and with manual pathologic annotation (second column). Column three shows the 14 clusters generated from Louvain clustering of the ST spots based on normalized gene expression. Column four shows log norm expression of MLANA. Columns five and six show the module scores for myeloid and phagocytosis engulfment, respectively. B. Heatmap of gene expression for each of the 14 Visium RNA spot clusters. The top 12 genes based on decreasing log2 Fold Change (FC) from each cluster are displayed. One or two significant GO:BP terms were selected from pathway enrichment results of each gene set and are displayed below the gene labels. To the left of the heatmap is a bar plot of the proportion of spots in each cluster covered by each pathologist annotation. To the right of the gene expression heatmap is a heatmap of median module scores for myeloid cells, macrophage activation, and phagocytosis engulfment. The rightmost part of the panel shows the proportion of spots covered by each cluster, segregated by response. See also Table S6.
Figure 4 ∣
Figure 4 ∣. Myeloid and tertiary lymphoid structure (TLS) spatial transcriptomic (ST) signatures of neoadjuvant vidu/nivo.
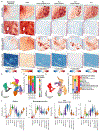
A. Each column contains additional features from the four representative post-treatment ST cases from Figure 3. The first column displays the module score for macrophage activation. Column two shows ln natural log (ln) normalized expression of CD68. Columns three, four, and five show the TLS module scores generated from the highest expressing genes of Visium clusters 3 and 4 combined, cluster 3 only, and cluster 4 only, respectively. The sixth column shows the module score for a previously identified 9 gene signatures of TLS. B. UMAP dimensionality reduction plot of all ST spots, colored by Visium RNA spot cluster. C. Bar plot of the proportion of slide area covered by each Visium RNA spot cluster per patient. D-E. Same as B. and C. respectively, but by pathologist annotation. F. Violin plot of module score expression per pathologist annotation for myeloid, macrophage activation, TLS Visium clusters 3 and 4, and 9 gene signatures of TLS. See also Table S6.
Figure 5 ∣
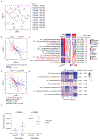
Figure 5 ∣. Transcriptional signatures of response to neoadjuvant vidu/nivo within tumors.
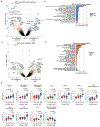
A. Volcano plot depicting differentially expressed genes (DEGs) by major pathologic response (MPR) vs. non-response (non-MPR) in post-treatment tumors [∣log2 Fold Change (FC)∣ >2 and adjusted P value < 0.01] (n = 16 MPR; 13 non-MPR). Adjusted P values were calculated by the wald test followed by Benjamini & Hochberg FDR method. B. Gene Ontology Biological Process (GO:BP) enrichment analysis of DEGs in (a), manually curated to collapse similar terms and ordered by adjusted P value. Adjusted P values were calculated using Fisher’s one-tailed test followed by g:SCS method. C. Volcano plot of DEGs by post- vs. pre- treatment tumors from MPR [∣log2 FC∣ > 2 and adjusted P value < 0.01] (n = 16 pre; 16 post). Adjusted P values were calculated by the wald test followed by Benjamini & Hochberg FDR method. D. GO:BP enrichment analysis of DEGs in (c), manually curated to collapse similar terms and ordered by adjusted P-value. Adjusted P values were calculated using Fisher’s one-tailed test followed by g:SCS method. E. Module scores of myeloid cells, pDCs, CD8+ T cells, and CD4+ T follicular helper (Tfh) cells, as well as module scores for enriched biological processes of macrophage activation, phagocytosis engulfment, and neuron projection morphogenesis. Also included are three modules of tertiary lymphoid structures derived from the top expressing genes of Visium ST clusters 3 and/or 4, and a previously identified 9 gene signatures of TLS. P values for the comparison of module scores between conditions were calculated using two-sided Wilcoxon rank-sum test (n = 13 non-MPR pre, 13 non-MPR post, 16 MPR pre, 16 MPR post). Box plots display the median, two hinges (25th and 75th percentiles), and two whiskers [smallest and largest values no further than 1.5 times the inter-quartile range (25th to 75th percentiles) from the hinges]. See also Figures S2, S3 and S4, Tables S7 and S8.
Figure 6 ∣
Figure 6 ∣. Peripheral immune monitoring reveals increased T cells and APC activation in major pathologic responders (MPRs) following neoadjuvant vidu/nivo.
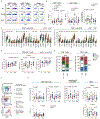
A. Representative dot plots showing Ki67 expression in CD8+, CD4+, and regulatory T cells (Tregs) in a major pathologic responder (MPR) and non-responder (non-MPR) at day 1 (D1), day 14 (D14), and day 42 (D42) of treatment. B. Dot plots comparing frequency of Ki67 expression in CD8+ or CD4+ T cells at D1, D14, and D42 of treatment (left and middle, n = 15 MPR, 11 non-MPR D1-D14-D42 pairs) as well as the fold change of Ki67+ cell frequency between D14 and D1 of treatment for CD8+, CD4+, and Tregs (right, n = 16 MPR, 12 non-MPR) between MPR and non-MPR. Horizontal bars represent medians. P values were obtained from two-tailed Mann-Whitney tests between MPR and non-MPR and Friedman test with Dunn’s multiple tests between time-points. P values < 0.100 are labeled. C. Dot plots comparing expression frequencies of selected markers by Ki67+ and Ki67 CD8+ T cells or CD4+ T cells at D14. P values were obtained from two-tailed Wilcoxon matched-pairs signed rank test (n = 28 pairs): *, P < 0.05; **, P < 0.01; ***, P < 0.001; ****, P < 0.0001. D. Dot plot comparing expression frequencies of selected markers in Ki67+ CD8+ T cells between MPR (n = 16 D1, D14; 15 D42) and non-MPR (n = 12 D1, D14; 11 D42) at D1, D14, and D42 of treatment. Horizontal bars depict medians. P values were obtained from two-tailed Mann-Whitney tests between MPR and non-MPR. P values < 0.100 are labeled. E. Stacked bar plots showing the average frequencies of CD45RACCR7 effector memory (EM), CD45RA+CCR7 terminal effector memory (TEMRA), CD45RA+CCR7+ naïve, and CD45RACCR7+ central memory (CM) cells within Ki67+ and Ki67 CD8+ T cells or CD4+ T cells in all patients at D14 of treatment. P values were obtained by Wilcoxon matched-pairs signed rank tests (n = 28 pairs): *, P < 0.05; ****, P < 0.0001. F. Gating strategy for antigen presenting cell subsets within side-scatter high (SSChi) CD3 live cells. G-I. Dot plots of cell frequencies for selected cell subsets (G) and expression of selected markers in non-classical monocytes (H) and pDCs (I) comparing MPR (n = 16 D1, D14; 15 D42) and non-MPR (n = 12 D1, D14; 11 D42) at D1, D14, and D42 of treatment. Horizontal bars indicate medians. P values were obtained from two-tailed Mann-Whitney tests between MPR and non-MPR. P values < 0.100 are labeled. See also Figures S5 and S6.
Figure 7 ∣
Figure 7 ∣. Gut microbiome signatures of response to neoadjuvant vidu/nivo.
A. Bray-Curtis t-distributed uniform manifold approximation and projection (tUMAP) ordination plot of last known taxa (LKT) in stool samples of patients treated with neoadjuvant vidu/nivo (n = 29). Each letter indicates a unique vidu/nivo treated patient, and corresponding study IDs are shown on the right. Samples from different timepoints for the same patient are indicated by the same letter connected by grey lines. One patient (UOP-012) whose samples evidenced a bloom of Candida spp. associated with antibiotic therapy was excluded from this and subsequent analyses. B. Bray-Curtis t-UMAP ordination plot depicting fecal microbiota compositional differences between pathologic responders (MPR) and non-responders (non-MPR) at an intermediate post-vidu/nivo, pre-surgery timepoint [one sample from each patient at week 2 (n = 23); or first available sample after vidu/nivo (week 6, n = 5) if no week 2; or Pre-treatment (Pre) if those timepoints are unavailable (n = 1); total n = 29]. Closed circles represent the average point (centroid), with connecting lines corresponding to samples from each group. Two-tailed P value was calculated using PERMANOVA. C. Heatmap showing LKTs with differential abundance between patients with different MPR status at the intermediate post-vidu, pre-surgery timepoint. Columns denote patients grouped by and clustered within MPR status. Clinical relapse is indicated below pathological response (relapse – red; no relapse – blue). Rows denote LKTs enriched (black font) or depleted (red font) in MPR versus non-MPR patients (two-tailed Mann–Whitney U test; P value < 0.05), clustered based on microbiota composition. The row annotations show the phylum and Gram staining annotations of the LKTs. D. Bray-Curtis tUMAP ordination plot of LKT in the stool samples of patients binned into four pre-surgical timepoints [Pre, week 2, week 6, week 12]. Closed circles represent the average point (centroid) of each patient group, with lines connecting to the centroids of the time binned samples of each patient. Two-way PERMANOVA showed statistically significant differences in the overall microbial community due to MPR status (P value = 0.001) but not for time difference (P value = 0.286) or for interaction MPR status vs time (P value = 0.980). E. Heatmap of the LKTs that differed between MPR and non-MPR patients at the four timepoints. The color and intensity of the cells indicates the direction and magnitude of fold change in LKT abundance due to MPR status. The numbers within each cell indicate the two-tailed Mann–Whitney U test P value comparing LKT abundance between MPR status at that timepoint. Fisher’s method was used to combine the Mann–Whitney U test P values from the different timepoints followed by Benjamini and Hochberg adjusted P value calculation. Depicted LKTs had the same direction of fold-change in all four timepoints, combined Fisher’s P value < 0.05 and adjusted P value < 0.25. F. Boxplots showing the differential abundance (in ppm) of Gram-negative (left panel) and Gram-positive (right panel) bacteria between patients with different MPR status at the intermediate post-vidu/nivo, pre-surgery timepoint (n = 29; two-tailed Mann–Whitney U test). The box plots depict the distribution of the relative abundances of all Gram-negative or Gram-positive species by MPR status, wherein horizontal lines represent the median, top and bottom ends represent the 25th and 75th centiles respectively, and the whiskers extend from the smallest and largest values no further than 1.5 times the inter-quartile range. See also Table S9.
Figure 8 ∣
Figure 8 ∣. Gut microbiota signatures associated with MPR to neoadjuvant vidu/nivo.
A. Interactive Tree of Life (iTOL) diagram summarizing linear discriminant analysis effect size (LEfSe) comparisons at four timepoints in the neoadjuvant vidu/nivo cohort and of five independent pooled cohorts of advanced melanoma patients treated with anti-PD-1 and reanalyzed using updated metadata. The phylogenetic tree was generated from NCBI’s Common Tree using only taxa significant in at least one of the LEfSe comparisons. External heatmaps and internal pie-charts represents the species (leaves) and collapsed higher-level taxa (internal nodes), respectively, that are significant (two-tailed Mann–Whitney U test P value < 0.10) in LEfSe analyses of the neoadjuvant vidu/nivo cohort. Gram staining (negative – pink and positive – magenta) of the represented last known taxa (LKTs) are shown outside the species annotations of the leaves. While the heatmap in the interior annulus shows the specific timepoints at which a taxon was significant, pie charts only show the total number of timepoints at which the taxon was significant (MPR – blue; non-MPR – red; not significant – white). The outermost bar plot in the exterior ring represents the species that are significant in the LEfSe analyses of the anti-PD-1 pooled dataset using a two-tailed Mann–Whitney U test (P value < 0.05). Certain clades are colored and labeled for readers’ convenience. An inset of the first two branches from the top part of the iTOL diagram is used as an example to describe the legend on the right side. B. Bray-Curtis tUMAP ordination plots of Products, Gene Ontology, InterPro and EC numbers depicting fecal microbiota differences between MPR and non-MPR from the intermediate post-vidu/nivo, pre-surgery timepoint. Two-tailed P values were calculated using PERMANOVA. See also Figures S7-S13 and Table S9.

References

    1. Weber J, Mandala M, Del Vecchio M, Gogas HJ, Arance AM, Cowey CL, Dalle S, Schenker M, Chiarion-Sileni V, Marquez-Rodas I, et al. (2017). Adjuvant Nivolumab versus Ipilimumab in Resected Stage III or IV Melanoma. N Engl J Med 377, 1824–1835. 10.1056/NEJMoa1709030. - DOI - PubMed
    1. Eggermont AMM, Blank CU, Mandala M, Long GV, Atkinson V, Dalle S, Haydon A, Lichinitser M, Khattak A, Carlino MS, et al. (2018). Adjuvant Pembrolizumab versus Placebo in Resected Stage III Melanoma. N Engl J Med 378, 1789–1801. 10.1056/NEJMoa1802357. - DOI - PubMed
    1. Eggermont AMM, Blank CU, Mandala M, Long GV, Atkinson VG, Dalle S, Haydon AM, Meshcheryakov A, Khattak A, Carlino MS, et al. (2021). Adjuvant pembrolizumab versus placebo in resected stage III melanoma (EORTC 1325-MG/KEYNOTE-054): distant metastasis-free survival results from a double-blind, randomised, controlled, phase 3 trial. Lancet Oncol 22, 643–654. 10.1016/S1470-2045(21)00065-6. - DOI - PubMed
    1. Huang AC, Orlowski RJ, Xu X, Mick R, George SM, Yan PK, Manne S, Kraya AA, Wubbenhorst B, Dorfman L, et al. (2019). A single dose of neoadjuvant PD-1 blockade predicts clinical outcomes in resectable melanoma. Nat Med 25, 454–461. 10.1038/s41591-019-0357-y. - DOI - PMC - PubMed
    1. Amaria RN, Reddy SM, Tawbi HA, Davies MA, Ross MI, Glitza IC, Cormier JN, Lewis C, Hwu WJ, Hanna E, et al. (2018). Neoadjuvant immune checkpoint blockade in high-risk resectable melanoma. Nat Med 24, 1649–1654. 10.1038/s41591-018-0197-1. - DOI - PMC - PubMed

Publication types

MeSH terms

Associated data