. 2024 Nov:202:106722.
doi: 10.1016/j.nbd.2024.106722. Epub 2024 Oct 30.

Neonatal hypoxia-ischemia alters the events governing the hippocampal critical period of postnatal synaptic plasticity leading to deficits in working memory in mice

Affiliations

Neonatal hypoxia-ischemia alters the events governing the hippocampal critical period of postnatal synaptic plasticity leading to deficits in working memory in mice

Pritika Parmar et al. Neurobiol Dis. 2024 Nov.

Abstract

Postnatal critical periods of synaptic plasticity (CPsp) are characterized by profound neural network refinement, which is shaped by synaptic activity and sculpted by maturation of the GABAergic network. Even after therapeutic hypothermia (TH), neonatal hypoxia-ischemia (HI) impairs two triggers for the initiation of the CPsp in the hippocampus: i) PSA-NCAM developmental decline and ii) parvalbumin (PV) + interneuron (IN) maturation. Thus, we investigated whether neonatal HI despite TH disturbs other events governing the onset, consolidation and closure of the postnatal CPsp in the hippocampus. We induced cerebral HI in P10 C57BL6 mice with right carotid ligation and 45 m of hypoxia (FiO2 = 0.08), followed by normothermia (36 °C, NT) or TH (31 °C) for 4 h with anesthesia-exposed shams as controls. ELISA, immunoblotting and immunohistochemistry were performed at 24 h (P11), 5 days (P15), 8 days (P18) and 30 days (P40) after HI injury. We specifically assessed: i) BDNF levels and TrkB activation, controlling the CPsp, ii) Otx2 and NPTX2 immunoreactivity (IR), engaging CPsp onset and iii) NogoR1, Lynx1 IR, PNN formation and myelination (MBP) mediating CPsp closure. Pups aged to P40 also received a battery of tests assessing working memory. Here, we documented deficits in hippocampal BDNF levels and TrkB activation at P18 in response to neonatal HI even with TH. Neonatal HI impaired in the CA1 the developmental increase in PV, Otx2, and NPTX2 between P11 and P18, the colocalization of Otx2 and PV at P18 and P40, the accumulation of NPTX2 in PV+ dendrites at P18 and P40, and the expression of NogoR at P40. Furthermore, neonatal HI decreased BDNF and impaired PNN development and myelination (MBP) at P40. Most of these abnormalities were insensitive to TH and correlated with memory deficits. Neonatal HI appears to disrupt many of the molecular and structural events initiating and consolidating the postnatal hippocampal CPsp, perhaps due to the early and delayed deficits in TrkB activation leading to memory deficits.

Keywords: CA1; Interneurons; Memory; Neonatal hypoxia-ischemia; Parvalbumin; Synaptic plasticity; hippocampus.


Conflict of interest statement

Declaration of competing interest The authors declare the following financial interests/personal relationships which may be considered as potential competing interests: Raul Chavez-Valdez reports financial support was provided by National Institutes of Health. Raul Chavez-Valdez reports financial support was provided by Thomas Wilson Sanitarium for Children of Baltimore City. If there are other authors, they declare that they have no known competing financial interests or personal relationships that could have appeared to influence the work reported in this paper.

Figures

Fig. 1.
Fig. 1.. General Methods Diagram.
(A) C57BL6 mice received isoflurane for anesthesia to be either treated as a control sham or receive carotid artery ligation and hypoxia for 45 min (FiO2 0.08) and then randomized to normothermia (NT, 36 °C) or hypothermia (TH, 36 °C) for 4 h. Pups were killed at P11, P15, P18 or P40 for either hippocampal microdissection or 4 % PFA brain perfusion and coronal sectioning using a freezing microtome. (B) Hippocampus was homogenized with sonication, prior to clarification and aliquot was collected to run GFAP, α-fodrin and validation experiments. Following clarification, supernatant was used for BDNF ELISA and pellet was used for TrkB WBS. (C) Following sectioning of perfused and cryoprotected brains in 50 μm-thick sections, 2 sections 600 μm apart with embedded dorsal hippocampus, were used for staining and evaluation under confocal microscopy in two contiguous high magnification z-stacks in the CA1 and CA3 subfields.
Fig. 2.
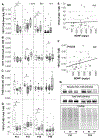
Fig. 2.. Neonatal HI Decreases BDNF levels in Hippocampus at P18 and P40.
Hybrid box and whiskers with column scatter plots represent the distribution of (A) the BDNF levels (pg/g of protein) (B1 & B2) α-fodrin 150 kDa and 120 kDa breakdown products relative to 250 kDa total and (D1) GFAP fold change relative to sham, for sham (white), NT (dark grey) and TH (light grey) at P11, P15, P18 and P40. *, p = 0.05 vs. sham (KW ANOVA with Dunn-Bonferroni post hoc). Representative blots with loading control showed for α-fodrin (B) and GFAP (D2). Scatter plot with best-fit-curve represent (C) α-fodrin 150/250 kDa (x-axis) vs. BDNF level (y-axis) and (E) GFAP fold-change (x-axis) vs. BDNF level (y-axis). Best-fit regression line is depicted in continuous black line and 95 % CI limits by discontinuous lines. BDNF, brain derived neurotrophic factor; NT, normothermia; S, Sham; TH, Therapeutic hypothermia.
Fig. 3.
Fig. 3.. Neonatal HI Decreases TrkB phosphorylation.
Hybrid box and whiskers with column scatter plots represent the distribution of (A) Y515 trkB, (B) Y817 trkB, (C) TrkB and (D) Y515/total TrkB ODs adjusted to loading for sham (white), NT (dark grey) and TH (light grey) at P11, P15, P18 and P40. *, p = 0.05 vs. sham (KW ANOVA with Dunn-Bonferroni post hoc). (G) Representative blots with loading control showed for Y515 TrkB and TrkB. Scatter plot with best-fit-curve represent BDNF level (x-axis) vs. Y515 TrkB (y-axis) at (E) P11 and (F) P18 BDNF, brain derived neurotrophic factor; NS, Non-significant; NT, normothermia; Phospho, phosphorylated; S, Sham; TH, Therapeutic hypothermia; TrkB, Tropomyosin receptor kinase B.
Fig. 4.
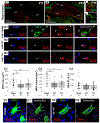
Fig. 4.. Decreased Otx2 in PV+ INs after Neonatal HI.
Representative renderings from Z-stacks obtained from multi-channel IF-IHC of hippocampal CA1 pyramidal cell layer for sham at P11 (A), P15 (B) and P18 (C) and HI injured P15 (D) and P18 (E). Nucleus are stained with DAPI shown in blue (A1 to E1), PV + INs shown in green (A2 to E2), Otx2 shown in red (A3 to E3) and merged field (A4 to E4). Total Otx2 expression (F1) and number of Otx2 + nuclei (overlapping with DAPI) within the ROI (F2) are presented in hybrid box and whiskers with vertical dot plots for sham (white), NT (dark grey) TH (light grey) at P15. KW ANOVA with Dunn-Bonferroni post hoc was used for analysis. *, p-value <0.05 CA, Cornu Ammonis; IHC, immunohistochemistry; IF, immunofluorescence; IN, interneurons; HI, hypoxia-ischemia; PV, Parvalbumin. (For interpretation of the references to colour in this figure legend, the reader is referred to the web version of this article.)
Fig. 5.
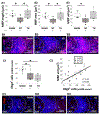
Fig. 5.. Impaired PNN formation after Neonatal HI.
Representative renderings from Z-stacks obtained from multi-channel IF-IHC of the hippocampus for sham at P11 (A1) and P40 (A2) stained with PV (red channel) and WFA (green channel) with details in islets a and a’. Renderings for WFA and OTx2 multichannel-IF-IHC at P40 shown in (B) with DAPI shown in blue, WFA in green, Otx2 in red and lastly merge field for Sham (B1), NT (B2) and TH (B3). Hybrid box and whiskers with column scatter plots represent the distribution of (C1) WFA area (μm2), (C2) WFA volume (μm3) and (C3) WFA IF (arbitrary units, A.U.). *, p = 0.05 vs. sham (KW ANOVA with Dunn-Bonferroni post hoc). High magnification 3D-rendering demonstrating Wisteria floribunda lectin isolated PNNs for P40 Sham (D1) HI/NT (D2) with Imaris reconstructions in D1’ and D2’. IHC, immunohistochemistry; IF, immunofluorescence; IN, interneurons; HI, hypoxia-ischemia; NT, normothermia, PV, Parvalbumin, TH, therapeutic hypothermia; WFA, Wisteria floribunda lectin. (For interpretation of the references to colour in this figure legend, the reader is referred to the web version of this article.)
Fig. 6.
Fig. 6.. NPTX2 abundance is decreased by neonatal HI and TH.
Representative renderings from Z-stacks obtained from multi-channel IF-IHC of hippocampal CA1 pyramidal cell layer for sham at P11 (A), P18 (C) and P40 (E) and HI injured P11 (B), P18 (D) and P40 (F). Nucleus are stained with DAPI shown in blue channel, PV+ INs shown in green channel, NPTX2 shown in red channel and merged fields. Orthogonal view demonstrate the reduced PV and NPTX2 co-localization in HI vs. sham at P18 (G). Hybrid box and whiskers with column scatter plots represent the distribution of (H1) NPTX2 IF (A.U.) and (H2) NPTX2 + buttons area (μm2) *, p = 0.05 vs. sham (KW ANOVA with Dunn-Bonferroni post hoc). (H3) High magnification rendering demonstrating NPTX2 buttons at P40 in Sham (H3’) HI/NT (H3”). CA, Cornu Ammonis; IHC, immunohistoehemistry; IF, immunofluorescence; HI, hypoxia-ischemia; NT, normothermia; PV, Parvalbumin; TH, therapeutic hypothermia. (For interpretation of the references to colour in this figure legend, the reader is referred to the web version of this article.)
Fig. 7.
Fig. 7.. NOGOR1 is decreased by neonatal HI and TH.
Representative renderings from Z-stacks obtained from multi-channel IF-IHC of hippocampal CA1 pyramidal cell layer for sham at P18 (A) and P40 (B) and HI/NT (C) and HI/TH (D) at P40. Nucleus are stained with DAPI shown in blue channel, PV+ INs shown in green channel, NogoR1 shown in red channel and merged fields. High magnification rendering demonstrating NogoR1 abundance around PV+ INs at P40 in Sham (b’) HI/NT (b”). Hybrid box and whiskers with column scatter plots represent the distribution of NogoR1 IF (A.U) (E); *, p < 0.05 vs. sham (KW ANOVA with Dunn-Bonferroni post hoc). A.U., Arbitrary unit; CA, Cornu Ammonis; IHC, immunohistochemistry; IF, immunofluorescence; HI, hypoxia-ischemia; NT, normothermia; PV, Parvalbumin; TH, therapeutic hypothermia. (For interpretation of the references to colour in this figure legend, the reader is referred to the web version of this article.)
Fig. 8.
Fig. 8.. Lynx1 abundance is unchanged after HI.
Representative renderings from Z-stacks obtained from multi-channel IF-IHC of hippocampal CA1 pyramidal cell layer for sham at P18 (A1) and P40 (A2) and HI injured HI/NT (B) and HI/TH (C) at P40. Nucleus are stained with DAPI shown in blue channel, PV+ INs shown in green channel, Lynx1 shown in red channel and merged field. Abundance of Lynx1 in sham animals at P18 vs. P40 (A3) and between sham (white) NT (dark grey) and TH (light grey) at P40 (D) are shown in Hybrid box and whiskers with column scatter plots. *, p < 0.05 vs. sham (KW ANOVA with Dunn-Bonferroni post hoc). CA, Cornu Ammonis; IHC, immunohistochemistry; IF, immunofluorescence; IN, interneurons; HI, hypoxia-ischemia; NT, nomothermia; PV, Parvalbumin; TH, therapeutic hypothermia. (For interpretation of the references to colour in this figure legend, the reader is referred to the web version of this article.)
Fig. 9.
Fig. 9.. Neonatal HI Decreases MBP + Filament Length, Area and Volume and TH Attenuates Change at P40.
Hybrid box and whiskers with column scatter plots represent the distribution of (A1) MBP + filament length, (A2) MBP + area (μm2) and (A3) MBP + volume (μm3) for sham (white), NT (dark grey) and TH (light grey) at P40. *, p = 0.05 vs. sham (KW ANOVA with Dunn-Bonferroni post hoc). High magnification 3D-rendering from using Imaris software demonstrate MBP + filaments shown within the CA3 of sham (B1), HI/NT (B2) and HI/TH (B3). Similar as above hybrid box and whiskers with column scatter plots represent the distribution of Olig2 + nuclei cells counts adjusted per 103 DAPI+ nuclei for sham (white), NT (dark grey) and TH (light grey) at P40 (C1). *, p = 0.05 vs. sham (KW ANOVA with Dunn-Bonferroni post hoc). Scatter plot of Olig2 nuclei count per 103 cells (x-axis) vs. MBP + volume (μm3) demonstrate a best-fit line shown with 95 %CI mark by discontinue lines (C2). High magnification 3D-rendering from using Imaris software demonstrate Olig2 + nuclei shown within the CA3 of sham (D1), HI/NT (D2) and HI/TH (D3). CA, Cornu Ammonis MBP, Meylin basic protein, NT, normothermia, (μm3), Or, Oriens layer, Py, Pyramidal cell layer; Rd, Radiatum layer; TH, therapeutic hypothermia, Vol, volume.
Fig. 10.
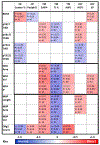
Fig. 10.. Spearman Correlations between BDNF, TrkB phosphorylation, PNN formation or Myelination with Behavioral Testing Performance.
BDNF, phosphorylation of Y515 or Y817 TrkB sites, WFA (PNN) area, volume and immunofluorescence, MBP (myelin) length, area and volume or Olig2+ nuclei x 1000 cells were correlated with behavioral performance in open field (OF), Y-maze talk (YM) or Object Locations Task (OLT) using Spearman Rho method (non-parametric). Red represent direct relationship (same directionality, positive Rho coefficient [r]) and blue represents (opposite directions, negative Rho coefficient). White areas represent no correlation using a threshold p-value of >0.10. (For interpretation of the references to colour in this figure legend, the reader is referred to the web version of this article.)

References

    1. Akbik F, et al., 2012. Myelin associated inhibitors: a link between injury-induced and experience-dependent plasticity. Exp. Neurol 235, 43–52. - PMC - PubMed
    1. Akbik FV, et al., 2013. Anatomical plasticity of adult brain is titrated by Nogo receptor 1. Neuron 77, 859–866. - PMC - PubMed
    1. Alberini CM, Travaglia A, 2017. Infantile amnesia: a critical period of learning to learn and remember. J. Neurosci 37, 5783–5795. - PMC - PubMed
    1. Angulo MC, et al., 1997. Subunit composition, kinetic, and permeation properties of AMPA receptors in single neocortical nonpyramidal cells. J. Neurosci 17, 6685–6696. - PMC - PubMed
    1. Azzopardi D, et al., 2014. Effects of hypothermia for perinatal asphyxia on childhood outcomes. N. Engl. J. Med 371, 140–149. - PubMed

Publication types

Substances