. 2024 Nov 12;18(45):31109-31122.
doi: 10.1021/acsnano.4c08672. Epub 2024 Nov 1.

Insights into the Hierarchical Assembly of a Chemically Diverse Peptide Hydrogel Derived from Human Semenogelin I

Affiliations

Insights into the Hierarchical Assembly of a Chemically Diverse Peptide Hydrogel Derived from Human Semenogelin I

Brett H Pogostin et al. ACS Nano. .

Abstract

A peptide corresponding to a 13-residue segment of the human protein semenogelin I has been shown to generate a hydrogel consisting of amyloid-like fibrils. The relative chemical diversity (compared to synthetic de novo sequences) with 11 distinct amino acids makes this peptide (P0) an ideal candidate for investigating the role of individual residues in gelation. Herein, the N-terminal residues have been sequentially removed to furnish a series of truncated peptides, P1-P10, ranging from 12 to 3 residues in length. FTIR spectroscopy investigations reveal that P0-P6 forms a β-sheet secondary structure while shorter sequences do not self-assemble. Site-specific isotope labeling of the amide backbone of P0-P2 with the IR-sensitive vibrational probe 13C═O yields FTIR spectra indicative of the initial formation of a kinetic product that slowly transforms into a structurally different thermodynamic product. The effects of the isotopic labels on the IR spectra facilitate the assignment of parallel and antiparallel structures, which are sometimes coexistent. Additional IR studies of three PheCN-labeled P0 sequences are consistent with an H-bonded β-sheet amide core, spanning the 7 central residues. The macromolecular assembly of peptides that form β-sheets was assessed by cryo-TEM, SAXS/WAXS, and rheology. Cryo-TEM images of peptides P1-P6 display μm-long nanofibrils. Peptides P0-P3 generate homogeneous hydrogels composed of colloidally stable nanofibrils, and P4-P6 undergo phase separation due to the accumulation of attractive interfibrillar interactions. Three amino acid residues, Ser39, Phe40, and Gln43, were identified to be of particular interest in the truncated peptide series as the removal of any one of them, as the sequence shortens, leads to a major change in material properties.

Keywords: X-ray scattering; amyloid; isotope effects; peptide aggregation; protein fragment; self-assembly; supramolecular assembly.


Conflict of interest statement

The authors declare no competing financial interest.

Figures

Figure 1
Figure 1
(A) Chemical structure of SgI37–49 (P0), corresponding to amino acid residues 37–49 of human semenogelin I, highlighting the alternating hydrophobic (green) and hydrophilic (purple) residues, with the neutral N-acetyl and C-amide end caps circled in red. (B) The sequences of peptides P0–P10 were investigated in this study. All of the peptides were similarly capped at both ends. (C) The residues in P0–P3, labeled with a vibrationally sensitive probe, one at a time, with a backbone amide 13C=16O (orange) or a PheCN (green), with the chemical structures of the probes shown in the orange (13C atom solid circle) and green boxes, respectively.
Figure 2
Figure 2
FTIR spectra of 2.0 mM P0, P1, P2, and P3 at time 0 h (blue), 48 h (red), and 1 week (green) at ambient temperature at pD 7.0. Signals are observed at ca. 1615–1619 and 1684 cm–1 consistent with β-sheet fibrils. Insets are shown for P0–P2, highlighting the high-frequency band area of 1660–1700 cm–1, which remains for P0, decreases in intensity with time for P1 and P2, and is absent for P3.
Figure 3
Figure 3
(A–D) IE FTIR spectra after 24 h of incubation at ambient temperatures of P0 and P3 with an intrinsic vibrational probe, 13C=O, placed in the backbone amide at the residue indicated with an asterisk (Figure 1C). (E) An overlay of P0 Ser41* and P3 Ser41* (normalized to the strongest intensity band).
Figure 4
Figure 4
IE FTIR spectral data showing the conversion over time of P0 Ser41* from an antiparallel to a predominantly parallel β-sheet arrangement at 2.0 mM in water and pD 8.0, with time points taken at 24 h (black), 6 days (red), and 54 days (blue).
Figure 5
Figure 5
An energy landscape schematic for (A) P0 and P2, where the primary nucleation energy barrier is lower for an antiparallel than a parallel arrangement but where parallel is thermodynamically more stable, and (B) P3, where the barrier is lower for a parallel than an antiparallel arrangement and where parallel is also the thermodynamic product. While in this schematic, the conversion from one structure to the other is shown to go via aggregate dissociation to monomers, an alternative pathway for strand rearrangement could be direct conversion.
Figure 6
Figure 6
A sample of F40FCN (1.0 mM in H2O at pH 8.0) was incubated at ambient temperature and analyzed immediately (blue, predominantly water-exposed) and after 1 week (black, predominantly fibril-embedded).
Figure 7
Figure 7
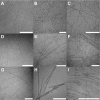
Cryo-TEM images of P0–P6 (for additional images, see Figure S29). (A) P0, (B) P1, (C) P2, (D) P3, (E) P4, (F) P5, and (G) P6. Small curved objects are observed for P3 (D), which are attributed to an early intermediate in fibril formation. Shorter fibrils are more frequently observed for sequences P5 (H) and P6 (I). The images were taken after 1 week of incubation at 21 °C in pH 8.0 water and at a concentration of 2.0 mM except for panels B and C, which were imaged from samples prepared at 100 μM. The white scale bar in all images represents 200 nm.
Figure 8
Figure 8
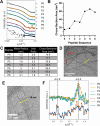
(A) SAXS curves (0.004 < q < 0.5 Å–1) of 2.0 mM P0–P6 and 1.0 mM P7 after 7 days of incubation at 21 °C and pH 8.0 with elliptical cylinder model fits shown as black dashed lines. (B) The relationship between the cross-section area and the sequence demonstrates a steady increase in the thickness of the fibrils as residues are removed from the N-terminus. (C) Table of the fibril dimensions for each peptide at day 7 as determined by fitting each scattering curve to an elliptical cylinder model. (D) Cryo-TEM image of P4 at 100k magnification after 7 days of incubation at 21 °C showing two smaller fibrils (red arrows) twisting together into a bundle (yellow arrow). (E) Close-up P5 cryo-TEM image (after 7 days of incubation at 21 °C) of a fibril bundle composed of approximately 5 fibrils and a diameter of ∼10 nm (yellow line). White lines show boundaries between fibrils in the cluster, as approximated by ImageJ pixel intensity analysis. (F) Baseline-subtracted and area-normalized plot of the WAXS region of the scattering curve, where P0–P3 and P4–P6 are offset from each other, show a peak at 5.9 Å (1.05 Å–1) present in P4–P6 and a peak at 4.8 Å (1.32 Å–1) present in P0–P3.
Figure 9
Figure 9
Rheological measurements on P2 and P3 hydrogels after incubation at ambient temperature for 1 week. (A) Flow curve of P2 and P3 with shear stress (filled circles) and viscosity (open circles) plotted against shear rate (0–10 s–1). (B) Frequency sweeps of G′ (filled circles) and G″ (open circles) with a frequency range of 0.1–100 rad/s. (C) Amplitude sweeps plotting G′ (filled circles), G″ (open circles), and shear stress (dotted line) over strain values of 0.01–100%. (D) The recovery time of G′ at a strain of 0.1% was measured after deformation induced by a flow curve experiment. The flow curve was conducted at a shear rate ranging from 0.01 to 300 s–1, which corresponds to a logarithmic strain ramp of 37.6–695000% over 170 s (gray area).
Figure 10
Figure 10
(A) The storage modulus (G’) plotted against angular frequency after the 2.0 mM pH 8.0 samples of P2 and P3 were incubated for 24 h and 1 week at 21 °C. The storage modulus (G’) for both peptides increases over the course of a week. (B, C) Scattering curves of P2 (B) and P3 (C) after various incubation periods at 21 °C. P2 scattering curves do not change, suggesting that the fibril morphology has reached a steady state while P3 continues to change over 18 days of incubation. (D,E) Cryo-TEM images of curly objects present in P3 after 3 h (D) and 7 days (E) of incubation at 21 °C showing that the curled structures persist over the 1-week incubation period. The scale bars represent 50 nm.

References

    1. Ahmed E. M. Hydrogel: Preparation, Characterization, and Applications: A Review. J. Adv. Res. 2015, 6 (2), 105–121. 10.1016/j.jare.2013.07.006. - DOI - PMC - PubMed
    1. Jonker A. M.; Löwik D. W. P. M.; van Hest J. C. M. Peptide- and Protein-Based Hydrogels. Chem. Mater. 2012, 24 (5), 759–773. 10.1021/cm202640w. - DOI
    1. Zhao W.; Jin X.; Cong Y.; Liu Y.; Fu J. Degradable Natural Polymer Hydrogels for Articular Cartilage Tissue Engineering. J. Chem. Technol. Biotechnol. 2013, 88 (3), 327–339. 10.1002/jctb.3970. - DOI
    1. Dasgupta A.; Mondal J. H.; Das D. Peptide Hydrogels. RSC Adv. 2013, 3 (24), 9117–9149. 10.1039/c3ra40234g. - DOI
    1. Rodriguez L. M. D. L.; Hemar Y.; Cornish J.; Brimble M. A. Structure–Mechanical Property Correlations of Hydrogel Forming β-Sheet Peptides. Chem. Soc. Rev. 2016, 45 (17), 4797–4824. 10.1039/C5CS00941C. - DOI - PubMed

Publication types

MeSH terms

LinkOut - more resources