. 2024 Nov 1;15(1):9464.
doi: 10.1038/s41467-024-53706-3.

Prostaglandin E2-EP2/EP4 signaling induces immunosuppression in human cancer by impairing bioenergetics and ribosome biogenesis in immune cells

Affiliations

Prostaglandin E2-EP2/EP4 signaling induces immunosuppression in human cancer by impairing bioenergetics and ribosome biogenesis in immune cells

Siwakorn Punyawatthananukool et al. Nat Commun. .

Abstract

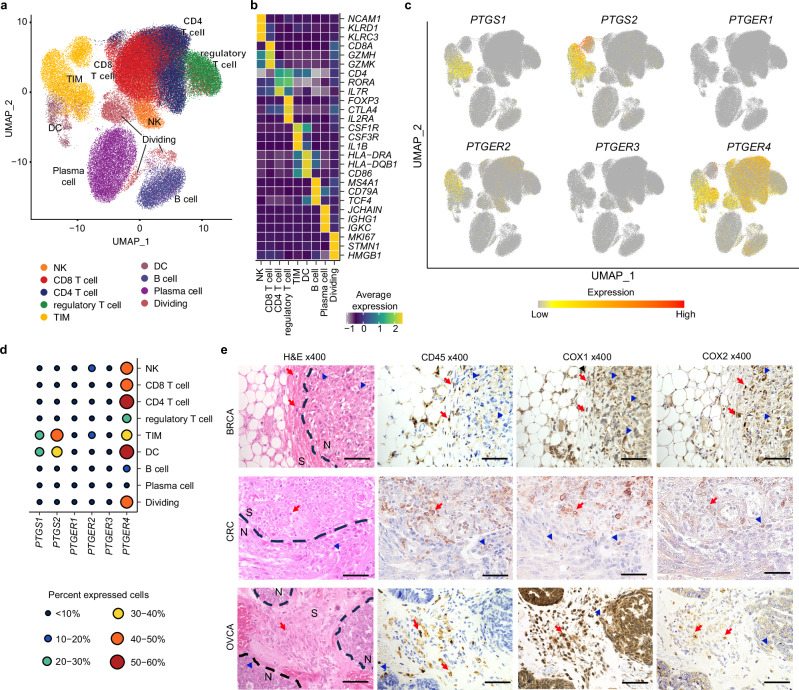
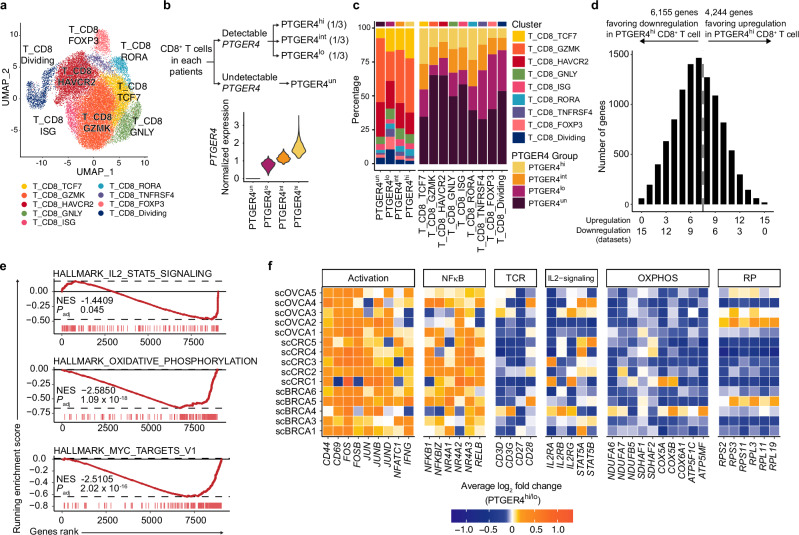
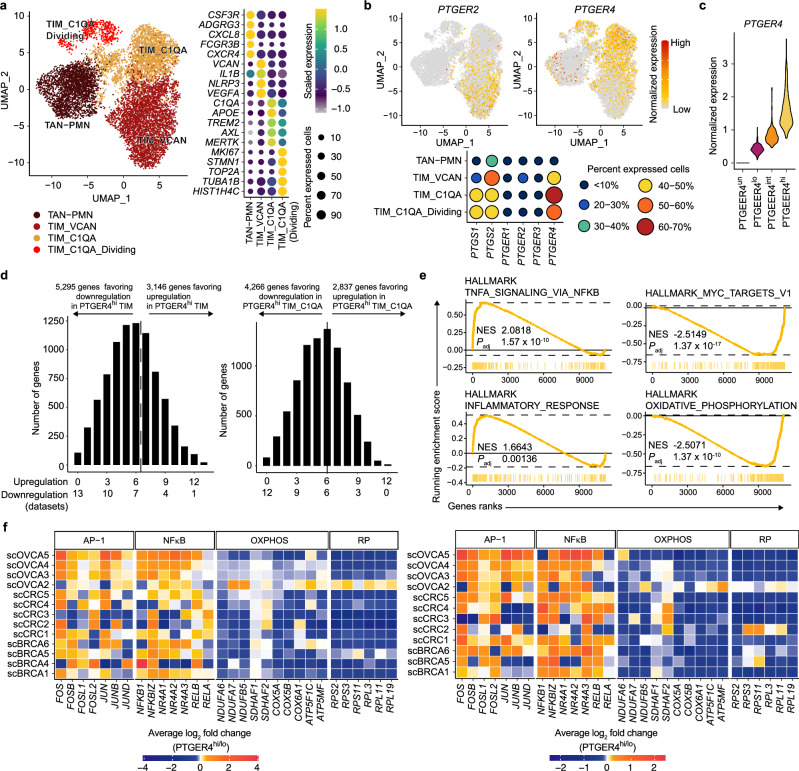
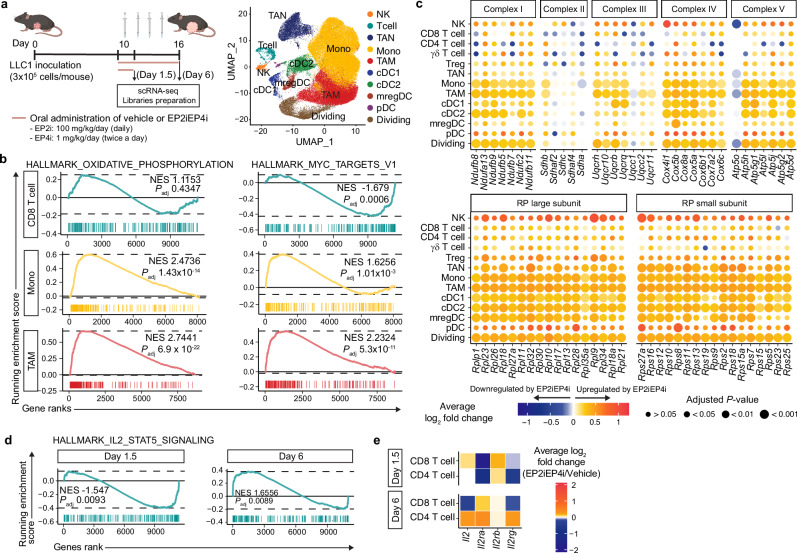
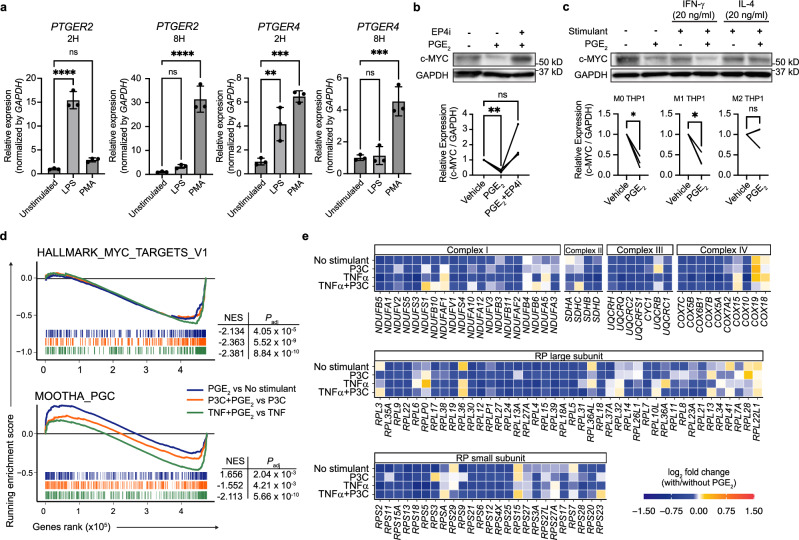
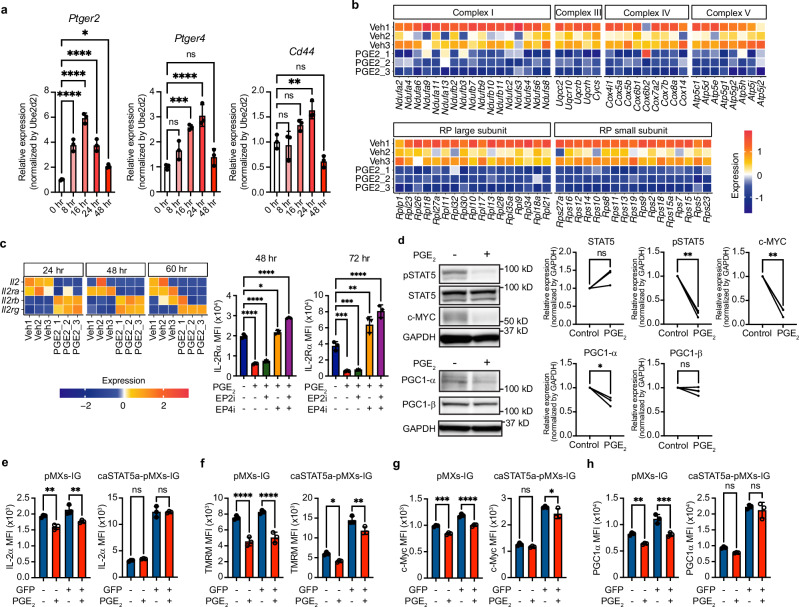
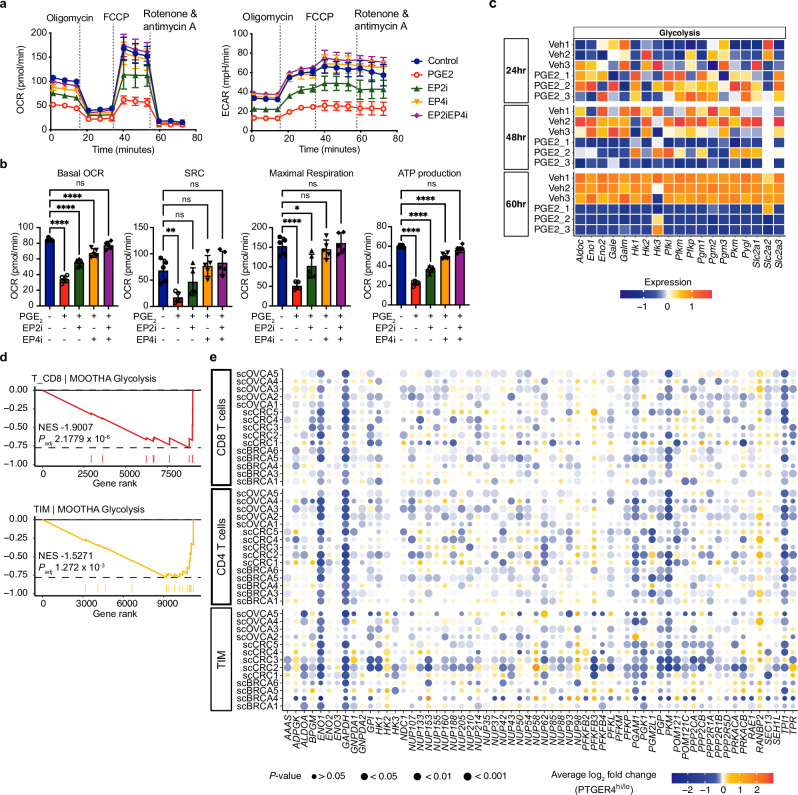
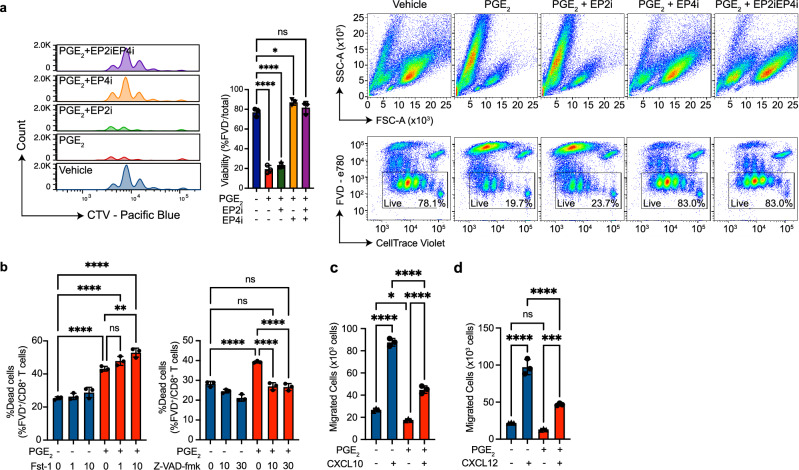
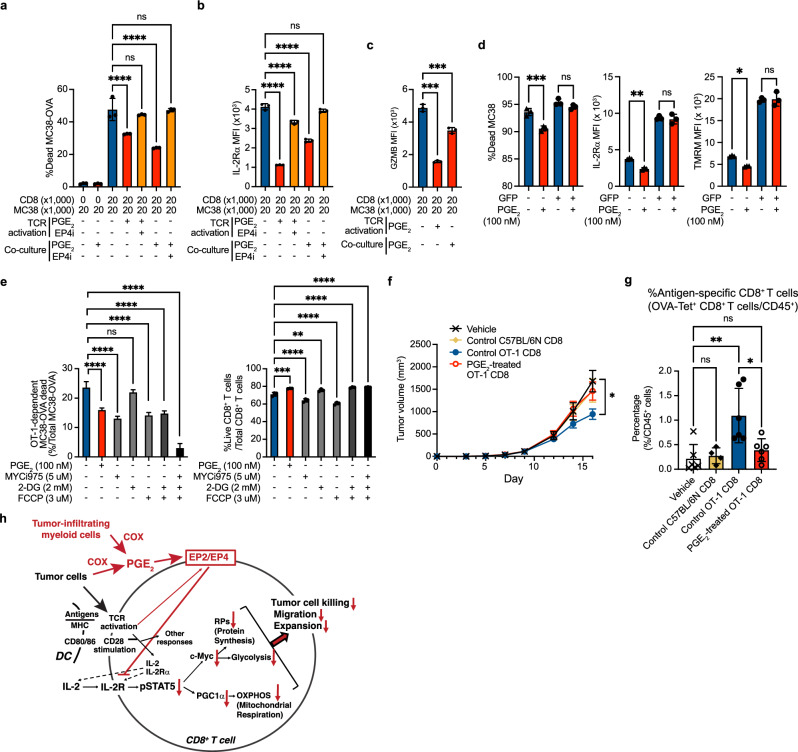
While prostaglandin E2 (PGE2) is produced in human tumor microenvironment (TME), its role therein remains poorly understood. Here, we examine this issue by comparative single-cell RNA sequencing of immune cells infiltrating human cancers and syngeneic tumors in female mice. PGE receptors EP4 and EP2 are expressed in lymphocytes and myeloid cells, and their expression is associated with the downregulation of oxidative phosphorylation (OXPHOS) and MYC targets, glycolysis and ribosomal proteins (RPs). Mechanistically, CD8+ T cells express EP4 and EP2 upon TCR activation, and PGE2 blocks IL-2-STAT5 signaling by downregulating Il2ra, which downregulates c-Myc and PGC-1 to decrease OXPHOS, glycolysis, and RPs, impairing migration, expansion, survival, and antitumor activity. Similarly, EP4 and EP2 are induced upon macrophage activation, and PGE2 downregulates c-Myc and OXPHOS in M1-like macrophages. These results suggest that PGE2-EP4/EP2 signaling impairs both adaptive and innate immunity in TME by hampering bioenergetics and ribosome biogenesis of tumor-infiltrating immune cells.


Conflict of interest statement

S.N. is a scientific advisor to Astellas Pharma Inc. and Toray Co Ltd. This work was supported in part by the Collaborative Research Grant from Ono Pharmaceutical Co Ltd. The remaining authors declare no competing interests.

Figures

Fig. 1
Fig. 1. Immune landscape of PGE2 signaling in TME of human cancers.
a Uniform manifold approximation and projection (UMAP) visualization of single-cell RNA sequencing (scRNAseq) data of tumor immune infiltrates (n = 15 patients, total of 86,613 cells). Clusters are colored corresponding to the annotated immune cell types. b Heatmap showing the expression of canonical marker genes used to annotate the immune cell clusters. c UMAP plots displaying gene expression of COX-1 (PTGS1) and COX-2 (PTGS2) and four cognate PGE receptors, PTGER1-4. d Dot plot indicating the fraction of cells expressing PTGS1, PTGS2, and PTGER1-4 in the immune cell clusters. e H&E staining and immunostaining for CD45, COX1, and COX2 in human breast cancer (BRCA), colorectal cancer (CRC), and ovarian cancer (OVCA). The scale bar is 50 µm. The curved dotted lines in the hematoxylin and eosin (H&E) images outline the boundary between the tumor nests (N) and the stroma (S). Blue arrowheads point to myeloid cells within the tumor nests (N), while red arrows indicate myeloid cells within the inflamed peritumoral stroma in breast (upper) and colon cancers (middle). In ovarian cancer (lower), blue arrowheads point to myeloid cells within the tumor nests (N), while red arrows point to myeloid cells within the inflamed intertumoral stroma (S), specifically within the papillary proliferations of serous carcinomas. A total of 24, 32, and 17 sections were stained for H&E, COX1, and COX2, respectively. Similar findings were observed across all 15 patients. See Supplementary Table 2. Source data are provided as a Source Data file.
Fig. 2
Fig. 2. Unique gene expression signature of PTGER4hi CD8+ T cells in human cancer.
a UMAP projection displaying CD8+ T cell subsets (n = 26,709 cells). b Schematic of the PTGER4 group classification algorithm (top) and a violin plot illustrating PTGER4 expression in each PTGER4-expressing group of total CD8+ T cells population (bottom). c The percentage of each CD8+ T cell subset in different PTGER4-expressing groups (left) and the percentage of each PTGER4-expressing group in each CD8+ T cell subset (right). d Distribution of upregulated and downregulated genes in PTGER4hi compared to PTGER4lo CD8+ T cells in a total of 15 patient samples. e Gene set enrichment analysis (GSEA) of differentially expressed genes (DEGs) between the PTGER4hi and PTGER4lo groups in total CD8+ T cells for the pathways of interest: HALLMARK_IL2_STAT5_SIGNALING, HALLMARK_OXIDATIVE_PHOSPHORYLATION, and HALLMARK_MYC_TARGETS_V1. P-values were calculated using the adaptive multilevel splitting Monte Carlo approach and adjusted using the Benjamini–Hochberg procedure. NES normalized enrichment score. f Heatmap displaying log2 fold change in expression levels of DEGs between the PTGER4hi and PTGER4lo total CD8+ T cells. The canonical genes in T cell activation, NFκB components, TCR and IL-2 signaling, mitochondrial oxidative phosphorylation (OXPHOS) and ribosomal proteins (RP) are shown. Source data are provided as a Source Data file.
Fig. 3
Fig. 3. Increased inflammatory response and decreased OXPHOS and RP expression in PTGER4hi myeloid cells in human tumors.
a UMAP projection of TIM subclusters (left) and signature gene expression in the TIM subclusters (right). b UMAP plots displaying PTGER2 (upper left) and PTGER4 (upper right) expression on TIM subclusters and a dot plot illustrating the fraction of TIM subcluster cells expressing genes involved in PGE biosynthesis and its receptors (bottom). c Grouping of PTGER4-expressing total TIM cells based on PTGER4 expression levels. d Distribution of upregulated and downregulated genes in PTGER4hi compared to PTGER4lo total TIM cells (left) and PTGER4hi compared to PTGER4lo TIM_C1QA cells (right). e GSEA of DEGs between PTGER4hi and PTGER4lo total TIM cells for the following pathways: HALLMARK_TNFA_SIGNALING_VIA_NFKB, HALLMARK_INFLAMMATORY_RESPONSE, HALLMARK_MYC_TARGETS_V1 and HALLMARK_OXIDATIVE_PHOSPHORYLATION. P-values were calculated using adaptive multilevel splitting Monte Carlo approach and adjusted via Benjamini–Hochberg procedure. f Heatmaps showing log2 fold change in gene expression between PTGER4hi and PTGER4lo in total TIM cluster cells (left) and TIM_C1QA subcluster cells (right). The representative genes in cell activation, NFκB components, OXPHOS and RP in PTGER4hi compared to PTGER4lo cells are shown. The samples with less than 3 cells per group were excluded from analyses in (d) and (f). Source data are provided as a Source Data file.
Fig. 4
Fig. 4. Reversal of OXPHOS and RP gene expression and IL-2 signaling of immune cells by combined EP2 and EP4 antagonist treatment in mouse LLC1 tumor.
a Schematic experimental method (left) and UMAP projection to the immune cell clustering (68,317 cells) (right). Created in BioRender. Punyawatthananukool, S. (2023) BioRender.com/l57t808. b GSEA of DEGs in indicated immune cell clusters from tumors of EP2/EP4i or vehicle-treated mice at day 1.5. c Dot plots showing log2 fold change of expression levels of the DEGs in OXPHOS (upper) and RP (lower) in the indicated immune cell clusters between the EP2/EP4i-treated and vehicle-treated tumors. Two-sided Wilcoxon Rank Sum test. Bonferroni correction was used to adjust the P-value. d GSEA plots indicating upregulation of HALLMARK_IL2_STAT5_SIGNALING in CD8+ T cells not at day 1.5 but at day 6 of the EP2/EP4i treatment. e Heatmap showing Iog2 fold change of gene expression between EP2/EP4i-treated mice and vehicle-treated mice showing upregulation of Il2ra expression in both CD4+ T cells and CD8+ T cells at day 6 of the EP2/EP4i treatment. b, d P-values were based on adaptive multilevel splitting Monte Carlo approach and adjusted by Benjamini–Hochberg procedure. ae Data is shown for day 1.5 (n = 3 per condition) and day 6 (n = 2 per condition). Source data are provided as a Source Data file.
Fig. 5
Fig. 5. Control of macrophage reactivity by PGE2-EP4 signaling.
a Upregulation of PTGER2 and PTGER4 expression upon THP-1 cell stimulation with PMA and LPS. Data represent mean ± SD (n = 3 per group). One-way ANOVA with Dunnett’s multiple comparison test. b PGE2-mediated downregulation of c-Myc protein in M0-like THP1 macrophages in the EP4-dependent manner. THP-1 cells were differentiated into macrophages with PMA for 24 h, rested for 1 day, and then incubated with PGE2 in the presence or absence of EP4 antagonist for 2 days (n = 3 per condition), and then subjected to Western blot analysis. Upper, representative Western blot. Lower, quantification of c-Myc protein levels. Matched one-way ANOVA. c Downregulation of c-Myc by PGE2 in IFN-γ-induced M1-like macrophages. THP-1 cells differentiated to macrophages with PMA for 24 h were incubated with vehicle, 20 ng/ml each of IFN-γ or IL-4 in the presence or absence of 100 nM PGE2 for 48 h (n = 3 per condition), and subjected to Western blot analysis. Upper, representative Western blot. Lower, relative quantification of c-Myc. Paired two-tailed t-test. b, c The results from one of three independent experiments are shown. ac *P < 0.05. **P < 0.01, ***P < 0.001, ****P < 0.0001. d, e Reanalysis of published microarray dataset (GSE47189). n = 3 per condition. d GSEA of DEGs between PGE2-treated and control hMDMs stimulated with vehicle, P3C or TNF-α for HALLMARK_MYC_TARGETS_V1 (upper) and MOOTHA_PGC (MsigDB) (lower). P-values were based on adaptive multilevel splitting Monte Carlo approach and adjusted by Benjamini–Hochberg procedure. e Heatmaps showing log2 fold change of gene expression levels of OXPHOS (upper) and RP (lower) genes between PGE2-stimulated and control hMDMs stimulated with vehicle, P3C, TNF-α or both P3C and TNF-α. Two-sided Wilcoxon Rank Sum test. Source data and exact P-values are provided as a Source Data file.
Fig. 6
Fig. 6. Effects of PGE2-EP4 signaling on IL-2 signaling of CD8+ T cells.
a RT-qPCR for Ptger2, Ptger4, and Cd44 expression in CD3/CD28-stimulated CD8+ T cells at different times. A total of 1 × 10⁵ CD8+ T cells per well were stimulated using anti-CD3/CD28 Dynabeads and 3 wells were pooled for each sample (n = 3 per condition). Data are mean ± SD. One-way ANOVA with Dunnett’s multiple comparison test. b, c (left), Downregulation of OXPHOS and RP genes (b) and IL-2R signaling (c) in CD8+ T cells incubated with PGE2. A total of 5 × 10⁵ naïve CD8+ T cells per well were stimulated with anti-CD3/CD28 Dynabeads in the presence of 30 IU/ml recombinant IL-2 (rIL-2) with or without 30 nM PGE2, for 24 h (b), 48 h, and 60 h (c) (n = 3 per condition). Each well was subjected to RNAseq. c (right) Naïve CD8+ T cells were stimulated with anti-CD3/CD28 Dynabeads and 30 IU/ml rIL-2 with or without 30 nM PGE2 and the indicated antagonists (n = 3 per condition) and collected for FACS analysis at 48 h or 72 h. c Time-dependent downregulation of Il2 and Il2ra expression (left) and decreased MFI of IL-2Rα and its reversal with the EP4 antagonist (right) in the PGE2-treated cells. Data are mean ± SD. One-way ANOVA with Dunnett’s multiple comparison test. Results are from one of four independent experiments with similar results. d Downregulation of IL-2 signaling, c-Myc, and PGC-1α by PGE2 in CD8+ T cells. Naïve CD8+ T cells were activated with Dynabeads in the presence or absence of 100 nM PGE2 (n = 3 per condition) and subjected to Western blot analysis at 48 h. Representative Western blots (left) and quantification of each band (right). Paired two-tailed t-test. Results are from one of the triplicate experiments with similar results. eh caSTAT5a transfection experiment. CD8+ T cells were stimulated with anti-CD3/CD28 Dynabeads and transfected with pMXs-IG as a control vector or caSTAT5a-pMXs-IG retrovirus. After 72 h, transfected cells were incubated with 10 IU/ml rIL-2 in the presence or absence of 100 nM PGE2 for 24 h (n = 3 per condition) and subjected to FACS analysis for IL-2Rα (e), TMRM (f), c-Myc (g), and PGC1α (h). GFP+ represents the fraction of transfected cells. Data are mean ± SD. One-way ANOVA with Sidak’s multiple comparisons test. Results are from one of two independent experiments with similar results. a, ch *P < 0.05. **P < 0.01, ***P < 0.001, ****P < 0.0001. Source data and exact P-values are provided as a Source Data file.
Fig. 7
Fig. 7. Effects of PGE2-EP4 signaling on mitochondrial respiration and glycolysis in CD8+ T cells.
a, b Extracellular flux analysis of the oxygen consumption rate (OCR) and extracellular acidification rate (ECAR) in TCR-activated naïve CD8+ T cells in the presence or absence of PGE2 and the indicated antagonists. Naïve CD8+ T cells were activated using anti-CD3/CD28 Dynabeads in the presence of 30 IU/ml r-IL2 either with or without 30 nM PGE2 and/or the indicated antagonist for 60 h. Data are mean ± SD, n = 5. b One-way ANOVA with Sidak’s multiple comparison test. *P < 0.05. **P < 0.01, ***P < 0.001, ****P < 0.0001. Representative results from two independent experiments are shown. c Heatmaps showing time-dependent downregulation of glycolysis-related genes in TCR-activated CD8+ T cells incubated with PGE2. n = 3 per condition. d GSEA plot of DEGs between PTGER4hi and PTGER4lo CD8+ T cells (top) and TIM cells from human tumor (bottom) for MOOTHA glycolysis gene set. P-values were estimated using adaptive multilevel splitting Monte Carlo approach and adjusted by Benjamini–Hochberg procedure. e Dot plot illustrating the downregulation of genes in REACTOME_GLYCOLYSIS pathway in PTGER4hi CD8+ T cells, CD4+ T cells, and TIM. Statistical analysis was performed using the two-sided Wilcoxon Rank Sum Test. Source data and exact P-values are provided as a Source Data file.
Fig. 8
Fig. 8. PGE2-EP4 signaling restricts CD8+ T cell expansion and migration.
a PGE2-mediated suppression of expansion and its reversal by the EP4 antagonist. A total of 1 × 10⁵ naïve CD8+ T cells were stimulated with anti-CD3/CD28 Dynabeads and 30 IU/ml rIL-2 in the presence or absence of 30 nM PGE2, followed by incubation for 72 h (n = 3 per condition) before FACS analysis. The data show representative histograms (left), PGE2-EP4 reduced CD8+ T cell viability (middle), and representative flow cytograms (right). Data are mean ± SD. One-way ANOVA with Dunnett’s multiple comparisons test. Results represent one of eight independent experiments showing similar outcomes. b PGE2-mediated CD8+ T cell death was partially reversed by apoptotic inhibitor (Z-VAD-fmk) but not ferroptosis inhibitor (Fst-1). Naïve CD8+ T cells were stimulated with anti-CD3/CD28 Dynabeads and 30 IU/ml rIL-2 in the presence or absence of 100 nM PGE2 and the indicated antagonists, followed by 72 h incubation (n = 3 per condition), then subjected to FACS analysis. Data are mean ± SD. One-way ANOVA with Sidak’s multiple comparisons test. Results are from one of six independent experiments with similar results. c, d PGE2 reduced CD8+ T cells’ chemotactic activity induced by CXCL10 (c) and CXCL12 (d). CD8+ T cells were stimulated with anti-CD3/CD28 Dynabeads in the presence or absence of PGE2. The stimulated cells were seeded to Transwell with a permeable membrane for migration toward vehicle, CXCL10, or CXCL12 (n = 3 per condition). The number of migrated cells was counted by FACS analysis after 3 h of incubation. Data are mean ± SD. One-way ANOVA with Tukey’s multiple comparisons test. Results are from one of the duplicate experiments with similar results. ad *P < 0.05. **P < 0.01, ***P < 0.001, ****P < 0.0001. Source data and exact P-values are provided as a Source Data file.
Fig. 9
Fig. 9. PGE2 impairs antitumor activity and infiltration capacity of CD8+ T cells.
ac Tumor cell killing assay. Naive OT-1 CD8+ T cells were stimulated with anti-CD3/CD28 Dynabeads in the presence or absence of 100 nM PGE2 for 48 h and co-cultured with MC38-OVA cells under the indicated condition with or without 100 nM PGE2 (n = 3 per condition). After overnight incubation, flow cytometric analysis was performed for %Dead MC38-OVA/Total MC38-OVA (a), expression of IL-2Rα (b), and GZMB (c). Data are mean ± SD. Results are from one of eight (a), seven (b), and two (c) independent experiments with similar results. a One-way ANOVA with Sidak’s multiple comparisons test. b, c One-way ANOVA with Dunnett’s multiple comparisons test. d Tumor cell killing assay of caSTAT5a-transfected OT-1 CD8+ T cells. Naive OT-1 CD8+ T cells were stimulated with anti-CD3/CD28 Dynabeads and retrovirally transfected with caSTAT5a-pMXs-IG. The caSTAT5a+ GFP+ and caSTAT5a GFP cells were FACS-sorted, expanded, and passaged every 3–4 days under 30 IU/ml rIL-2 for 12 days. A total of 4 × 10⁴ IL-2-expanded CD8+ T cells/well and 4 × 10⁴ MC38-OVA cells/well were used for the tumor cell-killing assay as described above (n = 3 per condition). After overnight incubation, %Dead MC38-OVA (left), IL-2Rα expression (middle), and TMRM signal (right) were analyzed. Data are mean ± SD. One-way ANOVA with Sidak’s multiple comparisons test. Results are from one of four independent experiments with similar results. e Effect of metabolic inhibitors on tumor cell killing capacity. Naive OT-1 CD8+ T cells were stimulated with anti-CD3/CD28 Dynabeads for 48 h, washed, and then incubated in medium containing the indicated metabolic inhibitor(s). MC38-OVA cells were seeded after CD8+ T cells were incubated for 1 h (n = 3 per condition). After overnight co-incubation, FACS analysis was performed for OT-1-dependent %Dead MC38-OVA/Total MC38-OVA (left) and %Live CD8+ T cell/Total CD8+ T cell (right). Data are mean ± SD. One-way ANOVA with Dunnett’s multiple comparisons test. Results are from one of five independent experiments with similar results. f, g Adoptive transfer experiment. MC38-OVA cells were transplanted to BALB/cSlc-nu/nu mice. Splenic CD8+ T cells from OT-1 mice or C57BL/6N mice were activated in the presence or absence of 100 nM PGE2 for 48 h and adoptively transferred to MC38-OVA-bearing mice as indicated. n = 6, except control C57BL/6N CD8, n = 4. Results are from one of four independent experiments with similar results. f Tumor growth. Data is mean ± SEM. One-way ANOVA with Sidak’s multiple comparisons test. g %OVA-tetramer+ CD8+ T cells/CD45+ cells infiltrating the tumor. Data is mean ± SD. One-way ANOVA with Sidak’s multiple comparisons test. h Schematic conceptual summary. ag *P < 0.05. **P < 0.01, ***P < 0.001, ****P < 0.0001. Gating strategies are provided in Supplementary Fig. 15. Source data and exact P-values are provided as a Source Data file.

References

    1. Rothwell, P. M. et al. Effect of daily aspirin on long-term risk of death due to cancer: analysis of individual patient data from randomised trials. Lancet77, 31–41 (2011). - PubMed
    1. Wang, D. & Dubois, R. Eicosanoids and cancer. Nat. Rev. Cancer10, 181–193 (2010). - PMC - PubMed
    1. Sicking, I. et al. Prognostic influence of cyclooxygenase-2 protein and mRNA expression in node-negative breast cancer patients. BMC Cancer14, 952 (2014). - PMC - PubMed
    1. Riciotti, E., Grosser, T. & FitzGerald, G. A. Lipid-derived autacoids: eicosanoids and platelet-activating factor in Goodman & Gilman’s The Pharmacological Basis of Therapeutics 14th edn (eds Brunton, L. L. & Knollmann, B. C.) 813–828 (McGraw-Hill, 2023).
    1. Grosser, T., Fries, S. & FitzGerald, G. A. Biological basis for the cardiovascular consequences of COX-2 inhibition: therapeutic challenges and opportunities. J. Clin. Invest.116, 4–15 (2006). - PMC - PubMed

Publication types

MeSH terms

Substances

Associated data