. 2024 Nov 2;15(1):9468.
doi: 10.1038/s41467-024-53666-8.

HiDDEN: a machine learning method for detection of disease-relevant populations in case-control single-cell transcriptomics data

Affiliations

HiDDEN: a machine learning method for detection of disease-relevant populations in case-control single-cell transcriptomics data

Aleksandrina Goeva et al. Nat Commun. .

Abstract

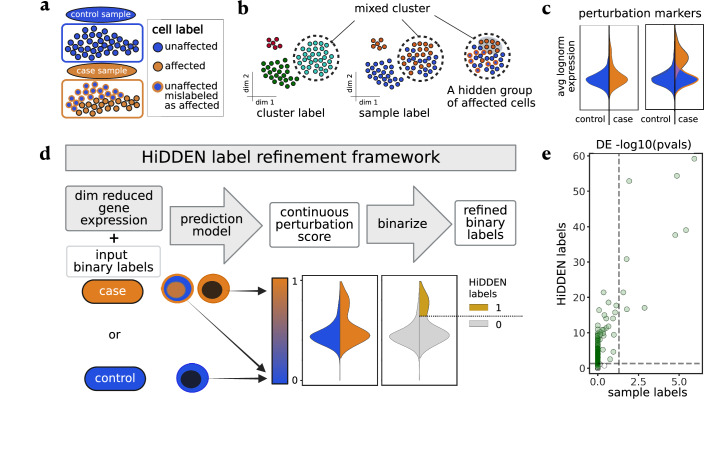
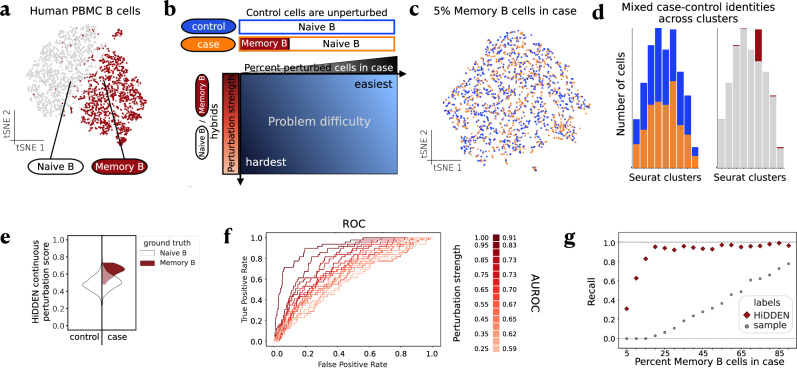
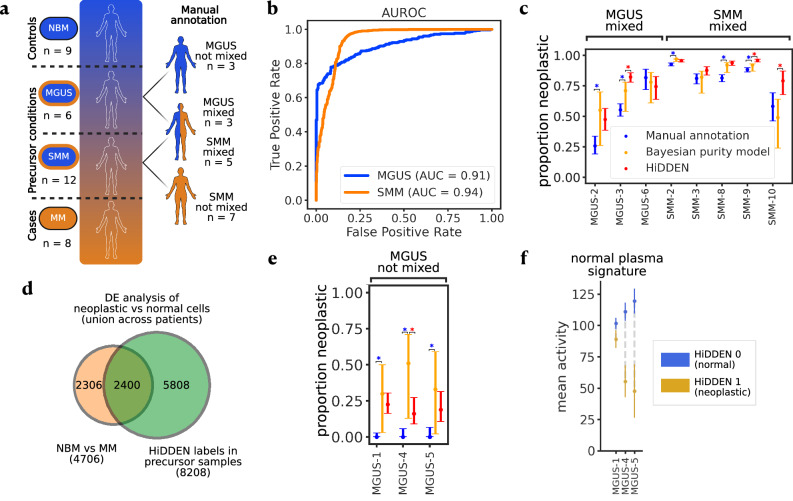
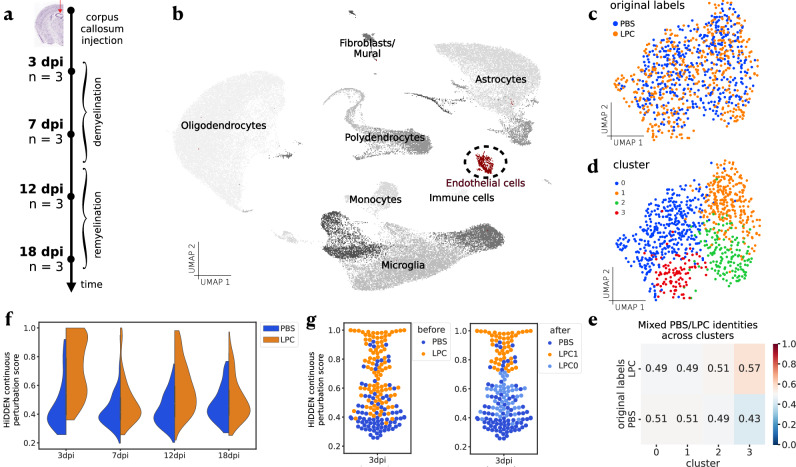
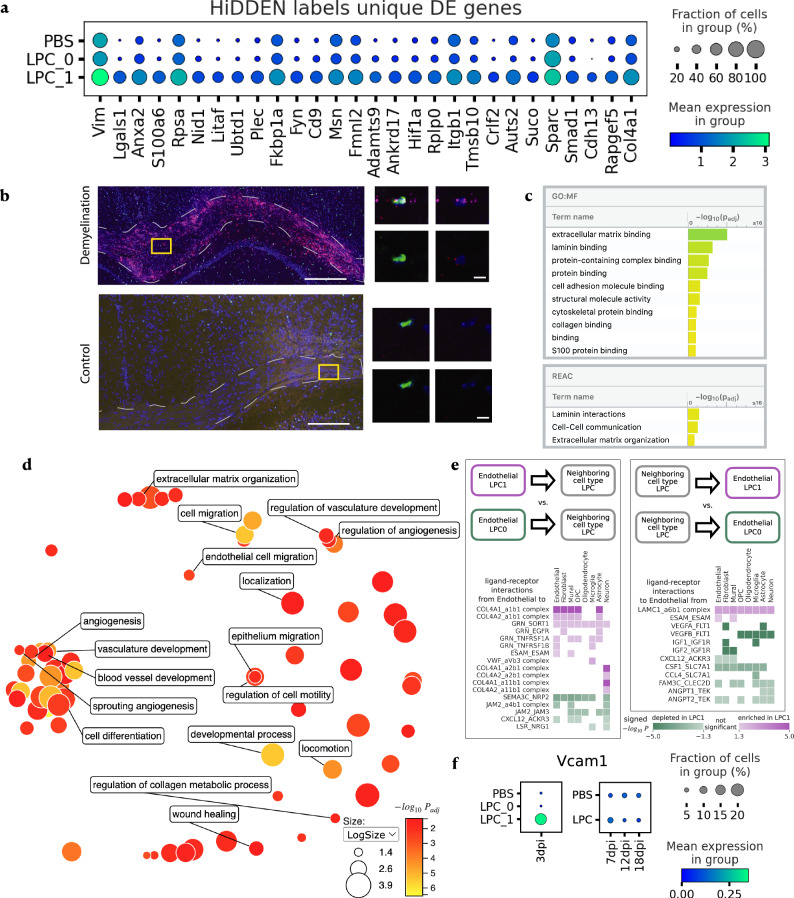
In case-control single-cell RNA-seq studies, sample-level labels are transferred onto individual cells, labeling all case cells as affected, when in reality only a small fraction of them may actually be perturbed. Here, using simulations, we demonstrate that the standard approach to single cell analysis fails to isolate the subset of affected case cells and their markers when either the affected subset is small, or when the strength of the perturbation is mild. To address this fundamental limitation, we introduce HiDDEN, a computational method that refines the case-control labels to accurately reflect the perturbation status of each cell. We show HiDDEN's superior ability to recover biological signals missed by the standard analysis workflow in simulated ground truth datasets of cell type mixtures. When applied to a dataset of human multiple myeloma precursor conditions, HiDDEN recapitulates the expert manual annotation and discovers malignancy in early stage samples missed in the original analysis. When applied to a mouse model of demyelination, HiDDEN identifies an endothelial subpopulation playing a role in early stage blood-brain barrier dysfunction. We anticipate that HiDDEN should find wide usage in contexts that require the detection of subtle transcriptional changes in cell types across conditions.


Conflict of interest statement

The authors declare no competing interests.

Figures

Fig. 1
Fig. 1. Overview of problem and HiDDEN label refinement framework.
a Setup of a case-control single-cell experiment, in which cells of a given cell type in control samples are labeled as unaffected, while cells in case samples can be either affected or unaffected by the perturbation. b Standard clustering can produce clusters containing cells with mixed case-control sample-level labels while the subset of truly affected cells can be hidden. Colors as defined in A. c Representative violin plots of the average log normalized expression of perturbation markers split by sample-level labels (left) and highlighting the difference in the distributions of affected and unaffected cells within the case sample (right). Colors as defined in A. Area not scaled to count. d Overview of the HiDDEN label refinement framework. First, gene expression profiles are summarized through a dimensionality reduction method. Then, a prediction model takes the reduced expression profiles and the sample-level binary labels and transforms them into per cell continuous perturbation scores. Finally, the continuous scores of cells originating from the case samples can be binarized through a classification method into HiDDEN-refined binary labels (Methods). e Representative scatterplot of -log10 adjusted p values per gene computed using differential expression (DE) on case-control sample labels (x-axis) and HiDDEN-refined binary labels (y-axis). P values are calculated using a one-sided Wilcoxon rank sum test with Benjamini-Hochberg correction. Horizontal and vertical dashed lines drawn at -log10(0.05) significance threshold. Ground truth DE genes colored in green. Standard DE analysis on case-control labels captures only a small number of ground truth markers, while HiDDEN successfully recovers many of them. Figure 1 panel a Created in BioRender. Lab, M. (2024) BioRender.com/f66p361. Figure 1 panel B created in BioRender. Lab, M. (2024) BioRender.com/j24d711. Figure 1 panel d created in BioRender. Lab, M. (2024) BioRender.com/z12o210.
Fig. 2
Fig. 2. HiDDEN detects biological signal missed by the standard analysis workflow in simulated ground truth mixtures of two cell types.
a tSNE embeddings of gene expression of Naive B and Memory B cells. b Schematic of problem difficulty and definition of synthetic datasets along two axes: percent perturbed cells in case sample (x-axis) and strength of the perturbation (y-axis). Detecting the perturbation is most challenging when there are few affected cells and the difference between affected and unaffected cells is small. c tSNE embeddings of a representative simulated dataset containing 5% Memory B cells in the case sample. Cells colored by case-control labels. Colors as defined in B. d Distribution of case-control (left) and Memory B-Naive B (right) cell identities across Seurat clusters. Colors as defined in A and B. e Violin plot of the distributions of the continuous perturbation score of Naive B and Memory B cells split over control and case and colored by ground truth labels, for the dataset containing 5% Memory B cells in the case sample. f Area under the Receiver Operating Characteristic (AUROC) curves for classification of ground truth cell labels as a function of perturbation strength for the dataset containing 5% perturbed cells in the case sample with the AUROC indicated in the legend for a sampling of the curves. g Recall of ground truth DE genes by DE testing on indicated labels as a function of percent Memory B cells in case sample. Source data of (a, c, d, e, f, g) are provided as a Source Data file.
Fig. 3
Fig. 3. Application of HiDDEN to a human bone marrow dataset with previously published annotations.
a Schematic of the dataset which includes human plasma cells from healthy donors, multiple myeloma patients, and two precursor states. Precursor samples possibly contain a mixture of healthy and malignant cells. Manual annotation of healthy and malignant cells per precursor patient were reported previously. b AUROC for predicting per-cell malignancy status in mixed samples averaged for each precursor state. c Comparison of manual annotation, Bayesian purity model, and HiDDEN predictions for estimating the neoplastic proportion (y-axis) in mixed MGUS and SMM samples (x-axis). Data are presented as an estimated proportion of neoplastic cells with 95% confidence intervals computed over n = 116 cells for MGUS-2, n = 321 for MGUS-3, n = 82 for MGUS-6, n = 1857 for SMM-2, n = 349 for SMM-3, n = 711 for SMM-8, n = 1253 for SMM-9, and n = 67 for SMM-10. Significance for testing the difference between manual annotation and HiDDEN-based estimate with the Bayesian ground truth point estimate is calculated using a two-sided Beta-Binomial test (Methods), indicated with an asterisk for Bonferroni-adjusted p values < 0.01. Exact p-values are reported in the Source Data file and Supplementary Table 2. d Venn diagram of DE genes comparing neoplastic with normal cells based on NBM/MM samples and HiDDEN refined labels in precursor samples identified 2400 significantly overlapping genes (one-sided hypergeometric test, p-value = 3.066e-31) and 5808 genes uniquely found using HiDDEN. e Comparison of manual annotation, Bayesian purity model, and HiDDEN predictions for estimating the neoplastic proportion (y-axis) in non-mixed MGUS samples (x-axis). Colors as defined in c. Data are presented as estimated proportion of neoplastic cells of each sample with 95% confidence intervals computed over n = 133 cells for MGUS-1, n = 62 for MGUS-4, and n = 53 for MGUS-5. Significance is established using the same approach as in c. Exact p values are reported in the Source Data file and Supplementary Table 2. f Computational validation of cells predicted to be malignant by HiDDEN in low purity MGUS samples. Mean activity ± SEM (y-axis) of genes assigned to a normal plasma signature for the normal and abnormal populations within each sample (x-axis). SEM is computed over n = 30 normal and n = 103 neoplastic cells for MGUS-1, n = 10 normal and n = 52 neoplastic cells for MGUS-4, and n = 10 normal and n = 43 neoplastic cells for MGUS-5. Figure 3 panel a created in BioRender. Lab, M. (2024) BioRender.com/x13c819. Source data of (b, c, d, e, f) are provided as a Source Data file.
Fig. 4
Fig. 4. Application of HiDDEN to ECs from a mouse demyelination time-course experiment.
a Overview of experimental design. Corpus callosum injection with saline (PBS) and a compound toxic to oligodendrocytes (LPC) used to induce demyelination with n = 3 mice per condition per time point across four time points. b UMAP embeddings of non-neuronal cells from PBS (control) and LPC conditions across all time points colored by annotation of major cell type. ECs highlighted in red. UMAP embeddings of ECs across all time points colored by PBS/LPC sample-level labels (c), and Seurat cluster labels (d). e Relative abundance of case-control cell identities across Seurat clusters. f Violin plots of HiDDEN continuous perturbation scores split over PBS and LPC labels and grouped by time point. g Swarmplot of HiDDEN continuous perturbation scores for the 3dpi cells colored by original PBS/LPC labels (left) and with color indicating the refinement of LPC cells into affected (LPC1) and unaffected (LPC0) (right). Source data of (b, c, d, e, f, g) are provided as a Source Data file.
Fig. 5
Fig. 5. Characterization of the demyelination-affected endothelial subpopulation (LPC1) identified by HiDDEN.
a Dotplot of mean expression at 3 dpi of LPC1 marker genes ordered by p-value. P-values are calculated using a one-sided Wilcoxon rank sum test with Benjamini-Hochberg correction. b Validation of gene expression with fluorescent in-situ hybridization (FISH) and confocal microscopy showing presence of endothelial cells (Flt1-positive cells, green) coexpressing Lgals1 (red) and S100a6 (magenta) specifically present in demyelinating lesion (top) and not control (bottom) brains, 3 days after injection. Left: Overview of a demyelinating or control white matter lesion. Corpus callosum outlined in gray dashed line. Right: High-resolution confocal images of single endothelial cells. All images are representative of n = 2–3. Scale bars are left top = 200um, left bottom = 100um, right = 10um. c Significantly enriched GO molecular function terms (top) and Reactome pathways (bottom) based on LPC1 marker genes ordered by significance. The reported p-values are computed using the over-representation statistical test in g:Profiler and are Bonferroni-adjusted. d ReviGO plot summarizing the significantly enriched GO biological processes based on LPC1 marker genes colored by significance with selected labels. Significance values are computed in the same was as described in c. Dot size indicates the log10 of the number of genes associated with each term. e Significantly enriched (purple) and depleted (green) ligand-receptor interactions between LPC1 (relative to LPC0) endothelial cells and neighboring cell types split by interaction direction: from endothelial to neighboring cell type (left), and from neighboring cell type to endothelial (right). P values are calculated using a one-sided permutation test. f Dot plots of mean expression of Vcam1 across time and condition labels. Source data of (a, c, d, e, f) are provided as a Source Data file.

References

    1. Grubman, A. et al. A single-cell atlas of entorhinal cortex from individuals with Alzheimer’s disease reveals cell-type-specific gene expression regulation. Nat. Neurosci.22, 2087–2097 (2019). - PubMed
    1. Wilk, A. J. et al. A single-cell atlas of the peripheral immune response in patients with severe COVID-19. Nat. Med.26, 1070–1076 (2020). - PMC - PubMed
    1. Kamath, T. et al. A molecular census of midbrain dopaminergic neurons in Parkinson’s disease. bioRxiv10.1101/2021.06.16.448661 (2021).
    1. Boiarsky, R. et al. Single cell characterization of myeloma and its precursor conditions reveals transcriptional signatures of early tumorigenesis. Nat. Commun.13, 7040 (2022). - PMC - PubMed
    1. Aissa, A. F. et al. Single-cell transcriptional changes associated with drug tolerance and response to combination therapies in cancer. Nat. Commun.12, 1628 (2021). - PMC - PubMed

Publication types

Associated data

LinkOut - more resources