. 2024 Nov 1;15(1):9432.
doi: 10.1038/s41467-024-53628-0.

ChromaFold predicts the 3D contact map from single-cell chromatin accessibility

Affiliations

ChromaFold predicts the 3D contact map from single-cell chromatin accessibility

Vianne R Gao et al. Nat Commun. .

Erratum in

  • Author Correction: ChromaFold predicts the 3D contact map from single-cell chromatin accessibility.
    Gao VR, Yang R, Das A, Luo R, Luo H, McNally DR, Karagiannidis I, Rivas MA, Wang ZM, Barisic D, Karbalayghareh A, Wong W, Zhan YA, Chin CR, Noble WS, Bilmes JA, Apostolou E, Kharas MG, Béguelin W, Viny AD, Huangfu D, Rudensky AY, Melnick AM, Leslie CS. Gao VR, et al. Nat Commun. 2025 Jan 15;16(1):684. doi: 10.1038/s41467-025-56017-3. Nat Commun. 2025. PMID: 39814735 Free PMC article. No abstract available.

Abstract

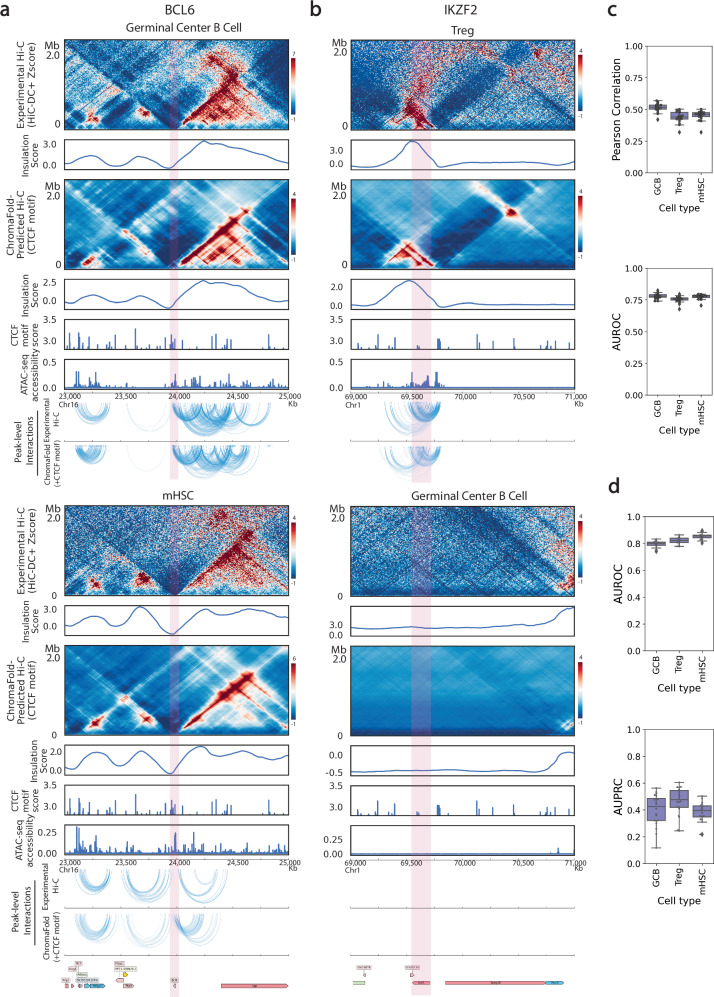
Identifying cell-type-specific 3D chromatin interactions between regulatory elements can help decipher gene regulation and interpret disease-associated non-coding variants. However, achieving this resolution with current 3D genomics technologies is often infeasible given limited input cell numbers. We therefore present ChromaFold, a deep learning model that predicts 3D contact maps, including regulatory interactions, from single-cell ATAC sequencing (scATAC-seq) data alone. ChromaFold uses pseudobulk chromatin accessibility, co-accessibility across metacells, and a CTCF motif track as inputs and employs a lightweight architecture to train on standard GPUs. Trained on paired scATAC-seq and Hi-C data in human samples, ChromaFold accurately predicts the 3D contact map and peak-level interactions across diverse human and mouse test cell types. Compared to leading contact map prediction models that use ATAC-seq and CTCF ChIP-seq, ChromaFold achieves state-of-the-art performance using only scATAC-seq. Finally, fine-tuning ChromaFold on paired scATAC-seq and Hi-C in a complex tissue enables deconvolution of chromatin interactions across cell subpopulations.


Conflict of interest statement

C.S.L. is an SAB member and co-inventor of IP with Episteme Prognostics, unrelated to the current study. M.G.K is a member of the scientific advisory board of 858 Therapeutics and the laboratory gets research support from AstraZeneca and Transition Bio. A.D.V. is an SAB member of Arima Genomics. A.Y.R. is an SAB member and has equity in Sonoma Biotherapeutics, Santa Ana Bio, RAPT Therapeutics, and Vedanta Biosciences. He is an SEB member of Amgen and BioInvent and is a co-inventor or has IP licensed to Takeda that is unrelated to the content of the present study. A.M.M. has research funding from Janssen, Epizyme, and Daiichi Sankyo. A.M.M. has consulted for Exo Therapeutics, Treeline Biosciences, and AstraZeneca. The remaining authors declare no competing interests.

Figures

Fig. 1
Fig. 1. ChromaFold predicts the 3D contact map from scATAC-seq alone.
ChromaFold is a deep-learning model that enables the prediction of 3D contact maps solely from scATAC-seq data, using pseudobulk chromatin accessibility and co-accessibility from scATAC-seq as well as predicted CTCF motif tracks as input features. a Schematic of the ChromaFold input data processing framework. b ChromaFold model architecture. The model consists of two feature extractors: feature extractor 1 for the aggregated accessibility and CTCF motif score tracks with a bin size of 50 bp, and feature extractor 2 for the co-accessibility extracted from a V-stripe region with a bin size of 500 bp. The feature extractors produce a latent representation of the 4 Mb genomic region. The Z-score predictor then takes this latent representation and predicts the chromatin interactions between the center genomic tile and its neighboring bins within a 2 Mb distance, annotated by the V-shaped black box. Each genomic tile is 10Kb in length.
Fig. 2
Fig. 2. Co-accessibility information improves contact map prediction in new cell types.
a Visualization of real vs. ChromaFold-predicted Hi-C contact map, insulation scores, epigenetic tracks, and co-accessibility on held-out chromosome 5 in HUVEC. b Quantitative evaluation of Hi-C map prediction performance by ChromaFold, with and without the co-accessibility input, across training and held-out human cell types/tissues. Box plots show (top) the averaged distance-stratified Pearson correlation for each of n = 4 held-out chromosomes between the experimental and predicted contact map and (bottom) the averaged distance-stratified AUROC for each held-out chromosome of significant interactions (top 10% in Z-score). Performance comparisons were assessed by one-sided paired t-tests on the distance-stratified Pearson correlation across four test chromosomes from 10 Kb to 2 Mb incrementing by 10 Kb, consisting of n = 796 pairs. The p value for the Pearson correlation of the full model vs. no co-accessibility model from left to right is <10−16 for IMR-90, <10−16 for HUVEC, <10−16 for GM12878, <10−16 for CD4+ activated T cells, 0.999 for hESC and <10−16 for K562 (top); the p value for the AUROC is <10−16 for IMR-90, <10−16 for HUVEC, <10−16 for GM12878, <10−16 for CD4+ activated T cells, 1.95 × 10−7 for hESC and <10−16 for K562 (bottom); legend *: <0.05, **: <0.01, ***: <0.001. c Visualization of ChromaFold-predicted Hi-C contact map and significant peak-level interactions and Cicero-predicted peak-level interactions in held-out cell type K562 on held-out chromosome 5. d Quantitative evaluation of significant peak-level prediction performance by ChromaFold and Cicero. Box plots show the AUPRC (top) and AUROC (bottom) of significant peak-level interaction prediction for each of n = 4 held-out chromosomes. Performance comparisons were assessed by one-sided paired t-tests on the distance-stratified AUROC and AUPRC across four test chromosomes from 10 to 500 Kb incrementing by 10 Kb, consisting of n = 196 pairs. The p value for the AUPRC of ChromaFold vs. ChromaFold no co-accessibility from left-to-right is <10−16 for IMR-90, <10−16 for HUVEC, <3.69 × 10−5 for GM12878, <10−16 for CD4+ T cells, 0.782 for hESC and <1.35 × 10−9 for K562 (top). The p value for the AUROC is <10−16 for IMR-90, <10−16 for HUVEC, <10−16 for GM12878, <10−16 for CD4+ T cells, 3.41 × 10−4 for hESC and 3.20 × 10−7 for K562 (bottom). The p values for both ChromaFold models vs. Cicero are <10−16. In b, d, boxes show the quartiles of the dataset while the whiskers extend to show the rest of the distribution, except for points greater or less than 1.5 times the inter-quartile range from the first or third quartile respectively. Source data are provided as a Source Data file.
Fig. 3
Fig. 3. ChromaFold achieves state-of-the-art performance for predicting significant Hi-C interactions in new cell types.
C.Origami and ChromaFold were trained using the same training/test chromosomes on IMR-90 to predict contact maps normalized by HiC-DC+ Z-score. a Visualization of C.Origami and ChromaFold-predicted Hi-C contact maps and peak-level interactions in held-out cell type GM12878. b Line plots show distance-stratified (top) Pearson correlation between the experimental and predicted contact map, (middle) AUROC and (bottom) AUPRC of significant interactions (top 10% in Z-score) for ChromaFold and C.Origami on held-out chromosome 15. c Line plots show (top) PR curves and (bottom) ROC curves for peak-level interaction prediction on held-out chromosome 15. Source data are provided as a Source Data file.
Fig. 4
Fig. 4. ChromaFold accurately generalizes across cell types and species.
a, b Comparison of experimental vs. ChromaFold-predicted Hi-C contact map and peak-level interactions at different loci in the mouse genome across different murine cell types: the Bcl6 gene locus in mouse germinal center B cells (a, top) and in mHSC (a, bottom) and the Ikzf2 gene locus in regulatory T cells (b, top) and germinal center B cells (b, bottom). c Box plots show (top) the averaged distance-stratified Pearson correlation between the experimental and predicted contact map and AUROC of predicted significant interactions (bottom; top 10% in Z-score) from 10 kb to 2 Mb for n = 20 chromosomes. d Box plots show the distance-stratified AUROC(top) and AUPR (bottom) of significant peak-level interaction prediction from 10 to 500 kb for n = 20 chromosomes across mouse cell types. In c, d, boxes show the quartiles of the dataset while the whiskers extend to show the rest of the distribution, except for points greater or less than 1.5 times the inter-quartile range from the first or third quartile respectively. Source data are provided as a Source Data file.
Fig. 5
Fig. 5. ChromaFold enables deconvolution of Hi-C interactions in pancreatic islet cells.
a, b Visualization of peak-level interactions derived from experimental Hi-C data and ChromaFold-predicted Hi-C map in alpha cells and beta cells near the TSS of (a) glucagon (GCG) and (b) insulin (INS). c Box plots show (top) the averaged distance-stratified Pearson correlation and AUROC of significant interactions (top 10% in Z-score), for n = 4 test chromosomes from 10 Kb to 2 Mb in alpha and beta cells. d Box plots show the AUPRC (top) and AUROC (bottom) of significant peak-level interaction prediction for n = 4 test chromosomes from 10 Kb to 2 Mb in alpha and beta cells. In c, d boxes show the quartiles of the dataset while the whiskers extend to show the rest of the distribution, except for points greater or less than 1.5 times the inter-quartile range from the first or third quartile respectively.

Update of

References

    1. Van Berkum, N. L. et al. Hi-C: a method to study the three-dimensional architecture of genomes. J. Vis. Exp.6, e1869 (2010). - PMC - PubMed
    1. Mumbach, M. R. et al. HiChIP: efficient and sensitive analysis of protein-directed genome architecture. Nat. Methods13, 919–922 (2016). - PMC - PubMed
    1. Fullwood, M. J. et al. An oestrogen-receptor-α-bound human chromatin interactome. Nature462, 58–64 (2009). - PMC - PubMed
    1. Lieberman-Aiden, E. et al. Comprehensive mapping of long-range interactions reveals folding principles of the human genome. Science326, 289–293 (2009). - PMC - PubMed
    1. Krijger, P. H. L. & De Laat, W. Regulation of disease-associated gene expression in the 3D genome. Nat. Rev. Mol. cell Biol.17, 771–782 (2016). - PubMed

Publication types

Associated data

LinkOut - more resources