. 2024 Nov 1;15(1):9461.
doi: 10.1038/s41467-024-53814-0.

Dietary nucleic acids promote oral tolerance through innate sensing pathways in mice

Affiliations

Dietary nucleic acids promote oral tolerance through innate sensing pathways in mice

Tao Yang et al. Nat Commun. .

Abstract

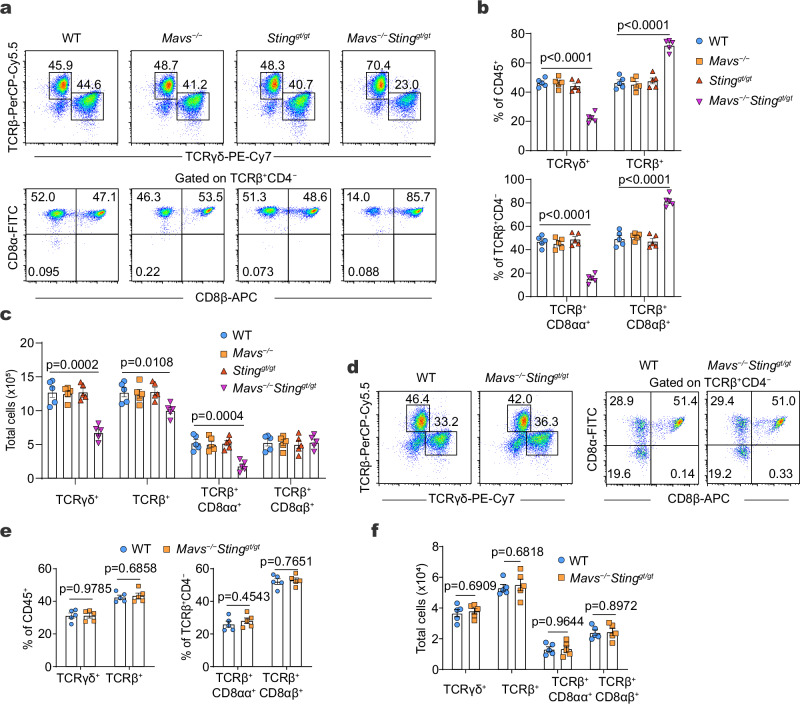
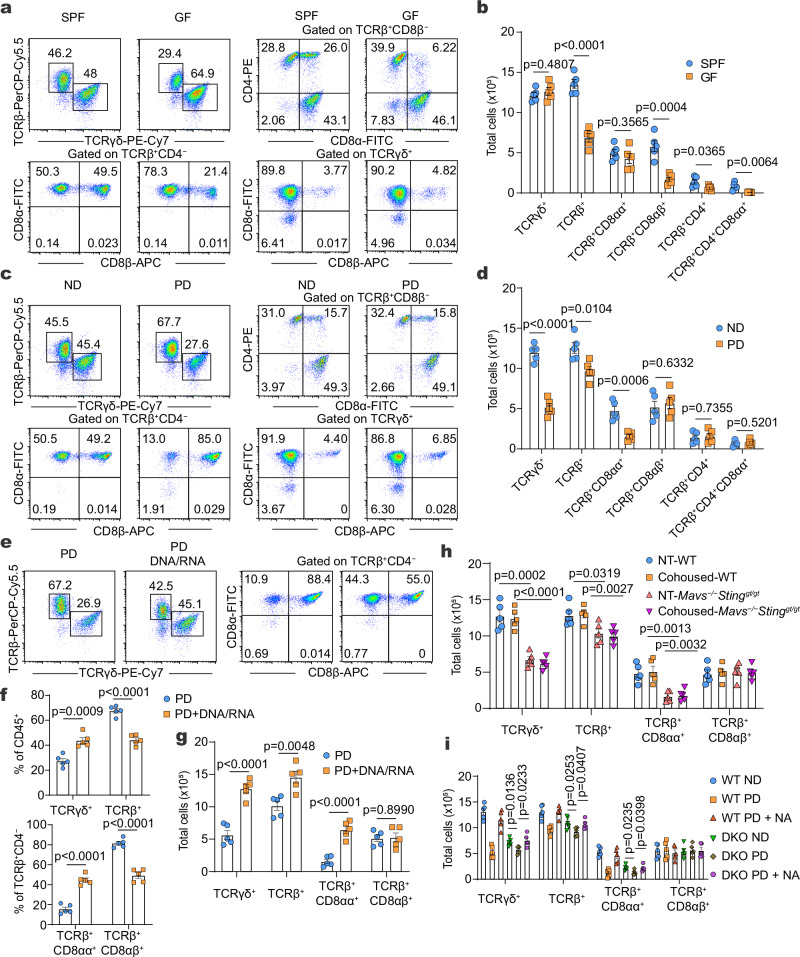
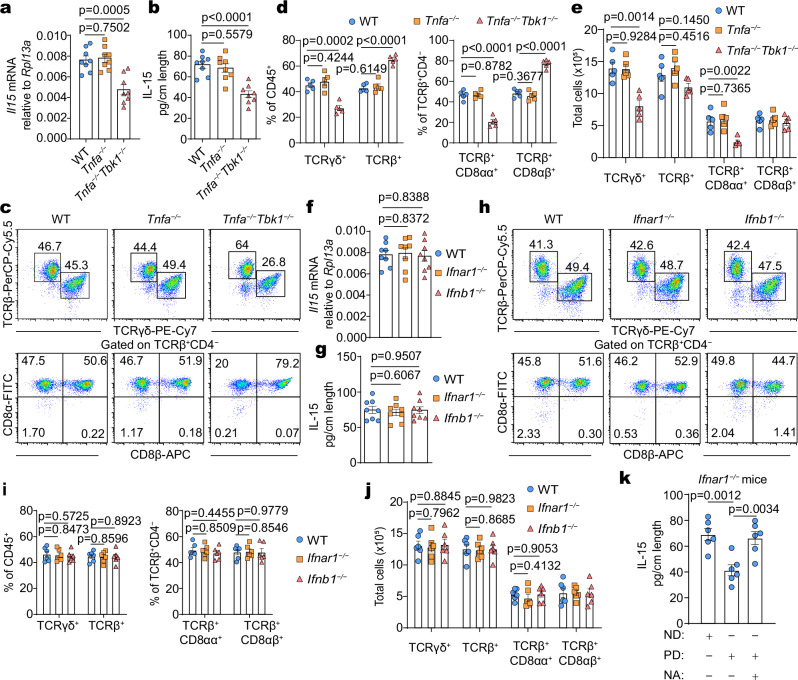
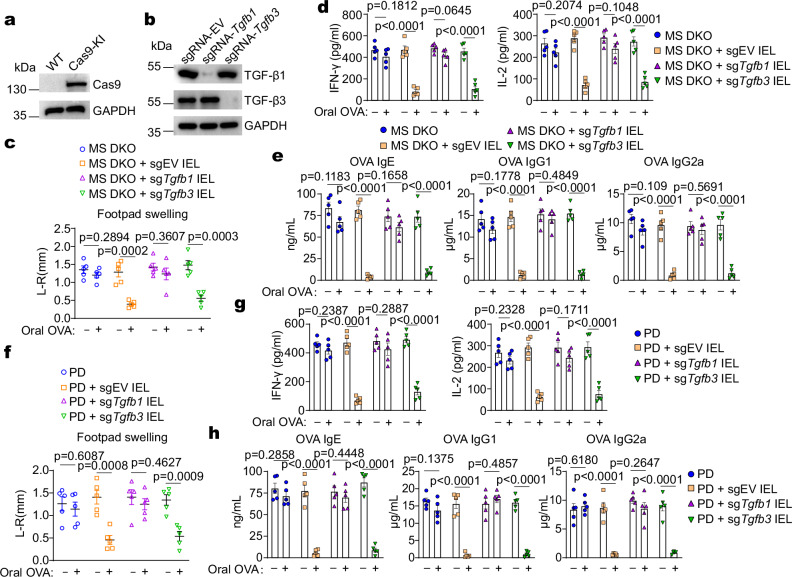
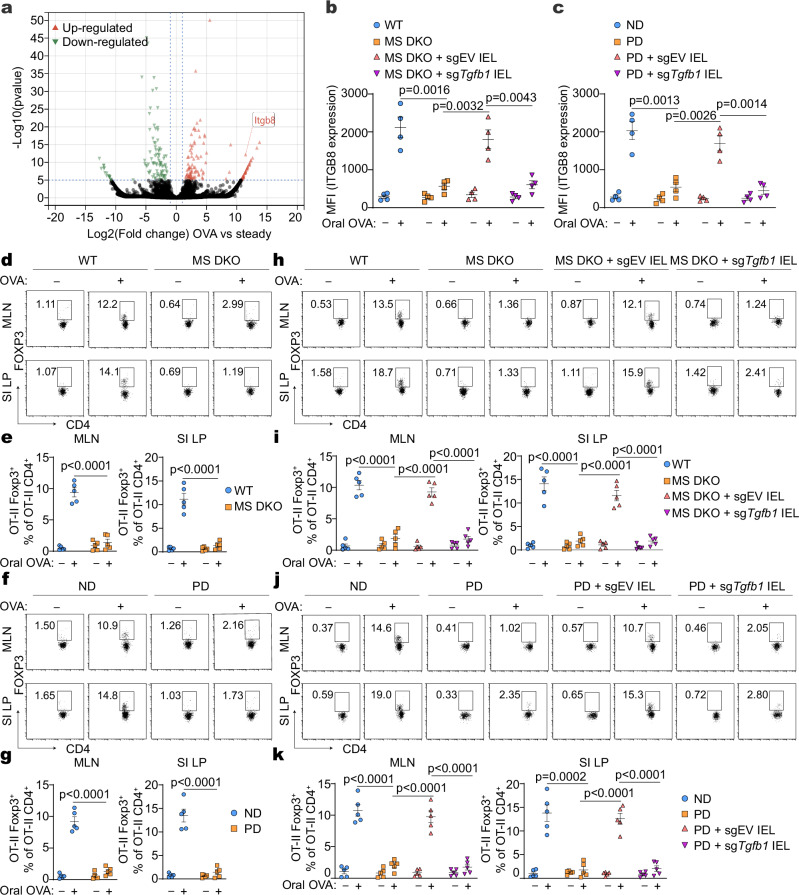
Oral tolerance is essential for intestinal homeostasis and systemic immune function. However, our understanding of how oral tolerance is maintained is inadequate. Here we report that food-derived nucleic acids promote oral tolerance through innate sensing pathways. We find that dietary nucleic acids, but not microbiota, expand the natural intraepithelial lymphocyte (IEL) pool, specifically in the small intestine. TGF-β1, produced by natural IELs, then promotes activation of gut CD103+ dendritic cells to support the induction of antigen-specific Treg cells in a mouse model of OVA-induced oral tolerance. Mechanistically, MAVS and STING are redundantly required for sensing dietary RNAs and DNAs to activate downstream TBK1 signalling to induce IL-15 production, which results in the accumulation of natural IELs. Thus, our study demonstrates a key role of food-triggered innate sensing pathways in the maintenance of natural IELs and oral tolerance.


Conflict of interest statement

The authors declare no competing interests.

Figures

Fig. 1
Fig. 1. MAVS and STING signaling pathways are redundantly required for the development of natural IELs in the small intestine.
ac Representative flow plots (a), cell percentages (b), and cell numbers (c) of small intestinal IELs from WT, Mavs−/−, Stinggt/gt, or Mavs−/−Stinggt/gt mice, n = 5. df Representative flow plots (d), cell percentages (e), and cell numbers (f) of colon IELs from WT or Mavs−/−Stinggt/gt mice, n = 5. Data are mean ± s.e.m. and from one experiment representative of three independent experiments. Statistics: one-way ANOVA followed by the Bonferroni post hoc test (b, c) or two-tailed, Student’s t tests (e, f). Source data are provided as a Source Data file.
Fig. 2
Fig. 2. Dietary nucleic acids promote the development of natural IELs in the small intestine.
a, b Representative flow plots (a) or cell numbers (b) of small intestinal IEL subsets from SPF or GF mice, n = 5. c, d Representative flow plots (c) or cell numbers (d) of small intestinal IELs from C57BL/6 mice fed normal diet (ND) or purified diet (PD) for 6 weeks after their weaning, n = 5. eg Representative flow plots (e) or cell percentages (f) and cell numbers (g) of small intestinal IELs from C57BL/6 mice fed PD with or without supplement of 0.5% purified nucleic acids (0.25% purified salmon testes DNA and 0.25% purified yeast RNA, DNA/RNA) for 6 weeks after their weaning, n = 5. h The cell numbers of the indicated small intestinal IEL subsets from wild type (WT) or Mavs−/−Stinggt/gt mice which were kept in separate cages (NT) or co-housed cages for 1 month, n = 5. i The absolute cell numbers of the indicated IEL subsets in the small intestine from WT mice or Mavs−/−Stinggt/gt mice fed ND or PD with or without a supplement of 0.5% purified nucleic acids for 6 weeks after their weaning, n = 5. Data are mean ± s.e.m. and from one experiment representative of two (a, b, h, and i) or three independent experiments (cg). Statistics: one-way ANOVA followed by the Bonferroni post hoc test (h, i) or two-tailed, Student’s t tests (b, d, f, and g). Source data are provided as a Source Data file.
Fig. 3
Fig. 3. Dietary nucleic acids maintain small intestine natural IELs via IL-15.
a The absolute cell numbers of small intestinal IELs from the indicated BM chimeras of WT BM cells into irradiated WT or Mavs−/−Stinggt/gt mice, or of Mavs−/−Stinggt/gt BM cells into irradiated WT or Mavs−/−Stinggt/gt mice, n = 5. b Quantification of the expression of Il15 at the mRNA level by qPCR or protein level by ELISA in the small intestine from WT or Mavs−/−Stinggt/gt mice intravenously injected with AdV-EV or AdV-IL-15 adenovirus, n = 5. ce Representative flow plots (c) or cell percentages (d) and cell numbers (e) of small intestinal IELs from Mavs−/−Stinggt/gt mice treated with AdV-EV or AdV-IL-15 adenovirus, n = 5. f Quantification of the expression of Il15 at the mRNA level by qPCR or protein level by ELISA in the small intestine from C57BL/6 mice fed ND or PD with or without supplement of 0.5% purified nucleic acids, n = 8. g Quantification of the expression of Il15 at the mRNA level by qPCR or protein level by ELISA in the small intestine from C57BL/6 mice that were pre-fed ND or PD, and then intravenously injected with or without AdV-EV or AdV-IL-15 adenovirus, n = 5. hj Representative flow plots (h) or cell percentages (i) and cell numbers (j) of small intestinal IELs from C57BL/6 mice that were fed PD and treated with AdV-EV or AdV-IL-15 adenovirus, n = 5. Data are mean ± s.e.m. and from one experiment representative of two (a, b, f, g) or three independent experiments (ce, hj). Statistics: one-way ANOVA followed by the Bonferroni post hoc test (a, b, dg, i, j). Source data are provided as a Source Data file.
Fig. 4
Fig. 4. MAVS and STING signaling pathways maintain natural IELs in a TBK1-dependent but IFN-I-independent manner.
a, b Quantification of the expression of Il15 at the mRNA level by qPCR (a) or protein level by ELISA (b) in the small intestine from WT, Tnfa−/−, or Tnfa−/−Tbk1−/−mice, n = 8. ce Representative flow plots (c), cell percentages (d) and cell numbers (e) of small intestinal IELs from WT, Tnfa−/−, or Tnfa−/−Tbk1−/− mice, n = 5. f, g Quantification of the expression of Il15 at the mRNA level by qPCR (f) or protein level by ELISA (g) in the small intestine from WT, Ifnar1−/− or Ifnb1−/− mice, n = 8. hj Representative flow plots (h), cell percentages (i) and cell numbers (j) of small intestinal IELs from WT, Ifnar1−/− or Ifnb1−/− mice, n = 6. k Quantification of the expression of IL-15 by ELISA in the small intestine from Ifnar1−/− mice fed ND or PD with or without supplement of 0.5% purified nucleic acids (NA), n = 6. Data are shown as mean ± s.e.m. and from one experiment representative of two (a, b, f, g, k) or three independent experiments (ce, hj). The P values were determined using one-way ANOVA followed by the Bonferroni post hoc test (a, b, dg, ik). Source data are provided as a Source Data file.
Fig. 5
Fig. 5. Dietary nucleic acids promote protein antigen (OVA)-induced oral tolerance through natural IELs.
ac C57BL/6 mice pre-fed ND or PD without or with NA (0.5% purified nucleic acids) for 6 weeks after their weaning followed by induction of OVA-mediated oral tolerance, then DTH responses were measured (a), the effector cytokines of total spleen cells (b) or serum OVA-specific antibody levels (c) were analyzed by ELISA, n = 5. df C57BL/6 mice pre-fed ND or PD for 6 weeks after their weaning, transferred with or without natural CD8αα+ IELs in the last 2 weeks, and then followed by induction of OVA-mediated oral tolerance (n = 5), then DTH responses were measured (d), the effector cytokines of total spleen cells (e) or serum OVA-specific antibody levels (f) were analyzed, n = 5. gi PD-fed mice transferred with TCRγδ+ IELs or TCRβ+CD8αα+ IELs followed by OVA-mediated oral tolerance, then DTH responses were measured (g), the effector cytokines of total spleen cells (h) or serum OVA-specific antibody levels (i) were analyzed, n = 5. jl WT or MS DKO mice transferred with or without natural CD8αα+ IELs followed by OVA-mediated oral tolerance, then DTH responses were measured (j), the effector cytokines of total spleen cells (k) or serum OVA-specific antibody levels (l) were analyzed, n = 5. Data are mean ± s.e.m. and from one experiment representative of two independent experiments (al). Statistics: two-tailed Student’s t test. Source data are provided as a Source Data file.
Fig. 6
Fig. 6. Natural IELs-derived TGF-β1 promote OVA-induced oral tolerance.
a Immunoblot analysis of the expression of transgenic CRISPR-Cas9 in natural CD8αα+ IELs. b Immunoblot analysis of the expression of TGF-β1 and TGF-β3 in natural CD8αα+ IELs by sgRNA-targeted knock-down. ce MS DKO mice were first transferred without or with sgEV, sgTgfb1, or sgTgfb3 natural CD8αα+ IELs followed by induction of OVA-mediated oral tolerance (n = 5), then DTH responses were measured (c), the effector cytokines of total spleen cells (d) or serum OVA-specific antibody levels (e) were analyzed. fh C57BL/6 mice that were pre-fed PD for 6 weeks after their weaning, then transferred without or with sgEV, sgTgfb1, or sgTgfb3 natural CD8αα+ IELs in the last 2 weeks, and followed by induction of OVA-mediated oral tolerance (n = 5), then DTH responses were measured (f), the effector cytokines of total spleen cells (g) or serum OVA-specific antibody levels (h) were analyzed. Data are mean ± s.e.m. and from one experiment representative of two (a, b) or three (ch) independent experiments. Statistics: two-tailed Student’s t test. Source data are provided as a Source Data file.
Fig. 7
Fig. 7. Natural IELs promote the development of antigen-specific Tregs for OVA-induced oral tolerance through CD103+ DCs.
a Volcano map of differentially expressed genes (p value < 0.01 and Log2 fold change >1) in small intestine lamina propria CD103+ DCs sorted from WT mice at steady conditions or after OVA gavage for 3 days. b, c Flow cytometry analysis of β8 expression in sorted small intestinal CD103+CD11b DCs from below mice (n = 4) treated with or without OVA for three days. WT mice and MS DKO mice that were first transferred without or with sgEV or sgTgfb1 natural CD8αα+ IELs (b); ND or PD pre-fed C57BL/6 mice that were first transferred without or with sgEV or sgTgfb1 natural CD8αα+ IELs (c). dk Flow analysis of percentages of OVA-specific Tregs in the mesenteric lymph node (MLN) or small intestine lamina propria (SI LP) from below mice transferred with CD45.1+ OT-II cells, followed by orally treated with OVA or PBS for one week (n = 5). Representative flow plots and cell percentages were shown. WT and MS DKO mice (d, e); ND or PD pre-fed C57BL/6 mice (f, g); WT mice and MS DKO mice that were first transferred without or with sgEV or sgTgfb1 natural CD8αα+ IELs (h, i); ND or PD pre-fed C57BL/6 mice that were first transferred without or with sgEV or sgTgfb1 natural CD8αα+ IELs (j, k). Data are mean ± s.e.m. and from one experiment representative of two independent experiments. Statistics: two-tailed Student’s t test (b, c, e, j, i, k). Source data are provided as a Source Data file.

References

    1. Hooper, L. V., Littman, D. R. & Macpherson, A. J. Interactions between the microbiota and the immune system. Science336, 1268–1273 (2012). - PMC - PubMed
    1. Garrett, W. S., Gordon, J. I. & Glimcher, L. H. Homeostasis and inflammation in the intestine. Cell140, 859–870 (2010). - PMC - PubMed
    1. Jain, N. & Walker, W. A. Diet and host-microbial crosstalk in postnatal intestinal immune homeostasis. Nat. Rev. Gastroenterol. Hepatol.12, 14–25 (2015). - PMC - PubMed
    1. Mowat, A. M. Anatomical basis of tolerance and immunity to intestinal antigens. Nat. Rev. Immunol.3, 331–341 (2003). - PubMed
    1. Rezende, R. M. & Weiner, H. L. History and mechanisms of oral tolerance. Semin Immunol.30, 3–11 (2017). - PubMed

Publication types

MeSH terms

LinkOut - more resources