. 2024 Nov 1;15(1):9463.
doi: 10.1038/s41467-024-53559-w.

Increased DNA damage in full-grown oocytes is correlated with diminished autophagy activation

Affiliations

Increased DNA damage in full-grown oocytes is correlated with diminished autophagy activation

Fei Sun et al. Nat Commun. .

Abstract

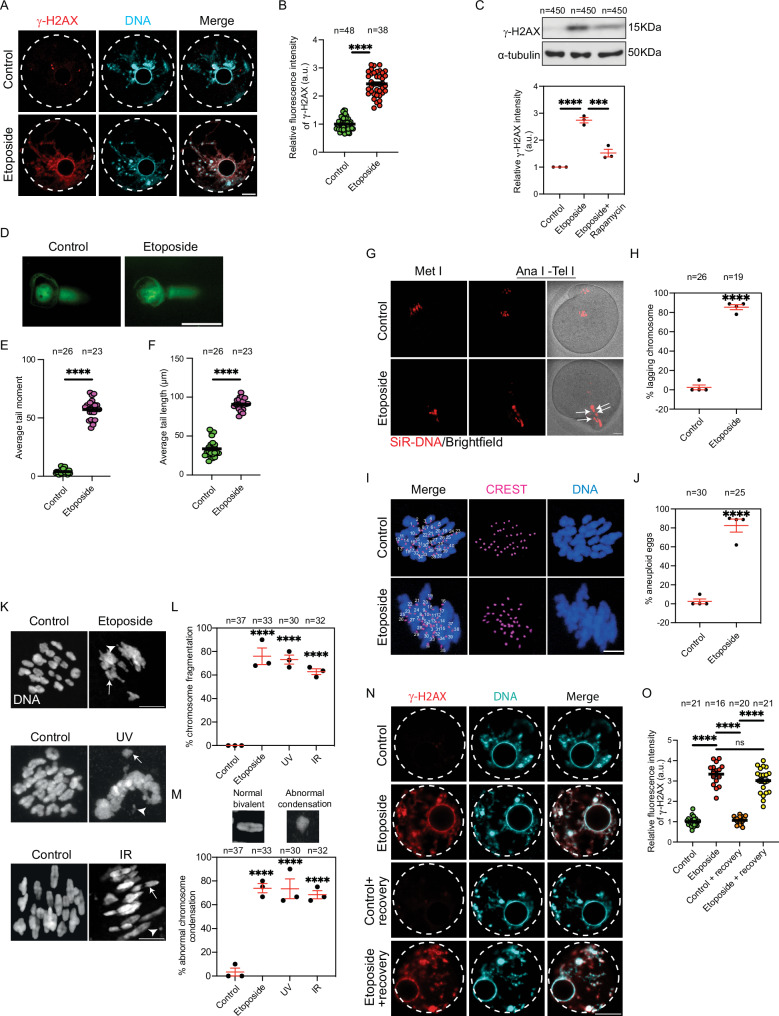
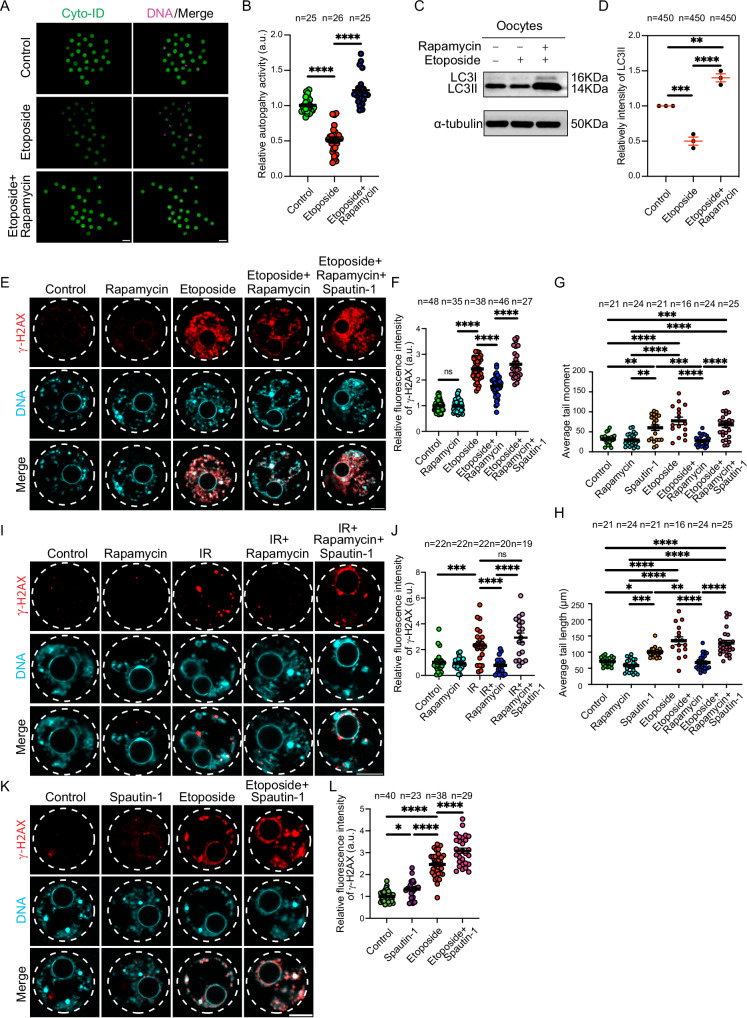
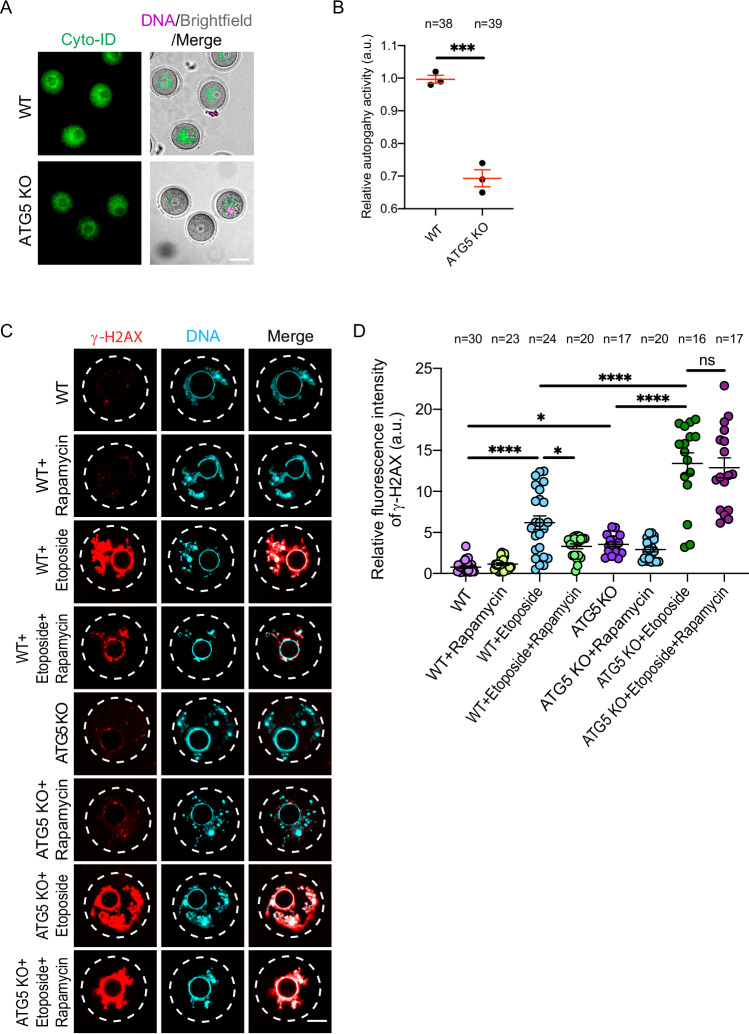
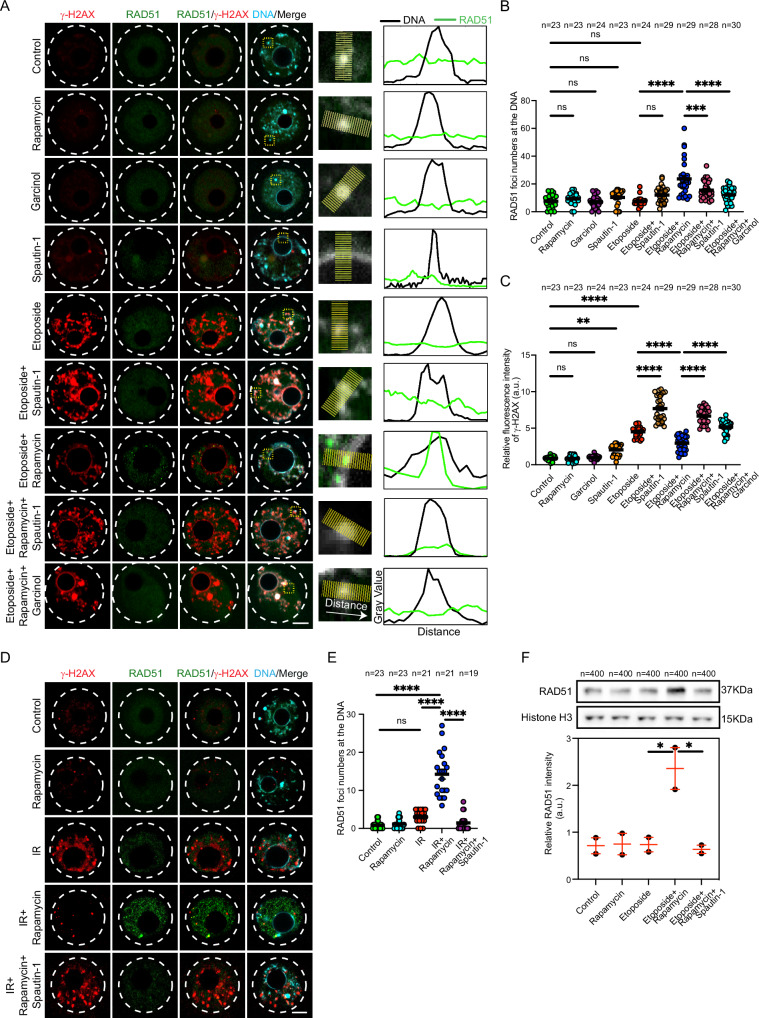
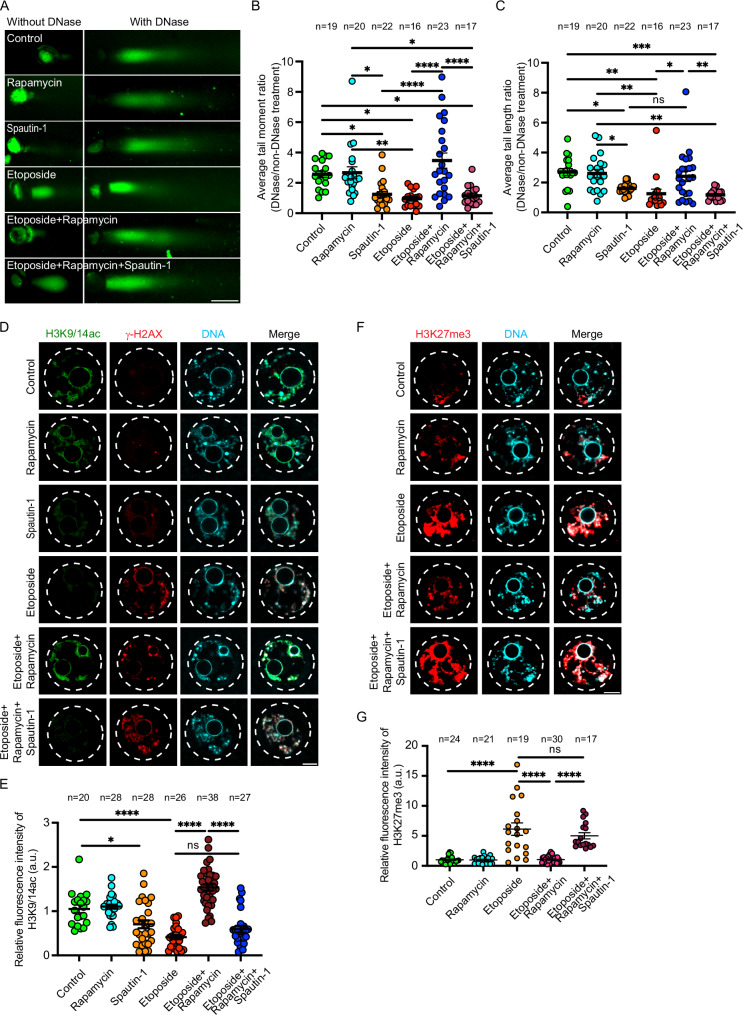
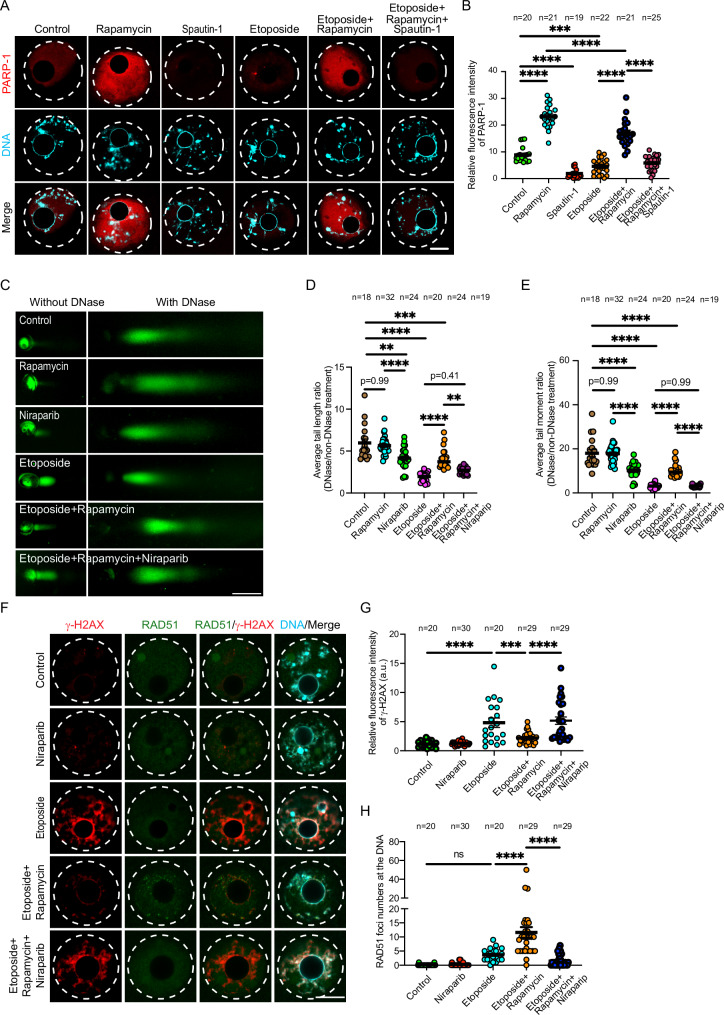
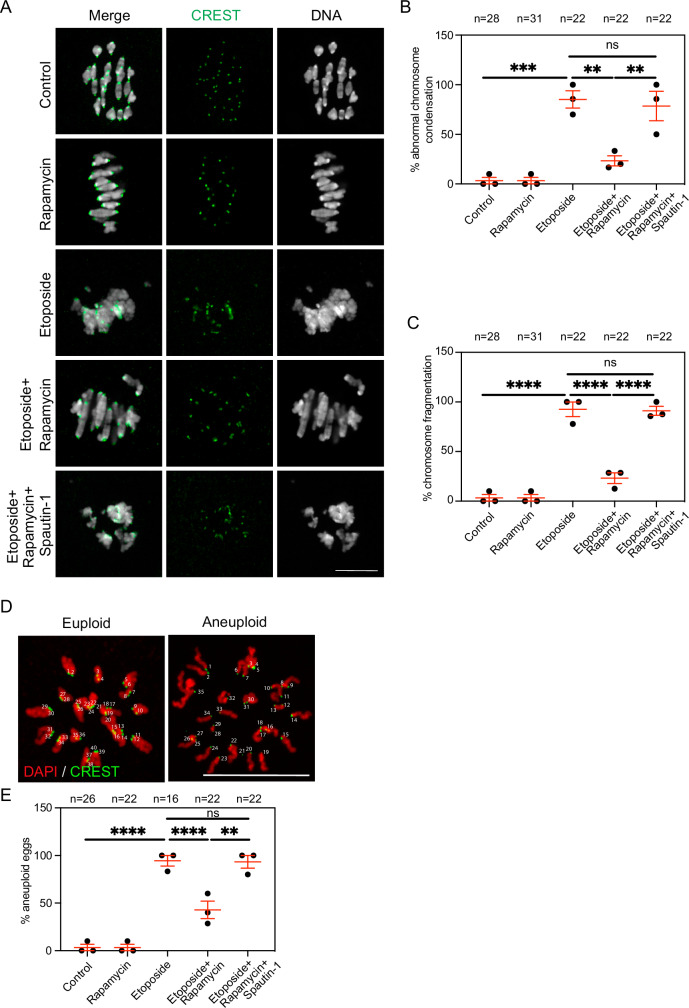
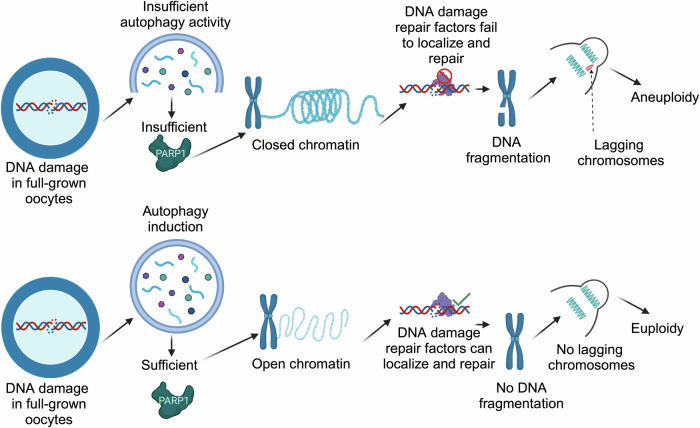
Unlike mild DNA damage exposure, DNA damage repair (DDR) is reported to be ineffective in full-grown mammalian oocytes exposed to moderate or severe DNA damage. The underlying mechanisms of this weakened DDR are unknown. Here, we show that moderate DNA damage in full-grown oocytes leads to aneuploidy. Our data reveal that DNA-damaged oocytes have an altered, closed, chromatin state, and suggest that the failure to repair damaged DNA could be due to the inability of DDR proteins to access damaged loci. Our data also demonstrate that, unlike somatic cells, mouse and porcine oocytes fail to activate autophagy in response to DNA double-strand break-inducing treatment, which we suggest may be the cause of the altered chromatin conformation and inefficient DDR. Importantly, autophagy activity is further reduced in maternally aged oocytes (which harbor severe DNA damage), and its induction is correlated with reduced DNA damage in maternally aged oocytes. Our findings provide evidence that reduced autophagy activation contributes to weakened DDR in oocytes, especially in those from aged females, offering new possibilities to improve assisted reproductive therapy in women with compromised oocyte quality.


Conflict of interest statement

The authors declare no competing interests.

Figures

Fig. 1
Fig. 1. DNA-damaged oocytes progress through meiosis I resulting in aneuploidy.
A Full-grown germinal vesicle (GV) oocytes were incubated in milrinone-containing CZB medium supplemented with DMSO (control) or 50 μg/ml etoposide for 3 h followed by immunostaining with γH2AX antibody. B Quantification of γH2AX fluorescence intensity. C Control and etoposide-treated GV oocytes were assessed by Western blot analysis. Quantification of γH2AX (lower panel). D Control and etoposide-treated GV oocytes were examined for DNA damage by alkaline comet assay. Scale bars represent 100 μm. E Quantification of DNA tail moment. F Quantification of DNA tail length. G Control and etoposide-treated GV oocytes were in vitro matured in CZB medium containing SiR-DNA. Shown are representative time-lapse images. The white arrow represents lagging chromosomes. H Quantification of lagging chromosome percentage. I Control and etoposide-treated GV oocytes were in vitro matured for metaphase II followed by in situ chromosome counting to assess aneuploidy. J Quantification of aneuploidy percentage. K Etoposide- ultraviolet B (UV)- or ionizing radiation (IR)- treated GV oocytes were assessed for DNA morphology at metaphase I. White arrows represent abnormal chromosome condensation and white arrow heads represent a fragmented chromosome. L Quantification of chromosome fragmentation percentage. M Quantification of abnormal chromosome condensation percentage. N Full-grown GV oocytes were incubated in milrinone-containing CZB medium supplemented with DMSO (control) or etoposide for 3 h. A subset of control and etoposide-treated oocytes were fixed after 3 h, whereas the remaining oocytes were released from etoposide and cultured in milrinone-containing CZB medium for 16 h (recovery) prior to fixation. The oocytes were immunostained with γH2AX antibody. O Quantification of γH2AX fluorescence intensity. DNA was labeled with DAPI. Scale bars represent 10 μm. The white dashed circle represents the nucleus. Data are expressed as mean ± SEM. Each dot in plot graphs represents an oocyte except C, H, J, L and M represents the average of an experimental replicate. Two-tailed Student-t-test (B, E, F, H and J), one-way ANOVA (C, L, M and O) were used to analyze the data. Values with asterisks are significantly different, ∗p < 0.05, ∗∗∗p < 0.001, ∗∗∗∗p < 0.0001. The total number of analyzed oocytes is specified above each graph/column. All experiments were replicated three times except G, H, I and J (four replicates). Source data are provided as a Source Data file.
Fig. 2
Fig. 2. Reduced autophagy is the likely cause of weakened DNA damage repair in oocytes.
A Full-grown germinal vesicle (GV) oocytes were incubated in milrinone-containing CZB medium supplemented with DMSO (control), etoposide or etoposide + rapamycin for 3 h followed by autophagy activity measurements by using Cyto-ID detection kit. Representative images are shown. Scale bar represents 100 μm. B Quantification of autophagy activity in A. C Full-grown GV oocytes (150 oocytes per group) were incubated in milrinone-containing CZB medium supplemented with the indicated treatments for 3 h followed by Western blot analysis with LC3 and α-tubulin antibodies. Representative images are shown. D Quantification of LC3II in C. Each dot in the plot graph represents the average of an experimental replicate. (E) Full-grown GV oocytes were incubated in milrinone-containing CZB medium supplemented with the indicated treatments for 3 h. Oocytes were fixed and immunostained with γH2AX antibody. Representative images are shown. Scale bar represents 10 μm. F Quantification of γH2AX fluorescence intensity in E. G, H Full-grown GV oocytes were incubated in milrinone-containing CZB medium supplemented with the indicated treatments for 3 h followed by alkaline comet assay to assess DNA tail moment (G) and DNA tail length (H), quantified from Fig. 5A. (I) Full-grown GV oocytes were exposed to ionizing radiation (IR, 1 Gy) and incubated with the indicated treatments in milrinone-containing CZB medium for 3 h followed by immunostaining with γH2AX antibody. Representative images are shown. Scale bar represents 10 μm. J Quantification of γH2AX fluorescence intensity in (I). K Full-grown GV oocytes were incubated in milrinone-containing CZB medium supplemented with the indicated treatments for 3 h. Oocytes were fixed and immunostained with γH2AX antibody. Representative images are shown. Scale bar represents 10 μm. L Quantification of γH2AX fluorescence intensity in (K). DNA was stained with DAPI. Data are expressed as mean ± SEM. Two-tailed Student-t-test (B), One-way ANOVA was used to analyze the data. Values with asterisks differ significantly, ∗p < 0.05, ∗∗p < 0.01, ∗∗∗p < 0.001, ∗∗∗∗p < 0.0001. The total number of analyzed oocytes (from three independent replicates) is specified above each graph. Source data are provided as a Source Data file.
Fig. 3
Fig. 3. ATG5-depleted oocytes are sensitive to a low level of DNA damage and exhibit elevated levels of DNA double-strand breaks.
A Full-grown wildtype (WT) or ATG5-depleted (ATG5 KO) germinal vesicle (GV) oocytes were assessed for autophagy activity by using Cyto-ID detection kit. Representative images are shown. Scale bar represents 50 μm. B Quantification of autophagy activity in A. C Full-grown WT or ATG5 KO GV oocytes were incubated in milrinone-containing CZB medium supplemented with the indicated treatments for 3 h followed by fixation and immunostaining with γH2AX antibody. Etoposide was used at a low concentration (10 μg/ml). Representative images are shown. DNA was stained with DAPI. Scale bar represents 10 μm. D Quantification of γH2AX fluorescence intensity in C. Data are expressed as mean ± SEM. One-way ANOVA was used to analyze the data. Values with asterisks differ significantly, ∗p < 0.05, ∗∗∗p < 0.001, ∗∗∗∗p < 0.0001. The total number of analyzed oocytes (from three independent replicates) is specified above each graph. Source data are provided as a Source Data file.
Fig. 4
Fig. 4. Autophagy promotes RAD51 recruitment to damaged DNA.
A Full-grown germinal vesicle (GV) oocytes were incubated in milrinone-containing CZB medium supplemented with the indicated treatments for 3 h. Oocytes were fixed and immunostained with RAD51 and γH2AX antibodies. Right panels represent zoomed examples of fluorescence intensity of RAD51 at the DNA using the plot profiles function in Image J. B Quantifications of the number of RAD51 foci localized at the DNA. C Quantifications of γH2AX fluorescence intensity. D Control and DNA-damaged oocytes (exposed to ionizing radiation, IR) were incubated in milrinone-containing CZB medium supplemented with the indicated treatments for 3 h. The oocytes were fixed at GV stage and immunostained with RAD51 and γH2AX antibodies. E Quantifications of the number of RAD51 foci localized at the DNA in (D). Shown are representative images. DNA was stained with DAPI. Scale bars represent 10 μm. F Full-grown GV oocytes were incubated with the indicated treatments for 3 h followed by chromatin extraction and Western blot analysis with RAD51 and Histone H3 antibodies. Quantification of RAD51 protein level (lower panel). Each dot in the plot graph represents the average of an experimental replicate. Data are expressed as mean ± SEM. One-way ANOVA was used to analyze the data. Values with asterisks differ significantly, ∗p < 0.05, ∗∗p < 0. 01, ∗∗∗p < 0.001, ∗∗∗∗p < 0.0001. The total number of analyzed oocytes from three independent replicates (4 F, two replicates) is specified above each graph. Source data are provided as a Source Data file.
Fig. 5
Fig. 5. Autophagy regulates chromatin remodeling in DNA-damaged oocytes.
A Full-grown germinal vesicle (GV) oocytes were incubated in milrinone-containing CZB medium supplemented with indicated treatments for 3 h. The DNase-treated and non-DNase-treated oocytes were subjected to the alkaline comet assay. Shown are representative images. Scale bar represents 100 μm. B Quantification of average DNA tail moment ratio (DNase/non-DNase treatment) in (A). C Quantification of average DNA tail length ratio (DNase/non-DNase treatment) in (A). D Full-grown GV oocytes were incubated in milrinone-containing CZB medium and exposed to the indicated treatments. The oocytes were fixed and immunostained with H3K9/14ac and γH2AX antibodies. Scale bar represents 10 μm. E Quantification of H3K9/14ac fluorescence intensity in (D). Shown are representative images. F Full-grown GV oocytes were incubated in milrinone-containing CZB medium and exposed to the indicated treatments. The oocytes were fixed and immunostained with H3K27me3 antibody. G Quantification of H3K27me3 fluorescence intensity in F. Shown are representative images. DNA was stained with DAPI. Scale bar represents 10 μm. Data are expressed as mean ± SEM. One-way ANOVA was used to analyze the data. Values with asterisks differ significantly, ∗p < 0.05, ∗∗p < 0.01, ∗∗∗p < 0.001, ∗∗∗∗p < 0.0001. The total number of analyzed oocytes (from three independent replicates) is specified above each graph. Source data are provided as a Source Data file.
Fig. 6
Fig. 6. Autophagy-induced PARP-1 activation regulates chromatin remodeling in DNA-damaged oocytes.
A, B Full-grown germinal vesicle (GV) oocytes were incubated with the indicated treatments for 3 h in milrinone-containing CZB medium followed by immunostaining with PARP-1 antibody. B Quantification of PARP-1 fluorescence intensity in (A). C Full-grown GV oocytes were cultured in milrinone-containing CZB medium and exposed to the indicated treatments. The DNase-treated and non-DNase-treated oocytes were subjected to the alkaline comet assay. Representative images are shown. Scale bars represent 100 μm. D Quantification of average DNA tail length ratio (DNase/non-DNase treatment). E Quantification of average DNA tail moment ratio (DNase/non-DNase treatment). F Full-grown GV oocytes were incubated in milrinone-containing CZB medium supplemented with the indicated treatments for 3 h. Oocytes were fixed and immunostained with γH2AX and RAD51 antibodies. G Quantification of γH2AX fluorescence intensity. H Quantification of RAD51 foci numbers at the DNA. DNA was stained with DAPI. Representative images are shown. Scale bars represent 10 μm. Data are expressed as mean ± SEM. One-way ANOVA was used to analyze the data. Values with asterisks differ significantly, ∗∗p < 0.01, ∗∗∗p < 0.001, ∗∗∗∗p < 0.0001. The total number of analyzed oocytes (from three independent replicates) is specified above each graph. Source data are provided as a Source Data file.
Fig. 7
Fig. 7. Autophagy induction rescues the consequences of DNA damage in mouse oocytes.
A Full-grown germinal vesicle (GV) oocytes were incubated with the indicated treatments for 3 h in milrinone-containing CZB medium followed by washing and in vitro maturation for 7 h (metaphase I) in milrinone-free CZB medium. Metaphase I oocytes were fixed and immunostained with CREST antibody to label kinetochores and stained with DAPI to label DNA. Representative images are shown. B Quantification of abnormal chromosome condensation phenotype in A. C Quantification of chromosome fragmentation phenotype in (A). D Full-grown GV oocytes were incubated with the indicated treatments for 3 h in milrinone-containing CZB medium followed by washing and in vitro maturation for 14 h (metaphase II). Oocytes were treated with monastrol for 2 h, fixed and immunostained with CREST antibody to label kinetochores. Oocytes were scored either as euploid (containing 40 kinetochores) or aneuploid (containing ± 40 kinetochores). Representative images are shown. E Quantification of aneuploidy percentage in D. Scale bars represent 10 μm. DNA was stained with DAPI. Data are expressed as mean ± SEM. Each dot in the plot graph represents the average of an experimental replicate. One-way ANOVA was used to analyze the data. Values with asterisks differ significantly, ∗∗p <0.01, ∗∗∗p < 0.001, ∗∗∗∗p < 0.0001. The total number of analyzed oocytes (from three independent replicates) is specified above each graph. Source data are provided as a Source Data file.
Fig. 8
Fig. 8. Schematic model summarizing the impact of DNA double-stand breaks on oocyte meiosis I and the role of autophagy in DNA damage repair.
Following the induction of DNA double-stand breaks in fully grown prophase I-arrested oocytes, autophagy activity does not increase, leading to insufficient PARP-1 levels, altered chromatin conformation, reduced localization of DNA damage repair factors to the DNA and an increased incidence of aneuploidy. Created in BioRender. Londono, A. (2023) BioRender.com/j60r980.

References

    1. Sun, H. et al. Global, regional, and national prevalence and disability-adjusted life-years for infertility in 195 countries and territories, 1990–2017: results from a global burden of disease study, 2017. Aging (Albany NY)11, 10952–10952 (2019). - PMC - PubMed
    1. Gerrits, T. et al. Infertility in the Global South: Raising awareness and generating insights for policy and practice. Facts Views Vis. ObGyn9, 39–39 (2017). - PMC - PubMed
    1. Centers for Disease, C. & Prevention. (2019).
    1. American College of, O. & Gynecologists. (2020).
    1. Hassold, T., Hall, H. & Hunt, P. The origin of human aneuploidy: where we have been, where we are going. Hum. Mol. Genet.16, R203–R208 (2007). - PubMed

Publication types

LinkOut - more resources