. 2024 Nov 1;15(1):9433.
doi: 10.1038/s41467-024-53613-7.

Human iPSC-derived neural stem cells displaying radial glia signature exhibit long-term safety in mice

Affiliations

Human iPSC-derived neural stem cells displaying radial glia signature exhibit long-term safety in mice

Marco Luciani et al. Nat Commun. .

Abstract

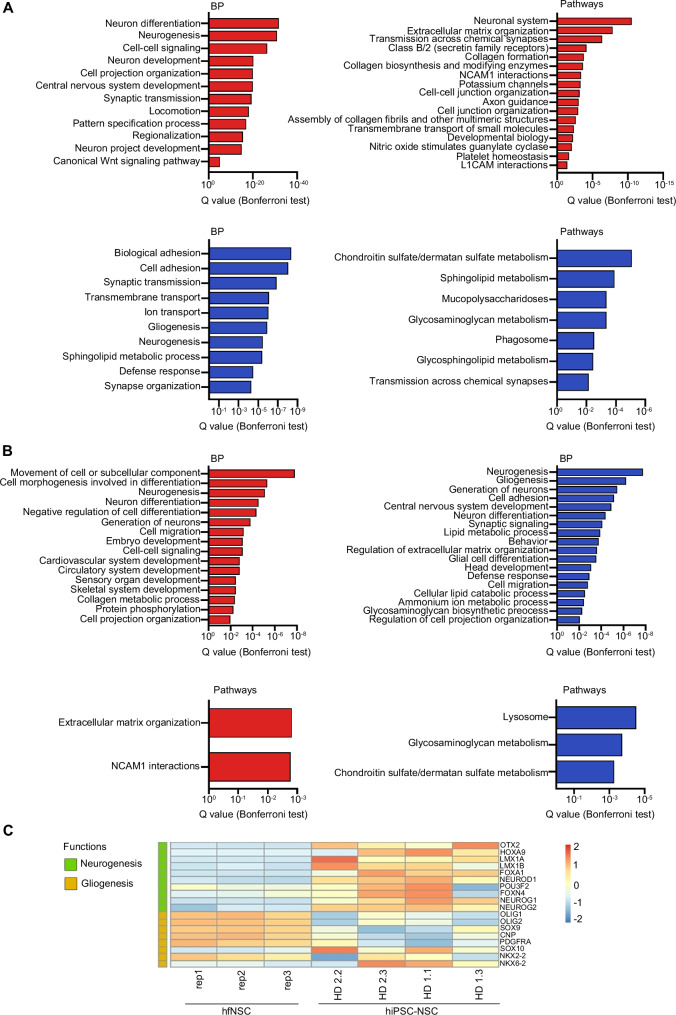
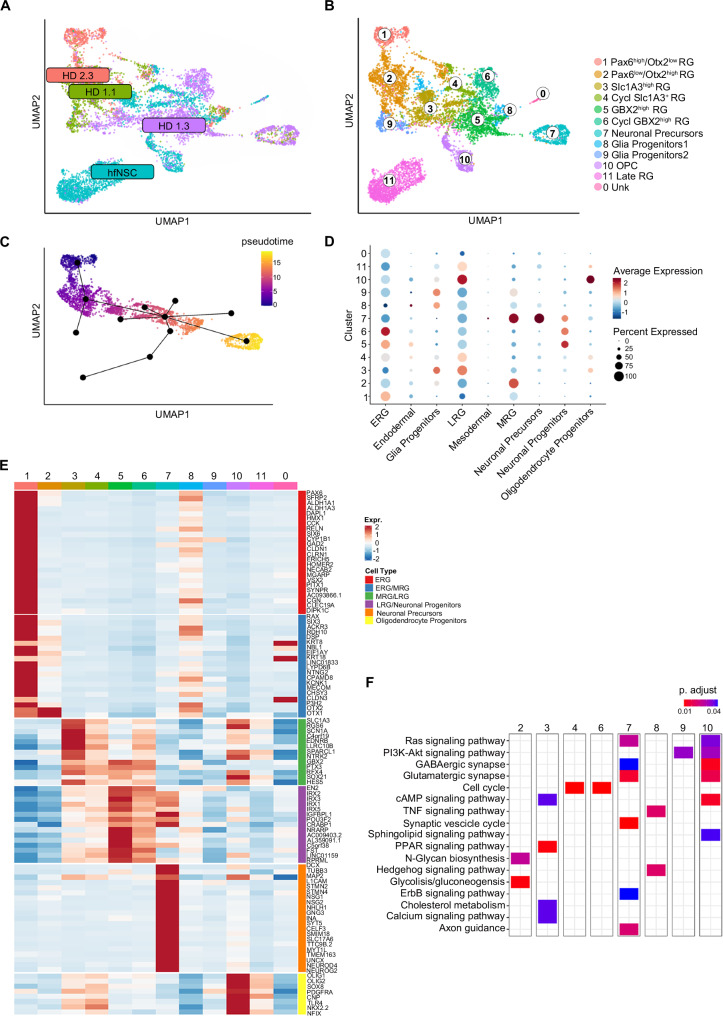
Human induced pluripotent stem cell-derived neural stem/progenitor cells (hiPSC-NSCs) hold promise for treating neurodegenerative and demyelinating disorders. However, comprehensive studies on their identity and safety remain limited. In this study, we demonstrate that hiPSC-NSCs adopt a radial glia-associated signature, sharing key epigenetic and transcriptional characteristics with human fetal neural stem cells (hfNSCs) while exhibiting divergent profiles from glioblastoma stem cells. Long-term transplantation studies in mice showed robust and stable engraftment of hiPSC-NSCs, with predominant differentiation into glial cells and no evidence of tumor formation. Additionally, we identified the Sterol Regulatory Element Binding Transcription Factor 1 (SREBF1) as a regulator of astroglial differentiation in hiPSC-NSCs. These findings provide valuable transcriptional and epigenetic reference datasets to prospectively define the maturation stage of NSCs derived from different hiPSC sources and demonstrate the long-term safety of hiPSC-NSCs, reinforcing their potential as a viable alternative to hfNSCs for clinical applications.


Conflict of interest statement

The authors declare no competing interests.

Figures

Fig. 1
Fig. 1. hiPSCs acquire a radial glia-associated transcriptional signature during neural commitment.
A Differentially expressed genes (DEGs) upregulated (red) and downregulated (blue) in hiPSC-NSCs vs. hiPSCs (left) and hiPSC-NSCs vs. hfNSCs (right) (log2 fold change ± 1, adjusted p-value < 0.05, Benjamini–Hochberg correction). The total number of DEGs in each comparative analysis is shown. Genes with relevant functions are labelled. B Heatmap of sample-to-sample distance among RNA-seq samples comparing hiPSCs vs. hiPSC-NSCs vs. hfNSCs. C Bar plots of pathways upregulated (red bars) or downregulated (blue bars) in hiPSC-NSCs vs. hiPSCs. D Heatmap showing the expression levels in hiPSCs and hiPSC-NSCs of genes involved in pluripotency, embryogenesis, mesodermal and endodermal differentiation, neural commitment, and synaptic signalling. The colour scale indicates the relative fold change of normalized expression levels of these genes in each sample (blue, low; red, high). E Heatmap of sample-to-sample distance among RNA-seq samples comparing hiPSCs vs. hiPSC-NSCs vs. hfNSCs vs. Embryonic Stem Cells (ESCs; 3 biological replicates (line H1) from, and 2 biological replicates (ESC) from) vs. ESC-derived neural populations (neuroepithelial cells (NE), early (ERG), middle (MRG), and late (LRG) radial glia cells; 2 replicates/cell population from). AE Analyses were performed in hiPSC clones HD 1.1, HD 1.3, HD 2.2 and HD 2.3 (p20-30); hiPSC-NSC clones HD 1.1 (p3), HD 1.3 (p5), HD 2.2 (p3), and HD 2.3 (p4); hfNSCs: three biological replicates at different passages (p19, p23, p25). Source data are provided as a Source Data file.
Fig. 2
Fig. 2. H3K27Ac+ regulatory regions driving the hiPSC-to-hiPSC-NSC transition.
A Venn diagrams show the number of cell-specific and shared H3K27ac+ promoters, enhancers, and super-enhancers (SEs) in comparison of hiPSCs vs. hiPSC-NSCs and hfNSCs vs. hiPSC-NSCs. The percentage indicates the cell-specific regulatory regions in each cell population. B Gene ontology enrichment analysis of DEGs (log2 fold change ± 1.5 for enhancers and ± 1 for SEs, adjusted p-value < 0.05, Benjamini–Hochberg correction) close to and potentially contacted by cell-specific enhancers and SEs (400 kb window) in hiPSC-NSCs (red bars) vs. hiPSCs (blue bars). Bar plots show the biological processes (BP, left plots) and pathways (middle plots) associated with cell-specific enhancers or pathways (right plots) associated with cell-specific SEs (probability density function with Bonferroni correction). C HOMER analysis of putative transcription factor binding sites (TFBS) detected in hiPSC-NSC-specific (left) and hiPSC-specific enhancers (right). For each TFBS motif, the percent enrichment of target sequences for transcription factors compared with background and the corresponding log p-value of enrichment (Fisher exact test - hypergeometric distribution) are shown. AC Analyses were performed in hiPSC clones HD 1.1, HD 1.3, HD 2.2 and HD 2.3 (p20-30); hiPSC-NSC clones HD 1.1 (p3), HD 1.3 (p5), HD 2.2 (p3), and HD 2.3 (p4); hfNSCs: three biological replicates at different passages (p19, p23, p25). Source data are provided as a Source Data file.
Fig. 3
Fig. 3. Transcriptional and epigenetic analysis reveal differences in the differentiation potential of hiPSC-NSC and hfNSC.
A Gene ontology enrichment analysis of RNA-seq data comparing hiPSC-NSCs vs. hfNSCs (log2 fold change ± 1, adjusted p-value < 0.05, Benjamini–Hochberg correction). Bar plots represent the biological processes (BP, left plots) and pathways (right plots) upregulated (red bars) or downregulated (blue bars) in hiPSC-NSCs as compared to hfNSC (probability density function with Bonferroni correction). B Gene ontology enrichment analysis resulting from integrating ChIP-seq and RNA-seq datasets of hiPSC-NSCs vs hfNSCs (log2 fold change ± 1,5, adjusted p-value < 0.05, Benjamini–Hochberg correction). Bar plots show BP (upper plots) and pathways (bottom plots) of genes close to cell-specific enhancers (100 kb window) upregulated in hiPSC-NSCs (red bars) or hfNSCs (blue bars) (probability density function with Bonferroni correction). C Heatmap showing the expression levels of neurogenic and gliogenic genes in hiPSC-NSCs vs hfNSCs. The colour scale indicates the average expression levels in each cluster (blue, low; red, high). AC Analyses were performed in hiPSC-NSC clones HD 1.1 (p3), HD 1.3 (p5), HD 2.2 (p3), and HD 2.3 (p4); hfNSCs: three biological replicates at different passages (p19, p23, p25). Source data are provided as a Source Data file.
Fig. 4
Fig. 4. Heterogeneity in hiPSC-NSC cell composition reflects different stages of RG maturation.
A UMAP plot showing the distribution of scRNA-seq transcriptomes ( ~ 1000–3000 cells/sample) of three hiPSC-NSC clones [HD 1.1 (p2, green dots), HD 1.3 (p1, purple dots), and HD 2.3 (p2, red dots)] and hfNSCs (p19, blue dots). B UMAP plot showing the different clusters identified in scRNA-seq analyses (resolution 0.6). Each cluster was annotated based on published NSC transcriptome datasets and the expression of cell-specific markers. C Pseudotime analysis showing the transcriptional trajectory that describes the progressive transition from ERG (Cluster 1) to neuronal precursors (Cluster 7). D The dot plot shows the signature annotation of each cluster based on published datasets. Dot size indicates the percentage of signature-specific genes expressed in each cluster. Average expression levels of cluster-specific genes are depicted according to the colour scale shown (blue, low; red, high). E Heatmap comparing the expression levels of signature-specific markers between scRNA-seq clusters. The colour scale indicates the average expression levels of these genes in each cluster (blue, low; red, high). F Heatmap showing selected pathways (KEGG database) enriched in scRNA-seq clusters. The colour scale reports the pathway’s statistical significance (adjusted p-value, Fisher exact test) in the clusters.
Fig. 5
Fig. 5. hiPSC-NSCs and hfNSCs are transcriptionally divergent from glioblastoma stem cells.
A Heatmap of sample-to-sample distance among RNA-seq samples of hiPSC-NSCs vs. hfNSCs vs. glioblastoma stem cell (GSCs; cell line G523NS). B Differentially expressed genes (DEGs) upregulated (red) and downregulated (blue) in hiPSC-NSCs vs. G523NS and hfNSCs vs. G523NS (log2 fold change ± 1, adjusted p-value < 0.05, Benjamini–Hochberg correction). The total number of DEGs in each comparative analysis is reported. The up- or down-regulated genes with relevant functions in the different cell populations are highlighted. C Heatmap showing the expression levels of potential GSC markers, pro-oncogenic transcription factors, and signalling molecules in hiPSC-NSC, hfNSC, and GSC samples. The colour scale indicates the average expression levels in each cluster (blue, low; red, high). D,E Gene ontology enrichment analysis of upregulated (red bars) and downregulated (blue bars) genes in hiPSC-NSCs vs. GSCs (D) and hfNSCs vs. GSCs (E) (log2 fold change ± 1, adjusted p-value < 0.05, Benjamini–Hochberg correction). Bar plots show selected biological processes (BP, upper plots) and pathways (bottom plots) (probability density function with Bonferroni correction). AE Analyses were performed in: hiPSC-NSC clones HD 1.1 (p3), HD 1.3 (p5), HD 2.2 (p3), and HD 2.3 (p4); hfNSCs: three biological replicates harvested at different passages (p19, p23, p25); G523NS datasets are published in Park, N. I. et al.. Source data are provided as a Source Data file.
Fig. 6
Fig. 6. Long-term engraftment of hiPSC-NSCs upon intracerebral transplantation in neonatal mice.
A A representative mask of a sagittal brain section generated based on immunofluorescence images showing the distribution of engrafted HD 2.2 hiPSC-NSCs 10 months after transplantation. Higher magnifications of specific brain regions are shown: 1. olfactory bulbs (OB); 2. cortex/corpus callosum (CTX/CC); 3. thalamus (THAL); 4. cerebellum (CB); 5. pons/medulla (PONS). Human cells were stained with a hNuclei antibody. B Bar plot showing the percentages of engrafted hiPSC-NSCs in the brains of transplanted mice. n = 8 animals; HD 1.1 (circle), HD 1.3 (triangle), and HD 2.2 (square). Human cells were stained with hNuclei antibody. Each dot represents one mouse. C Bar plot showing the percentage of Ki67+ human cells detected in the entire brain (TOT) and selected regions (CTX; CC; SVZ: subventricular zone; STR: striatum). Each dot represents one mouse. n = 8 animals; HD 1.1 (circle), HD 1.3 (triangle), and HD 2.2 (square). One-way ANOVA followed by Kruskal-Wallis’ multiple comparison test: *p < 0.05; **p < 0.01. D Representative immunofluorescence images of engrafted human cells (hNuclei+ or STEM121+) in different brain regions expressing proliferation (Ki67) and cell-specific markers: S100β (astrocytes), GSTπ (oligodendrocytes), β-tubulin III (neurons), hNestin (neural stem cells). Nuclei were counterstained with Hoechst. Arrows indicate co-localization of immunofluorescence signals. E Bar plot reporting the quantification of engrafted cells (hNuclei+ or STEM121+) expressing cell-specific markers in the total brain and selected regions. Each dot represents data collected in one mouse. n = 6 animals; HD 1.1 (circle), HD 1.3 (triangle), and HD 2.2 (square). F Stacked bar graphs showing the relative composition of the engrafted human cells (hNuclei+, hMito+ or STEM121+) expressing cell-specific markers (NESTIN, GSTπ, β-tubulin III and S100β) in the engrafted brains at 1.5-, 3-, and 10-months post-transplant (n = 5 animals for 1.5 and 3 months; n = 6 animals for 10 months; each dot represents one mouse). AF Transplanted hiPSC-NSCs: clones HD 1.1 (p2), HD 1.3 (p2), and HD 2.2 (p1-3); Data are presented as mean values ± SEM. Source data are provided as a Source Data file.
Fig. 7
Fig. 7. Role of SREBF1 in the astroglial commitment/differentiation of hiPSC-NSCs.
A Western blot analyses showing truncated immature (iSREBP1) and mature (mSREBP1) proteins in SREBP1-deficient hiPSCs (clones 8, 15, 34). Full-length iSREBP1 and mSREBP1 were detected in control hiPSCs (Cas9-only and HD1.3) and HeLa cells (expressing high SREBF1 levels). Calnexin (CLX) has been used as a housekeeping protein. B SREBP1 activity evaluated in SREBP1-deficient (SREBP1-def), and Cas9-only treated hiPSCs. Two-tailed Mann-Whitney test: **p < 0.01 (n = 3 biological replicates/clone). C PCA plot of RNA-seq data collected in SREBP1-deficient and Cas9-only treated hiPSCs, hiPSC-NSCs and differentiated cultures (day 7 and day 14 of differentiation) (n = 3 replicates/time-point/clone). D Heatmap showing the expression levels of master regulators of pluripotency and neural commitment in SREBP1-deficient and Cas9-only hiPSCs and hiPSC-NSCs. Colour scale indicates the relative fold change of normalized expression levels in each sample (blue, low; red, high). E Heatmap of sample-to-sample distance among RNA-seq samples of SREBP1-deficient and Cas9-only hiPSCs and hiPSC-NSCs; Embryonic Stem Cells (ESCs; line H1_ESC, and line ESC); ESC-derived neuroepithelial cells (NE) and early (ERG), middle (MRG), and late (LRG) radial glia cells. F Annexin V/7-AAD FACS analysis to evaluate the percentage of living and apoptotic cells in SREBP1-deficient and Cas9-only hiPSC-NSCs (n = 3 biological replicates/clone). G FACS cell proliferation assay of SREBP1-deficient and Cas9-only hiPSC-NSCs. H Bar plot reporting the quantification of cells expressing the astrocyte (GFAP and S100β) and neuronal (MAP2) markers in mixed glia/neuron cultures (7 and 14 days of differentiation) derived from SREBP1-deficient and Cas9-only hiPSC-NSCs. Two-tailed Mann-Whitney test: **p < 0.01; ***p < 0.001 (n = 3–4 biological replicates/clone). I Representative immunofluorescence images of GFAP+ (green) and S100β+ (red) astrocytes in mixed glia/neuron cultures (14 days of differentiation). Nuclei are stained with HOECHST (blue). J Bar plot reporting the quantification of the engrafted cells (hNuclei+, hMito+ or STEM121+) expressing the cell-specific markers (S100β: astrocytes, GSTπ: oligodendrocytes, β-tubulin III: neurons) at 1.5-months post-transplant in immunodeficient mice treated with SREBP1-deficient and Cas9-only hiPSC-NSCs. Each dot represents one mouse. Two-tailed Mann-Whitney test: **p < 0.01. AJ Data are presented as mean values ± SEM. Source data are provided as a Source Data file.

References

    1. Gage, F. H. & Temple, S. Neural stem cells: generating and regenerating the brain. Neuron80, 588–601 (2013). - PubMed
    1. Goldman, S. A. Stem and progenitor cell-based therapy of the central nervous system: hopes, hype, and wishful thinking. Cell Stem Cell18, 174–188 (2016). - PMC - PubMed
    1. Luciani, M., Gritti, A. & Meneghini, V. Human iPSC-based models for the development of therapeutics targeting neurodegenerative lysosomal storage diseases. Front Mol. Biosci.7, 224 (2020). - PMC - PubMed
    1. Trounson, A. & McDonald, C. Stem cell therapies in clinical trials: progress and challenges. Cell Stem Cell17, 11–22 (2015). - PubMed
    1. Lu, P., Jones, L. L., Snyder, E. Y. & Tuszynski, M. H. Neural stem cells constitutively secrete neurotrophic factors and promote extensive host axonal growth after spinal cord injury. Exp. Neurol.181, 115–129 (2003). - PubMed

Publication types

Associated data