. 2024 Nov 1;15(1):9438.
doi: 10.1038/s41467-024-53806-0.

Transfer of mitochondrial DNA into the nuclear genome during induced DNA breaks

Affiliations

Transfer of mitochondrial DNA into the nuclear genome during induced DNA breaks

Jinchun Wu et al. Nat Commun. .

Abstract

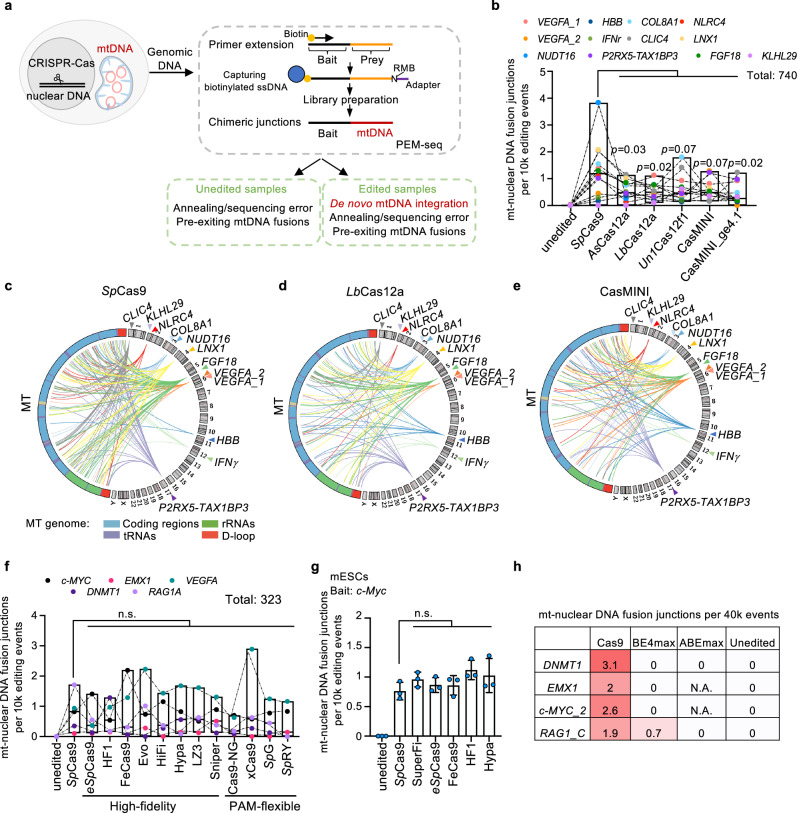
Mitochondria serve as the cellular powerhouse, and their distinct DNA makes them a prospective target for gene editing to treat genetic disorders. However, the impact of genome editing on mitochondrial DNA (mtDNA) stability remains a mystery. Our study reveals previously unknown risks of genome editing that both nuclear and mitochondrial editing cause discernible transfer of mitochondrial DNA segments into the nuclear genome in various cell types including human cell lines, primary T cells, and mouse embryos. Furthermore, drug-induced mitochondrial stresses and mtDNA breaks exacerbate this transfer of mtDNA into the nuclear genome. Notably, we observe that mitochondrial editors, including mitoTALEN and recently developed base editor DdCBE, can also enhance crosstalk between mtDNA and the nuclear genome. Moreover, we provide a practical solution by co-expressing TREX1 or TREX2 exonucleases during DdCBE editing. These findings imply genome instability of mitochondria during induced DNA breaks and explain the origins of mitochondrial-nuclear DNA segments.


Conflict of interest statement

The authors declare no competing interests.

Figures

Fig. 1
Fig. 1. Identification of mtDNA fusion to nuclear target sites of CRISPR-Cas systems.
a Schematic of mt-nuclear DNA fusions captured by PEM-seq. The biotin-labeled primer located adjacent to the CRISPR-Cas9-target site (scissor) on the nuclear DNA is used to clone editing products (orange line). Then the single-stranded products were ligated with adapters (purple line) containing random molecular barcodes (RMB). and the chimeric reads harboring nuclear DNA around the editing site and mtDNA (red line), were identified as mt-nuclear DNA fusions. For each tested locus, PEM-seq was also conducted in unedited samples. b Box plot showing the frequency of mt-nuclear DNA fusions out of editing events at CRISPR-Cas target sites (colorful dots) under editing of CRISPR-Cas enzymes. Boundary of each box indicates the minimum and maximum. The middle line of each box indicates the median. Two-sided paired t-tests were conducted between SpCas9 and other CRISPR nucleases; N = 12. Source data are provided as a Source Data file. c Circos plot showing the mt-nuclear DNA fusion junctions on mtDNA (MT) and the indicated CRISPR-Cas9-target sites (colorful triangles) on the nuclear DNA of HEK293T cells. The outer circle shows the human genome, labeled with numbers or characters. The colorful lines indicate the fusion between the target site and mtDNA. Annotations of colored regions in mtDNA are shown at the bottom. d Circos plot showing the fusion junctions on mtDNA (MT) and the indicated CRISPR-LbCas12a target sites (colorful triangles) on the nuclear DNA of HEK293T cells. Legends are described in (c). e Circos plot showing the fusion junctions on mtDNA (MT) and the indicated CRISPR-CasMINI target sites (colorful triangles) on the nuclear DNA of HEK293T cells. Legends are described in (c). f Box plot showing the frequency of mt-nuclear DNA fusion events out of editing events at CRISPR-Cas target sites (colorful dots) under editing of SpCas9 variants. Boundary of each box indicates the minimum and maximum. The middle line of each box indicates the median. Two-sided paired t-test; n.s., not significant; N = 5. Source data are provided as a Source Data file. g Frequency of mt-nuclear DNA fusions caused by high fidelity SpCas9 variants in the mES cells. Mean ± SD; two-sided t-test; n.s. not significant; n = 3. Source data are provided as a Source Data file. h Average frequency of mt-nuclear DNA fusions at DNMT1, EMX1, c-MYC_2, and RAG1_C loci after editing by Cas9, BE4max, and ABEmax. EMX1 and c-MYC_2 loci were not targetable by ABEmax. N.A. not applicable. Source data are provided as a Source Data file.
Fig. 2
Fig. 2. Mitochondrial DNA fuses to CRISPR-Cas9-target sites of the nuclear DNA ex vivo and in vivo.
a Schematic of universal T cell manufactory. Primary T cells isolated from human or mice were activated and edited by CRISPR-Cas9. After edition, T cells underwent ex vivo culture or were infused into recipient mice. b Distribution of mtDNA-nuclear DNA fusions after CRISPR-Cas9 editing for 3, 7, and 14 days in human CAR T cells. Human primary T cells isolated from cord blood were activated for 3 days and subsequently transfected with Cas9/gRNA ribonucleoprotein (RNP) complexes targeting TRAC, TRBC, and PDCD1 loci. Cells were collected after 3, 7, or 14 days and subjected to PEM-seq libraries. Legends are described in Fig. 1c. c Schematic showing the production of mouse TCR-T cells. TCR-T cells post-editing were infused to Rag1−/− recipient mice for 3 weeks, and subsequently isolated for PEM-seq analysis. d Distribution of mtDNA-nuclear DNA fusion junctions in CRISPR-Cas9 treated mouse TCR-T cells before and post-infusion for 3 weeks. Legends are described as depicted in (b). Percentages show the frequency of each mtDNA-nuclear DNA fusion out of Cas9-induced editing events. e Prey lengths of 38 mt-nuclear DNA fusions sharing the same junction from expanded mouse TCR-T cells indicated in (d). f Sequence logo showing the frequency of nucleotides in random molecular barcodes derived from the 38 reads of mt-nuclear DNA fusion at a single junction in expanded TCR-T cells indicated in (d). g Distribution of mtDNA integration in the nuclear DNA post base editor (BE3) treatment in mouse embryos. MT, mtDNA. h Number of mt-nuclear DNA fusion events identified in BE3-treated and -untreated samples. Two-sided t-test.
Fig. 3
Fig. 3. Mitochondrial stresses and DSBs exacerbate mtDNA integration into the nuclear genome.
a Illustration of mitochondrial stresses and DSBs-induced mt-nuclear DNA fusions captured by PEM-seq and Insert-seq. CRISPR-Cas9 (scissor) targets the c-MYC locus in nuclear DNA, and the primer (purple arrow) for PEM-seq is adjacent to the target site. b Mitochondrial stresses inducing mt-nuclear DNA fusions captured by PEM-seq. Top: cells were transfected with a plasmid containing Cas9 and gRNA targeting c-MYC for 8 hours to allow the assembly of Cas9 and gRNA. Subsequentially, cells are treated with CCCP or paraquat for 24 or 48 hours , respectively, and then harvested for PEM-seq and Insert-seq analysis. Bottom: percentages of mt-nuclear DNA fusions captured by PEM-seq. Each dot represents a biological replicate. Mean ± SD; two-sided t-test; n = 3. Source data are provided as a Source Data file. c Distribution of mt-nuclear DNA fusion junctions captured by the c-MYC bait (black triangle) with or without mitochondrial stresses (untreated, gray bars; CCCP, light purple bars; paraquat, dark purple bars) treatment. Legends of mtDNA annotations are described as depicted in Fig.1c. The inner circles show the number of each mtDNA-nuclear DNA fusion point on mtDNA in a log scale. MT, mtDNA. d Frequency of PEM-seq-captured mt-nuclear DNA fusion junctions with or without mitoTALEN treatment. Each dot represents a biological replicate. Mean ± SD; two-sided t-test; n = 3. Source data are provided as a Source Data file. e Distribution of mt-nuclear DNA fusion junctions captured by the c-MYC bait (black triangle) with or without mitoTALEN (ND4 site, red triangle) treatment. Legends of mtDNA annotations are described as depicted in Fig. 1b. f Workflow of Insert-seq to enrich insertions (orange lines) at the Cas9-editing site (c-MYC locus). Briefly, two rounds of targeted PCR (purple and red arrows) are used to clone the editing events around the target site, followed by two rounds of size selection that enriches insertions. Source data are provided as a Source Data file. g Percentages of mtDNA integrations within total insertions captured by Insert-seq at the c-MYC locus in the presence or absence of mitochondrial stresses. Each dot represents a biological replicate. Mean ± SD; two-sided t-test; n = 3. h Percentages of mtDNA integrations within total insertions captured by Insert-seq at the c-MYC site. Each dot represents a biological replicate. Mean ± SD; two-sided t-test; n = 3.
Fig. 4
Fig. 4. MitoTALEN and DdCBE result in mt-nuclear DNA fusions.
a Schematic of mt-nuclear DNA fusion captured by PEM-seq cloning from mtDNA. The biotin-labeled primer located adjacent to the target site (spark) on the mtDNA is used to clone editing products, and the chimeric reads harboring mtDNA bait and nuclear DNA prey (blue line) were proceeded to subsequent process. Nuclear DNA prey junctions were filtered by removing those within NUMTs (details in Methods) and ENCODE repeat masker regions. b Frequency of mt-nuclear DNA fusions with mtDNA bait junctions at each nucleotide spanning the mitoTALEN target site on ND5.1 (green boxes). Each dot represents a biological replicate. Chimeric reads containing bona fide mitoTALEN-induced mt-nuclear DNA fusion should harbor mtDNA bait junctions within the editing window (orange shadow). Mean ± SD; n = 3. Source data are provided as a Source Data file. c Distribution of mtDNA-nuclear DNA fusions with mtDNA bait junctions within the editing window (orange shadow in b) of mitoTALEN. d Illustration of DdCBE caused mt-nuclear DNA integration. Chimeric reads containing bona fide DdCBE-induced fusion should harbor mtDNA bait junctions at the editing site. e Editing efficiency (C to T or G to A) of DdCBE on ND4. Green boxes and the red triangle indicate binding sites and editing point of DdCBE. Each dot represents a biological replicate; Mean ± SD; p-value was obtained from two-sided t-test of editing efficiency at editing point (red triangle); n = 3. f Frequency of mt-nuclear DNA fusions with mtDNA bait junctions at each nucleotide spanning the DdCBE target sites (green boxes) on ND4. The mtDNA bait junctions induced by DdCBE editing was marked by gray shadow. Each dot represents a biological replicate. Mean ± SD; p-value was obtained from two-sided t-test of fusion frequency at 1-bp before editing point (red triangle); n = 3. g Distribution of mt-nuclear DNA fusions with mtDNA ending at the editing site (gray shadow in f) of DdCBE. h Distribution of mt-nuclear DNA fusion post mitochondrial base editor treatment in mouse embryos. Legends are described as depicted in Fig. 2g. i Distribution of mt-nuclear DNA fusions posts DdCBE treatment in mouse embryos. Data were re-analyzed from GOTI libraries. Two-sided t-test.
Fig. 5
Fig. 5. TREX1n and TREX2 suppress the transfer of mtDNA into nuclear DNA.
a Frequency of mt-nuclear DNA fusions at DNMT1, MYC1, c-MYC_2, MYC3, RAG1A loci after editing with Cas9 or Cas9-TREX2. Two-sided t-test. b Structures of DdCBE with or without TREX1n/TREX2. For the fusion form, TREX1n or TREX2 was fused to the C-terminal domain of L-1397C-UGI. Regarding separated TREX1n or TREX2, both nucleases were tagged with mitochondrial targeting sequence (MTS) on the N-terminal. L-1397C-UGI, left TALE arrays fused to C-terminal DddAtox half and UGI; R-1397N-UGI, right TALE arrays fused to N-terminal DddAtox half and UGI; NTD N-terminal domain, CTD C-terminal domain. c Editing efficiency of DdCBE with or without TREX1n/TREX2 treatment. Mean ± SD. L L-1397C-UGI, R R-1397N-UGI; n = 3. d Distribution of mt-nuclear DNA fusions (red lines) with mtDNA bait junctions ending at the editing site of DdCBE on ND4. The number (n) of fusions in each sample is normalized to the same editing events. L L-1397C-UGI, R R-1397N-UGI. Source data are provided as a Source Data file. e Frequency of DdCBE-induced mtDNA fusing with the CRISPR-Cas9-target site with or without TREX1n/TREX2 treatment. Each dot represents a biological replicate. Mean ± SD; two-sided t-test; n = 3. L L-1397C-UGI, R R-1397N-UGI, TX1 TREX1n, TX2 TREX2, f. fused, s. separated, mut. nuclease-dead mutant. Source data are provided as a Source Data file.

References

    1. Gray, M. W., Burger, G. & Lang, B. F. Mitochondrial evolution. Science283, 1476–1481 (1999). - PubMed
    1. O’Malley, J., Kumar, R., Inigo, J., Yadava, N. & Chandra, D. Mitochondrial stress response and cancer. Trends Cancer6, 688–701 (2020). - PMC - PubMed
    1. Xian, H. et al. Oxidized DNA fragments exit mitochondria via mPTP- and VDAC-dependent channels to activate NLRP3 inflammasome and interferon signaling. Immunity55, 1370–1385.e8 (2022). - PMC - PubMed
    1. McArthur, K. et al. BAK/BAX macropores facilitate mitochondrial herniation and mtDNA efflux during apoptosis. Science359, 6378 (2018). - PubMed
    1. Wei, W. et al. Nuclear-mitochondrial DNA segments resemble paternally inherited mitochondrial DNA in humans. Nat. Commun.11, 1740 (2020). - PMC - PubMed

Publication types