. 2024 Nov 1;14(1):26354.
doi: 10.1038/s41598-024-73620-4.

Lateral lamina V projection neuron axon collaterals connect sensory processing across the dorsal horn of the mouse spinal cord

Affiliations

Lateral lamina V projection neuron axon collaterals connect sensory processing across the dorsal horn of the mouse spinal cord

Tyler J Browne et al. Sci Rep. .

Abstract

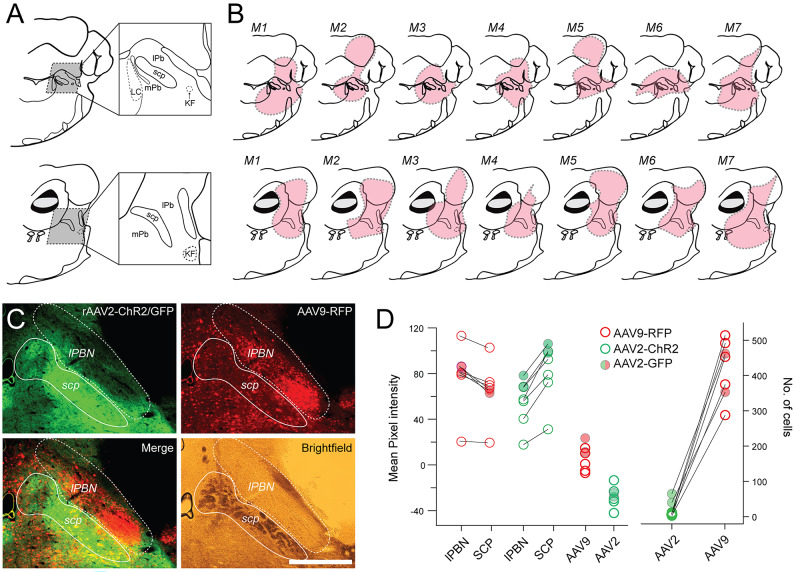
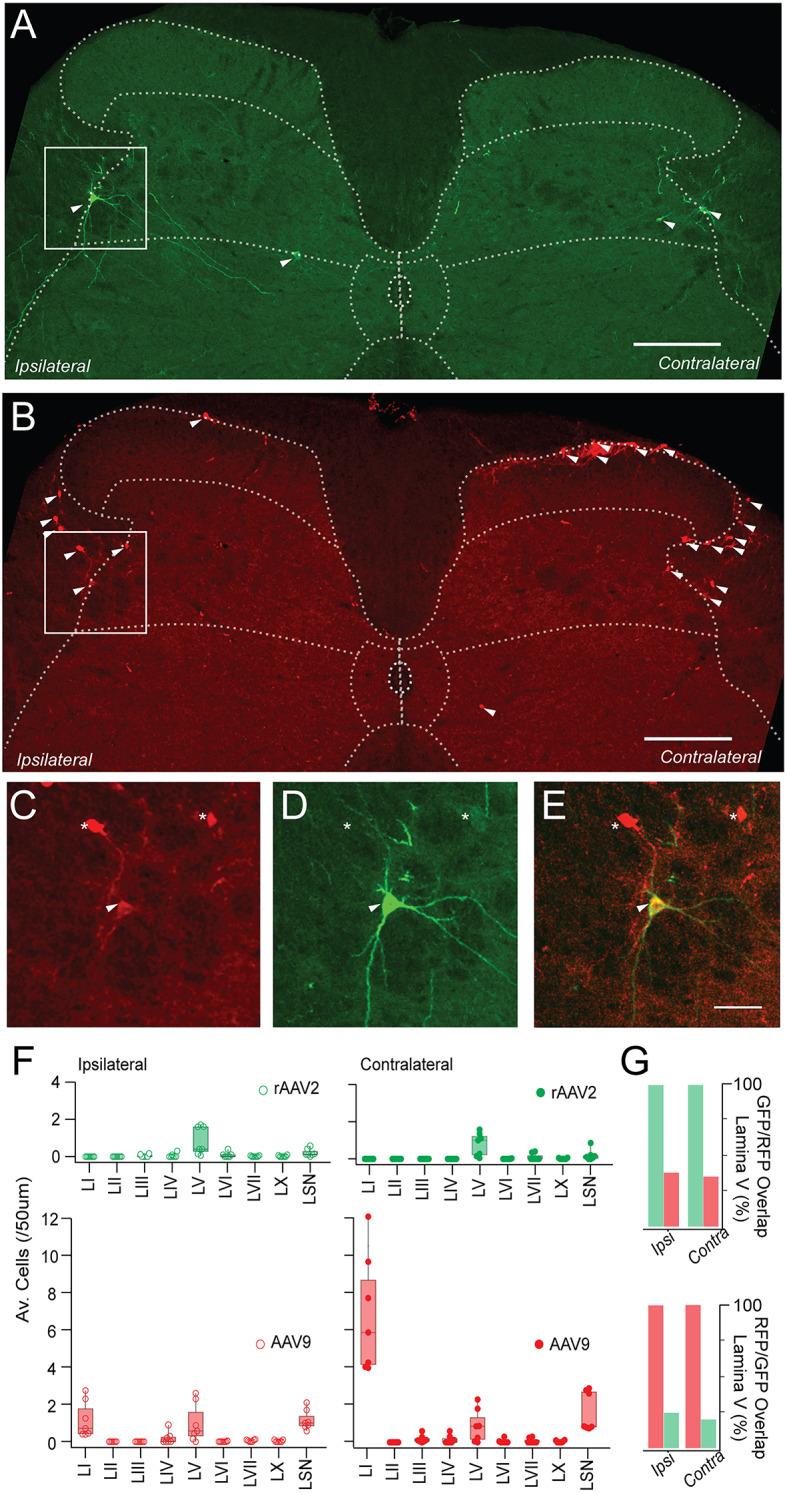
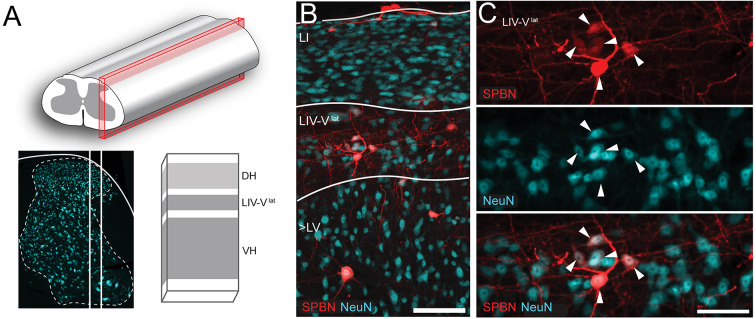
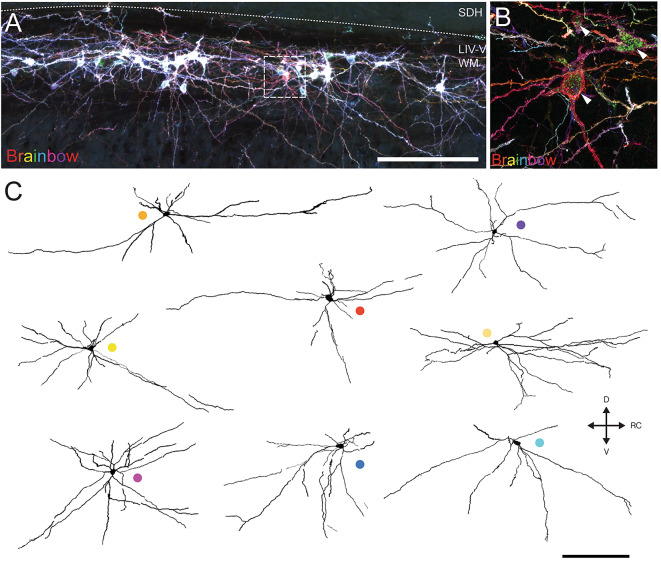
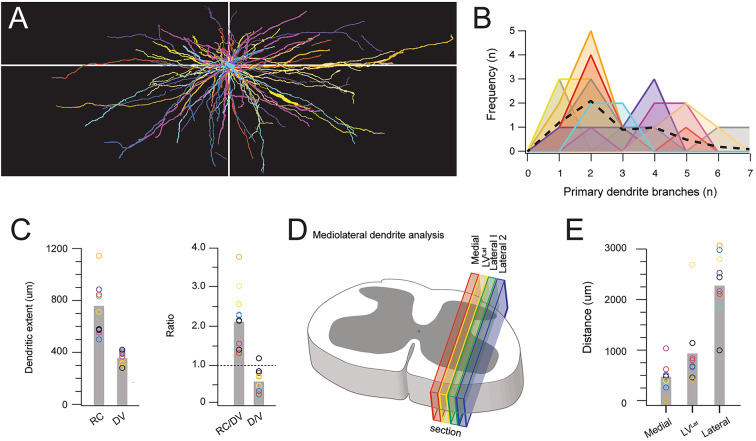
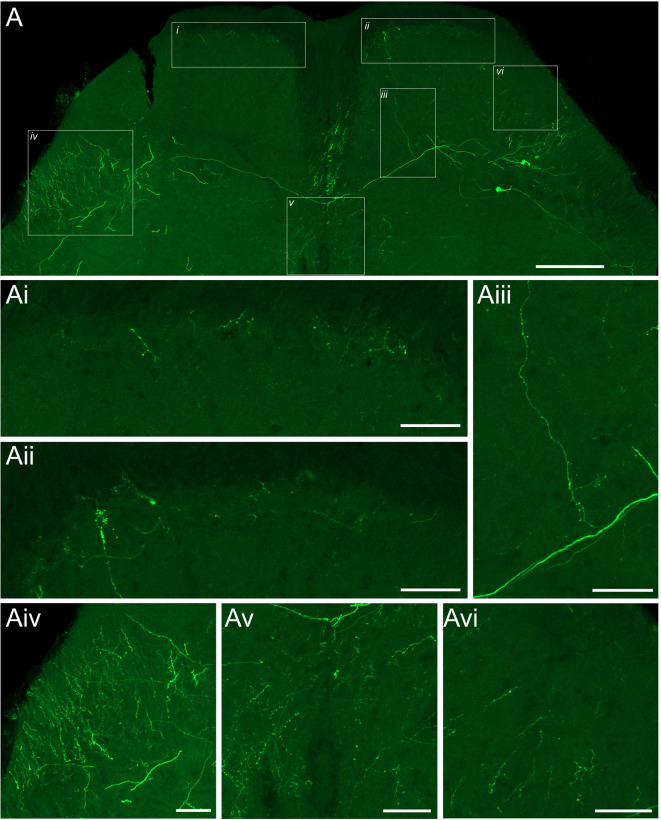
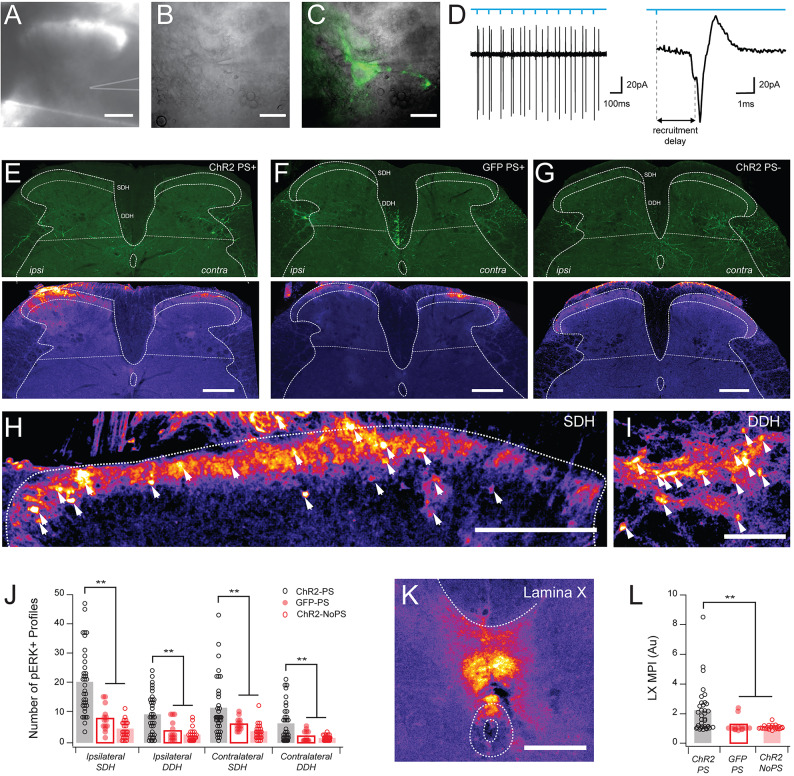
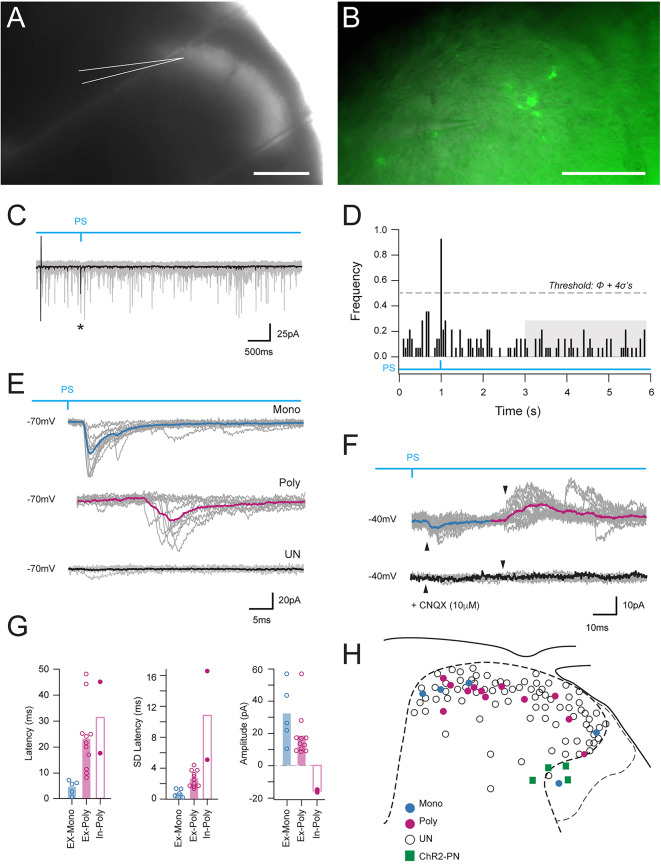
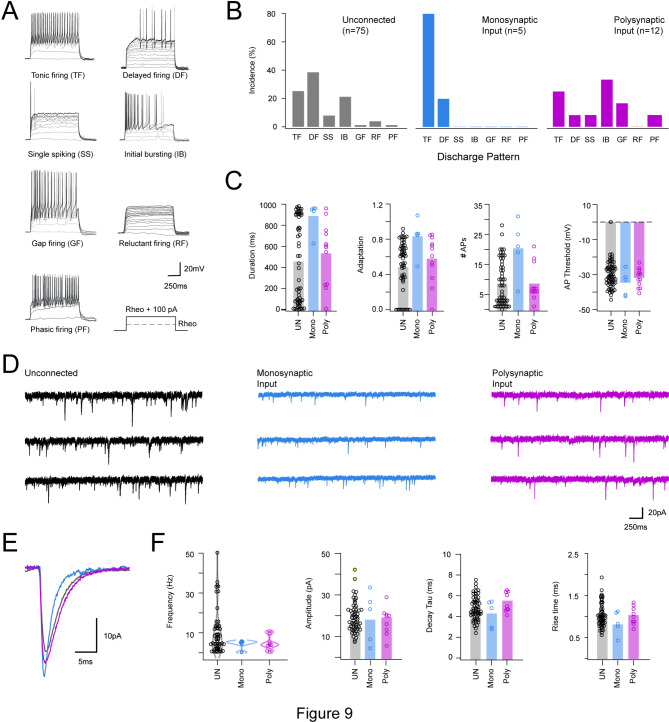
Spinal projection neurons (PNs) are defined by long axons that travel from their origin in the spinal cord to the brain where they relay sensory information from the body. The existence and function of a substantial axon collateral network, also arising from PNs and remaining within the spinal cord, is less well appreciated. Here we use a retrograde viral transduction strategy to characterise a novel subpopulation of deep dorsal horn spinoparabrachial neurons. Brainbow assisted analysis confirmed that virally labelled PN cell bodies formed a discrete cell column in the lateral part of Lamina V (LVlat) and the adjoining white matter. These PNs exhibited large dendritic territories biased to regions lateral and ventral to the cell body column and extending considerable rostrocaudal distances. Optogenetic activation of LVLat PNs confirmed this population mediates widespread signalling within spinal cord circuits, including activation in the superficial dorsal horn. This signalling was also demonstrated with patch clamp recordings during LVLat PN photostimulation, with a range of direct and indirect connections identified and evidence of a postsynaptic population of inhibitory interneurons. Together, these findings confirm a substantial role for PNs in local spinal sensory processing, as well as relay of sensory signals to the brain.


Conflict of interest statement

The authors declare no competing interests.

Figures

Fig. 1
Fig. 1
AAV serotype specific labelling of brainstem injection sites. (A) Left schematics show maps of two adjoining brainstem sections through the level of the parabrachial nucleus, constructed from Allen Brain Atlas in Adobe Illustrator (2024; version 28.0; https://www.adobe.com/au/products/illustrator.html). Major landmarks are annotated including the superior cerebellar peduncle (SCP) separating the medial and lateral parabrachial nuclei (mPb and lPb, respectively), the Kolliker-Fuse Nuclei (KF), and Locus Coeruleus (LC). (B) Brainstem maps (aligned to sections in A), with injection site reconstructions for 7 animals (denoted M1-M7) based on AAV9-RFP fluorescent signal (red). (C) Representative images show distinct labelling patterns for rAAV2-GFP (upper left) and AAV9-RFP (upper right) serotypes in the PBN. Merged image (lower left) highlight dense rAAV2 labelling of terminals across the injection site but few neurons, whereas AAV9-RFP labels many neuronal profiles across the PBN. Brightfield image (lower right) provides orientation of PBN with the prominent SCP. (D) Group data plots compare overall fluorescence (mean pixel intensity measured) and neuronal distributions (manually counted) from rAAV2-GFP and AAV9-RFP reflecting images in (B). Note more labelling in the lateral PBN compared to the superior cerebellar peduncle (SCP) for AAV9, whereas the signal is strong in the SCP compared to lPBN the for rAAV2. Strong neuronal labelling was produced by AAV9 in the lPBN, whereas AAV2-GFP and AAV2-ChR2 constructs produced negligible neuronal labelling at the injection site. Scale in A: 200 μm.
Fig. 2
Fig. 2
rAAV2-ChR2 identifies a discrete population of LVlat SPBNs. (A,B) show a representative transverse lumbar spinal section with virally labelled SPBNs following unilateral PBN co-injection of rAAV2-ChR2/GFP and AAV9-RFP. SPBNs are indicated by arrow heads, ipsilateral and contralateral sides are relative to the PBN injection site. (A) rAAV2-ChR2 labels SPBNs bilaterally in the lumbar spinal cord, on the border between Lamina V and lateral spinal nucleus. (B) AAV9-RFP labels SPBNs with the highest density located within the contralateral lamina I region and others within lamina V, and LSN. SPBNs are also located in lamina I, LSN and lamina V of the ipsilateral spinal cord, though at lower density. (CE) higher magnification images of AAV9-RFP, rAAV2-ChR2, and AAV9-RFP/ rAAV2-ChR2 channels overlaid, from images in (A,B) (white square). Some SPBNs are co-labelled with both viruses (arrowheads), while others were only transduced by a single virus (asterisks). (F) plots summarise and compare group data on SPBN numbers identified in 7 animals with dual rAAV2-GFP and AAV9-RFP PBN injections. Note the restricted rAAV2 labelling of SPBNs in lateral lamina V of the ipsilateral and contralateral DH (upper green). In contrast, AAV9 labelled a larger and much more diverse population with the greatest number of SPBNs concentrated in lamina I (lower red). (G) bar graphs compare rAAV2-GFP and AAV9-RFP colocalization in lamina V. Upper graph presents percentage of AAV9-RFP co-labelling in the total AAV2-ChR2 population, and lower graph shows the percentage of AAV2-ChR2 co-labelling in total AAV9-RFP population. Scale bars A & B = 100 μm, C-E = 20 μm.
Fig. 3
Fig. 3
LVlat SPBNs occupy lateral lamina V and the lateral grey matter. (A) images outline sagittal sectioning strategy and landmarks to identify the LVLat cell column. The red box overlaid on the spinal cord (top) highlights the mediolateral positioning of the sagittal section used for analysis. A fluorescent image labelled for NeuN (lower, left) shows the corresponding neuronal packing within the reticulated area of lateral LV through this section and emphasises the paucity of neuronal labelling in the area where lateral fasciculi lies. The schematic (lower right) summarises the resulting appearance of grey (neuropil) white matter banding in sagittal section. (B) fluorescent image labelled for NeuN and AAV9-RFP transduced SPBNs shows the dense neuronal packing within the SDH (upper), the emergence of the fasciculi within the LIV/Vlat area (middle), and then a transition into the less populated but consistently packed intermediate and ventral spinal areas (lower). The typical locations of superficial SPBNs (LI) can been seen at the dorsal section edge, LVlat SPBNs are in the reticulated border, and some deeper SPBNs (> LV) are also present. (C) higher magnification image (from B) emphasises sparse neuronal packing and the relative low proportion of AAV9-RFP labelled LVlat SPBNs. Scale: A: 100 μm, and B: 50 μm. Abbreviations: DH: Dorsal Horn. LIV-Vlat: the lateral region of Lamina IV-V, VH: Ventral Horn, SPBN: Spinoparabrachial Neurons.
Fig. 4
Fig. 4
Analysis of Brainbow labelled LVLat SPBNs. (A) Image shows a lateral sagittal section containing intersectional viral labelling of LVLat SPBNs with brainbow. Note a dense column of cells in the lateral LIV-V region, including strong labelling of somatodendritic profiles. (B) A higher magnification image (denoted by box in A) showing clear colour separation and clearly distinguished dendritic arbors within the labelled LVLat population. (C) Images are partial reconstructions of a sample of LVLat SPBNs with distinct Brainbow colour labelling, mapped across 4 serial 50 μm sagittal sections (total mediolateral reconstruction over 200 μm). Coloured circles identify specific neurons for subsequently presented data.
Fig. 5
Fig. 5
Analysis of Brainbow labelled LVLat SPBNs. (A) Overlaid LVLat SPBN reconstructions (from Fig. 4C) aligned to each cell’s soma. Note the consistent orientation of dendritic fields with wider rostrocaudal dendrite distributions (versus dorsoventral spread), and ventral dendrites spanning a greater area than dorsal dendrites. (B) Histogram shows the distribution of primary LVLat SPBN dendrite branches (per dendrite), showing dendrites branched infrequently despite spanning extended distances. Dashed line shows group mean. (C) Group data plots compare LVLat SPBN dendritic extent in the rostrocaudal (RC), and dorsoventral (DV) planes (left). Plots also summarise of RC/DV and D/V ratios (right). Dashed line denotes a ratio of 1, indicating no bias to distributions between compared planes. LVLat dendrites extended on average twice the distance in the RC plane (RC/DV > 2), whereas there was a bias for dendrites to extend further in the ventral than dorsal plane (D/V < 1.0). (D) Schematic summarises analysis of LVLat SPBN dendritic distribution in the mediolateral plane across serial sagittal sections. Sections were defined as LVLat when they contained the SPBN soma, and then the next slice immediately medial, and two immediately lateral (Lateral 1 & Lateral 2) were also included. The total length of LVLat SPBN dendrite included in each section was then calculated (Medial, LVLat, Lateral, and Lateral 2). (E) Group data plots compare dendritic length in medial, LVLat, and Lateral (Lateral 1 and Lateral 2 summed) sections. Note LVLat SPBN dendrites exhibited a distinctly lateral dendrite distribution. Scale bar: in A & C: 200 μm, B: 20 μm. Abbreviations: RC: rostrocaudal, DV: Dorsoventral, TDL: Total dendritic length, SDH: Superficial Dorsal Horn, LIV-V WM: Rexed lamina IV-V white matter.
Fig. 6
Fig. 6
Axons of LV;at neurons have diverse territories. (A) Fluorescent image of a single spinal section with LVlat SPBNs labelled from an injection to the PBN. Areas are highlighted where axonal profiles are observed. Ai-vi, are higher magnification images from areas depicted in A. Ai, depicts axon terminals in the most superficial laminae of the dorsal horn ipsilateral to the injection and Aii, axon terminals contralateral to the injection. Aiii, image shows some consistent diameter profiles oriented in the mediolateral plane, highlighting that one of these axons gives rise to a collateral branch which then ascends into the most superficial laminae, with terminals and boutons visible. The terminal structures from Aiii, can be seen in Aii. Aiv, image depicts a bundle of sectioned axons, likely the main ascending pathway for LVlat as it was common to see axons from within LVlat entering this area. Av, image depicts dense labelling around the central canal and LX. Avi, image depicts axon profiles within the dorsal horn immediately dorsal to LVlat. Scale: A: 200 μm, Ai-Avi: 50 μm.
Fig. 7
Fig. 7
In vivo SPBNs photostimulation produces pERK expression in the spinal cord. (A) Bright field image of a spinal cord slice with recording pipette highlighted. (B,C) Higher magnification images (40x) show the recording pipette targets a ChR2-positive SPBN in the lateral part of lamina V in the deep dorsal horn. (D) left trace shows an on-cell voltage clamp recording from a ChR2-expressing SPBN during 10 Hz photostimulation (upper blue line − 1ms pulses, 470 nm). Note several extracellular action potentials corresponding to photostimulation timing. Right trace shows one photostimulation evoked AP response with the recruitment delay denoted (dashed line). (E–G) Upper image panels show transverse spinal cord sections from 3 experimental paradigms: LVLat SPBN ChR2 expression and photostimulation (ChR2 PS+); LVLat SPBN GFP expression and photostimulation (GFP PS+), and LVLat SPBN ChR2 expression without photostimulation (ChR2 PS-). Images below show corresponding pERK expression produced by each paradigm. pERK pixel intensity pseudocolored purple to yellow for low to high pERK expression. In ChR2 PS + animals, photostimulation produced an intense band of pERK in the ipsilateral superficial dorsal horn, and some pERK in the deep dorsal horn. In GFP PS + animals, photostimulation produced negligible pERK expression, controlling for activation due to light exposure alone. In ChR2 PS- animals, there was limited pERK expression controlling for the spinal cord exposure procedures. (H,I) higher magnification images of the SDH and DDH in a ChR2 PS + animal showing the punctate pERK + neuronal profiles. (J) group data plot summarises counts of pERK + profiles in ChR2:PS+, GFP: PS+, and ChR2:PS- paradigms. There were significantly more pERK profiles in ChR2:PS + than in GFP: PS+, and ChR2:PS- trials in all regions assessed. (K) high magnification image in the Lamina X region highlights substantial pERK signal, consistent with a dense plexus of SPBN axons decussating through this region. (L) group data plot shows significantly more pERK signal in ChR2:PS + trials (left), compared to the GFP: PS + and ChR2:PS- controls (middle and left, respectively). Scales: A, E-G: 200 μm; H:100 μm; I, K: 50 μm; B-C: 20 μm.
Fig. 8
Fig. 8
Optically evoked postsynaptic currents (oPSCs) recorded in dorsal horn neurons during LVLat SPBN photostimulation. (A) A brightfield image of a spinal cord slice with recording pipette highlighted. (B) A higher magnification image depicting an established recording near axonal terminals in the SDH. (C) Summary of photostimulation oPSC response analysis. Overlaid voltage clamp traces (top, 10 trials in grey; average response in black) exhibit ongoing spontaneous postsynaptic currents (sPSCs). Brief photostimulation is applied (blue line, 1ms pulse at 1s) causing a large optically evoked postsynaptic current (oPSC) apparent in the averaged trace. (D) Histogram (below) shows PSC frequency (50ms epochs), with the last 3 s of data used to calculate background sPSC frequency (grey shaded box). Note the peak in PSC frequency histogram immediately following photostimulation, confirming an oEPSC response. Neurons were deemed to receive a photostimulation evoked input if there was a frequency peak following photostimulation above spontaneous background frequency (mean + 4SD, grey-dashed line). (E) representative voltage clamp traces (10 trials with the average overlaid, holding potential: -70mV) show the three different types of LVLat SPBN photostimulation responses including: oEPSCs at short-latency, reflecting monosynaptic SPBN input (upper traces); oEPSCs at longer latency, consistent with polysynaptic SPBN circuit activation (middle traces); or no oEPSC response (lower traces). Top blue line denotes photostimulation. (F) example recording with holding potential adjusted to -40mV revealed a short latency excitatory (inward) current and longer latency inhibitory (outward) current, with both abolished by CNQX (lower trace). (G) group data plots compare oEPSC response latency, jitter (latency SD), and amplitude for monosynaptic and polysynaptic excitatory responses (Ex-Mono and Ex, Poly, respectively) and polysynaptic inhibitory responses (In-Poly). Note short latency and low jitter of monosynaptic connections, contrasted by longer latency and higher jitter in polysynaptic connections. Amplitudes varied across both connection types; however, negative amplitudes (inhibitory input) were only observed in polysynaptic responses. (H) summary map presents recording locations of all neurons sampled during photostimulation recording experiments (monosynaptic connection = blue, polysynaptic connection = red, no connection = open circle, and recorded SPBNs = green). Note most connections were identified in the superficial DH. Scale bar: A:200 μm, B: 50 μm.
Fig. 9
Fig. 9
Electrophysiological profile of neurons receiving photostimulation-evoked LVLat SPBN axon collateral evoked input. (A) Overlaid traces show AP discharge patterns evoked by depolarizing current step injections in unidentified neurons sampled in photostimulation mapping experiments. Responses were classified as: tonic firing (TF), delayed firing (DF), single spiking (SS), initial bursting (IB), gap firing (GF), reluctant firing (RF), and phasic firing (PF), based on previous descriptions,,. (B) Group data plots compare the incidence of different discharge patterns across neurons that were; unconnected (UN), received monosynaptic LVLat SPBN input (mono-oPSCs), or received polysynaptic LVLat SPBN input (poly-oPSCs). Note TF responses were dominant in neurons receiving monosynaptic input but less common in neurons received Poly-oPSC input or UN. (C) group data compare selected features of repetitive AP spiking responses including, discharge duration, spike frequency adaptation, number of action potentials discharged, and action potential threshold for the rheobase + 100pA current step response. Note neurons receiving mono-oPSC input exhibited greater repetitive firing, increased discharge duration, less frequency adaptation, but similar AP thresholds. (D) traces showing 10s of representative sEPSC activity in unconnected, mono-oPSC, and poly-oPSC responses to LVLat SPBN photostimulation. (E) overlaid traces compare averaged sEPSCs (from traces in D) in unconnected, mono-oPSC, and poly-oPSC groups. (F) group data compares sEPSC frequency, amplitude, decay time constant (Tau), and rise time between unconnected, mono-oPSC, and poly-oPSC recordings. sEPSC frequency was lower in the mono-oPSC and poly-oPSC groups compared to UN, but there were no differences in the average amplitudes, Tau, or rise times. Traces and data: black = UN, blue = mono-OPSC, magenta = poly-OPSC.

References

    1. Koch, S. C., Acton, D. & Goulding, M. Spinal circuits for touch, pain, and itch. Annu. Rev. Physiol.80, 189–217. 10.1146/annurev-physiol-022516-034303 (2018). - DOI - PMC - PubMed
    1. Peirs, C. & Seal, R. P. Neural circuits for pain: recent advances and current views. Science. 354, 578–584. 10.1126/science.aaf8933 (2016). - DOI - PMC - PubMed
    1. Melzack, R. & Wall, P. D. Pain mechanisms: a new theory. Science. 150, 971–979. 10.1126/science.150.3699.971 (1965). - DOI - PubMed
    1. Carlton, S. M. Nociceptive primary afferents: they have a mind of their own. J. Physiol.592, 3403–3411. 10.1113/jphysiol.2013.269654 (2014). https://doi.org:. - DOI - PMC - PubMed
    1. Todd, A. J. Identifying functional populations among the interneurons in laminae I-III of the spinal dorsal horn. Mol. Pain. 13, 1744806917693003. 10.1177/1744806917693003 (2017). - DOI - PMC - PubMed

LinkOut - more resources