. 2024 Nov 1;14(1):26361.
doi: 10.1038/s41598-024-77248-2.

Characterization of metastasis-specific macrophages in colorectal cancer for prognosis prediction and immunometabolic remodeling

Affiliations

Characterization of metastasis-specific macrophages in colorectal cancer for prognosis prediction and immunometabolic remodeling

Yang Hua et al. Sci Rep. .

Abstract

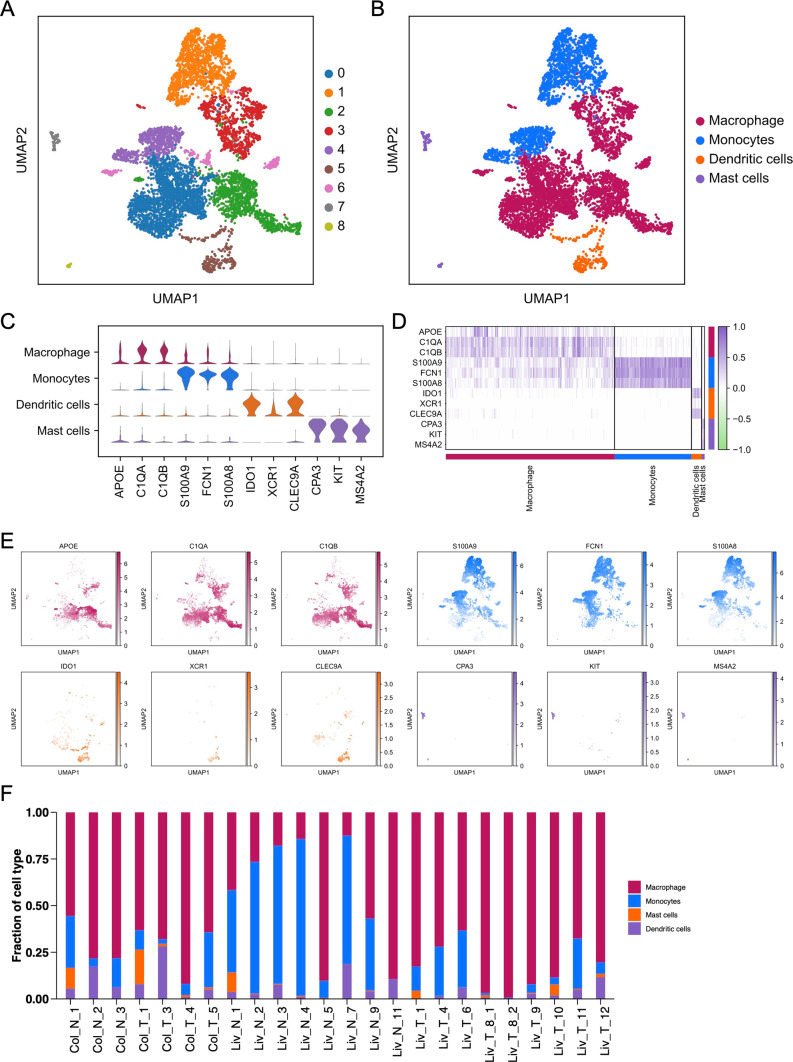
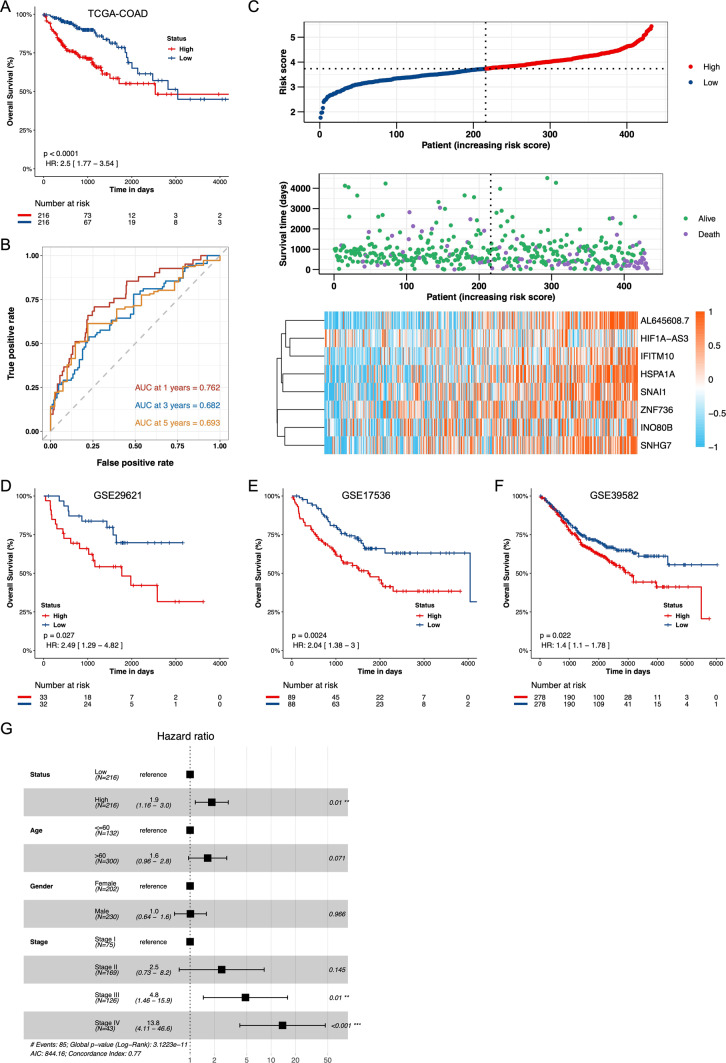
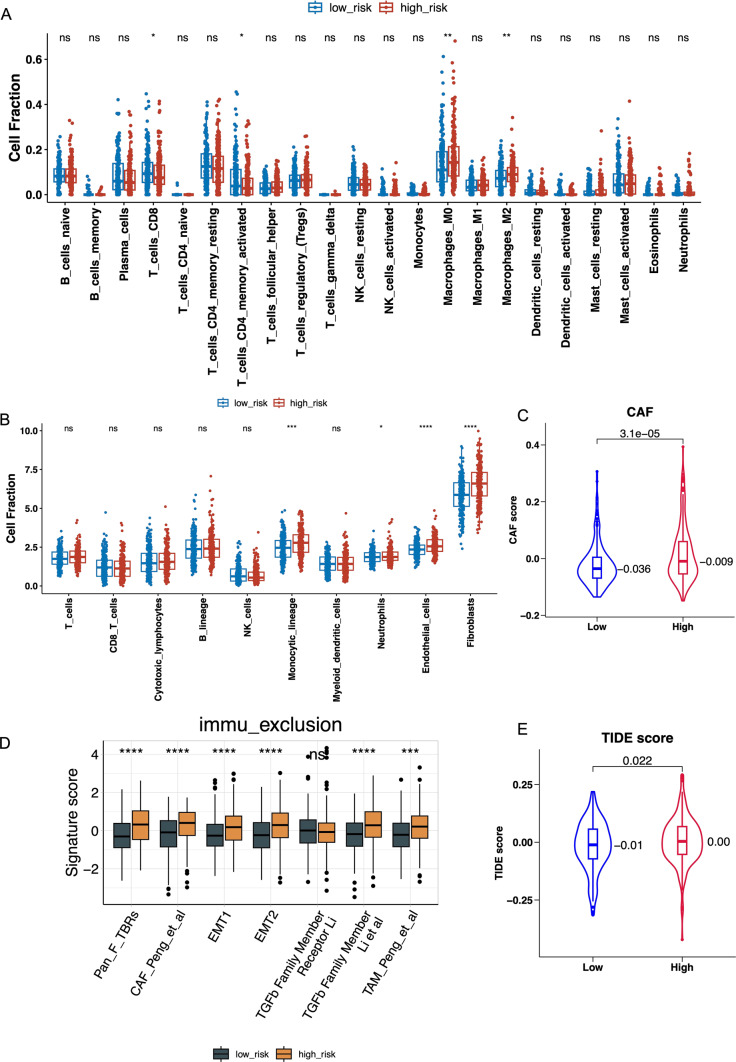
This study develops a prognostic model to predict metastasis and prognosis in colorectal cancer liver metastases by identifying distinct macrophage subsets. Using scRNA-seq data from primary colorectal cancer and liver metastases, we dissected the cellular landscape to find unique macrophage subpopulations, particularly EEF1G + macrophages, which were prevalent in liver metastases. The study leveraged data from GSE231559, TCGA, and GEO databases to construct an 8-gene risk model named EMGS, based on the EEF1G + macrophage gene signature. Patients were divided into high-risk and low-risk groups using the median EMGS score, with the high-risk group showing significantly worse survival. This group also demonstrated upregulated pathways associated with tumor progression, such as epithelial-mesenchymal transition and angiogenesis, and downregulated metabolic pathways. Moreover, the high-risk group presented an immunosuppressive microenvironment, with a higher TIDE score indicating lower effectiveness of immunotherapy. The study identifies potential drugs targeting the high-risk group, suggesting therapeutic avenues to improve survival. Conclusively, the EMGS score identifies colorectal cancer patients at high risk of liver metastases, highlighting the role of specific macrophage subsets in tumor progression and providing a basis for personalized treatment strategies.

Keywords: Colorectal cancer; Immunosuppressive; Macrophage; Metabolic; Metastatic; Prognosis; scRNA-seq.


Conflict of interest statement

The authors declare no competing interests.

Figures

Fig. 1
Fig. 1
Analysis of the colorectal cancer single-cell atlas. (A) Uniform Manifold Approximation and Projection (UMAP) visualization of 56,163 cells categorized into 23 distinct clusters. (B) UMAP delineation of nine principal cell lineages (T cells, NK cells, Myeloid cells, Mast cells, B cells, Plasma cells, Epithelial cells, Fibroblasts, and Endothelial cells) derived from CRC patient samples. (C) Violin plots depicting the distribution of a selected canonical marker gene expression across each of the major cell lineages. (D) UMAP representations of the nine principal cell lineages, each highlighted by the expression of its respective canonical marker gene.
Fig. 2
Fig. 2
Gene expression profiling of myeloid cell clusters in CRC patients. (A) A UMAP visualization of myeloid cells delineated into nine distinct clusters. (B) A detailed UMAP plot of 6,549 myeloid cells, categorized by four myeloid cell phenotypes. (C) Violin plots depicting the expression levels of three canonical marker genes for each myeloid cell type (Macrophages: APOE, C1QA, C1QB; Monocytes: S100A9, FCN1, S100A8; Dendritic Cells: IDO1, XCR1, CLEC9A; Mast Cells: CPA3, KIT, MS4A2). (D) A heatmap revealing the expression patterns of three representative genes across macrophages, monocytes, dendritic cells, and mast cells. (E) UMAP plot of the same representative genes highlight their expression within macrophages, monocytes, dendritic cells, and mast cells. (F) Proportional distribution of four myeloid cell types in each sample.
Fig. 3
Fig. 3
Gene expression profiling of macrophage cell cluster in CRC patients. (A) UMAP visualization categorizes macrophage cells into normal colon (Col_N), colon tumor (Col_T), normal liver (Liv_N), and liver tumor (Liv_T) groups. (B) A refined UMAP plot of 4,319 macrophage cells, classified into four macrophage phenotypes (Mph-EEF1G, Mph-C1QC, Mph-SEPT2, and Mph-S100A8). (C) Violin plots illustrate the expression profiles of three key marker genes within the Col_T and Liv_T macrophage populations. (D) The stacked violin plot shows the expression levels of the marker genes, such as IL1B, CCL3, ISG15, CXCL8, ARG1, CD274, MKI67, CDK1, LYVE1, HES1, VEGFA, SPP1, APOC1, and APOE, associated with specific functional states like inflammatory TAMs (Inflam-TAMs), IFN-TAMs, regulatory TAMs (Reg-TAMs), proliferative TAMs (Prolif-TAMs), resident TAMs (RTM-TAMs), angiogenic TAMs (Angio-TAMs), and lipid-associated TAMs (LA-TAMs). Each row represents different macrophage subtypes identified in the study, including Mph-EEF1G, Mph-C1QC, Mph-SEPT2, and Mph-S100A8. (E) A volcano plot highlights differentially expressed genes between the Mph-EEF1G phenotype and other macrophage cell types. (F) Forest plots present hazard ratios (HRs, depicted by pink circles) and 95% confidence intervals (represented by horizontal lines) from Cox regression survival analyses, correlating the overall survival with eight macrophage signature genes.
Fig. 4
Fig. 4
Survival analysis in high-risk and low-risk groups based on EMGS. (A) Kaplan–Meier curves compared the overall survival of TCGA-COAD patients between high-risk and low-risk groups. (B) ROC curves of the EMGS score for predicting the risk of death at 1, 3, and 5 years. (C) The distribution of risk score (top), survival status (middle), and expression (bottom) of the identified eight EMGS genes. Validation of EMGS in (D) GSE29621 (n = 65) cohort, (E) GSE17536 (n = 177) cohort and (F) GSE39582 (n = 556) cohort. (G) Forest plot shows HRs and 95% confidence intervals (horizontal ranges) derived from multivariate cox regression analyses including EMGS group, age, gender, and stage.
Fig. 5
Fig. 5
Functional differences between EMGS high and low groups. (A) Gene Ontology analysis of differentially expressed genes between EMGS high and low groups. (B) GSEA analysis of hallmark pathways. (C) GSEA enrichplot displaying significantly upregulated and downregulated top pathways in the EMGS high group. (D) GSVA activity analysis of hallmark EMT and TGF-β signaling pathway. (E) Differences in metabolic pathways between EMGS high and low groups.
Fig. 6
Fig. 6
Differences in the immune microenvironment between EMGS high and low groups. (A) Proportional distribution of 22 immune cell types obtained through CIBERSORT deconvolution. (B) Proportional distribution of eight immune and two stromal cell populations calculated by MCPcounter. For EMGS high and low groups, scores calculated using the ssGSEA algorithm for (C) CAF score, (D) various immune exclusion signature scores, and (E) TIDE score.
Fig. 7
Fig. 7
Predicted effective anticancer drugs for the EMGS high group. The IC50 values of three anticancer drugs were predicted by the pRRophetic algorithm and showed significant differences in sensitivity between EMGS high and low groups: (A) Docetaxel, (B) Pazopanib, (C) Sorafenib. (D) Targeted drugs for the EMGS gene HSPA1A identified using the DrugMap database.

References

    1. Siegel, R. L. et al. Cancer statistics, 2023. CA Cancer J. Clin.73 (1), 17–48 (2023). - PubMed
    1. Hu, D., Pan, Y. & Chen, G. Colorectal cancer liver metastases: an update of treatment strategy and future perspectives. Surg. Pract. Sci.7, 100042 (2021).
    1. Aziz, H. et al. A Comprehensive Review of Management of Colorectal Liver Mets in the current era. Cancer Med. J.5 (1), 46–57 (2022). - PMC - PubMed
    1. Zeineddine, F. A. et al. Survival improvement for patients with metastatic colorectal cancer over twenty years. NPJ Precis Oncol.7 (1), 16 (2023). - PMC - PubMed
    1. Wang, R. et al. Survival rate of colorectal cancer in China: a systematic review and meta-analysis. Front. Oncol.13, 1033154 (2023). - PMC - PubMed

MeSH terms

Substances