

Decoding viewer emotions in video ads
- PMID: 39487244
- PMCID: PMC11530461
- DOI: 10.1038/s41598-024-76968-9
Decoding viewer emotions in video ads
Abstract
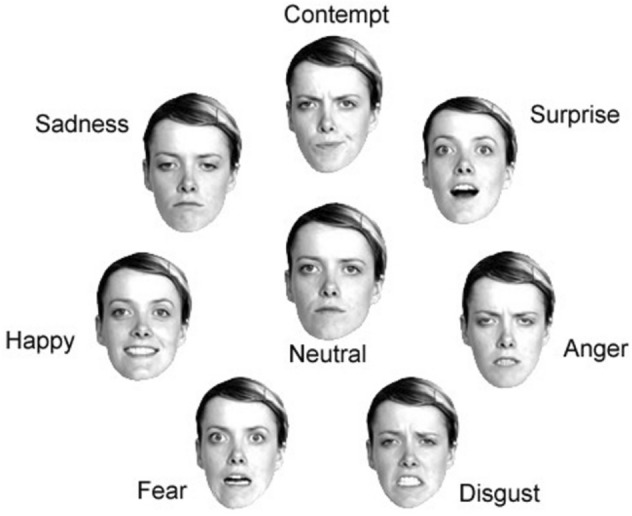
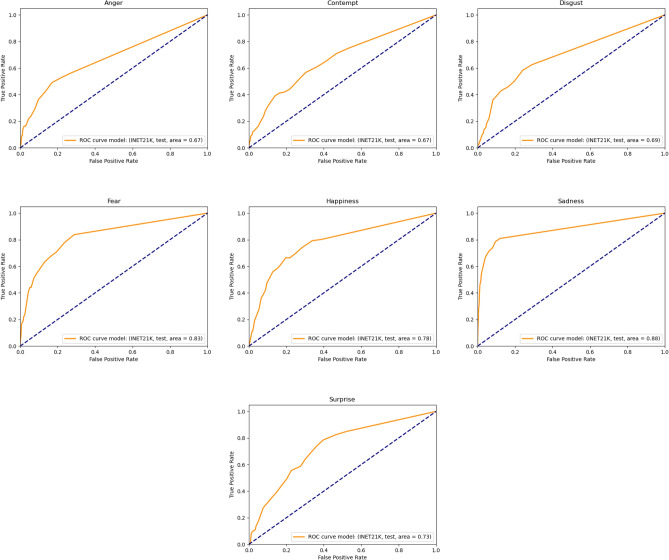
Understanding and predicting viewers' emotional responses to videos has emerged as a pivotal challenge due to its multifaceted applications in video indexing, summarization, personalized content recommendation, and effective advertisement design. A major roadblock in this domain has been the lack of expansive datasets with videos paired with viewer-reported emotional annotations. We address this challenge by employing a deep learning methodology trained on a dataset derived from the application of System1's proprietary methodologies on over 30,000 real video advertisements, each annotated by an average of 75 viewers. This equates to over 2.3 million emotional annotations across eight distinct categories: anger, contempt, disgust, fear, happiness, sadness, surprise, and neutral, coupled with the temporal onset of these emotions. Leveraging 5-second video clips, our approach aims to capture pronounced emotional responses. Our convolutional neural network, which integrates both video and audio data, predicts salient 5-second emotional clips with an average balanced accuracy of 43.6%, and shows particularly high performance for detecting happiness (55.8%) and sadness (60.2%). When applied to full advertisements, our model achieves a strong average AUC of 75% in determining emotional undertones. To facilitate further research, our trained networks are freely available upon request for research purposes. This work not only overcomes previous data limitations but also provides an accurate deep learning solution for video emotion understanding.
Keywords: Deep learning; Emotion prediction; Video analytics.
© 2024. The Author(s).
Conflict of interest statement
S.S.K., W.H., and O.W. are employees of the company that provided the dataset for this study. Their roles were primarily focused on facilitating data access and providing input on data interpretation. Still, they did not directly involve the development of the models or influence of the study’s results.
Figures
References
-
- Baveye, Y., Chamaret, C., Dellandréa, E. & Chen, L. Affective video content analysis: A multidisciplinary insight. IEEE Trans. Affect. Comput.9, 396–409. 10.1109/TAFFC.2017.2661284 (2018). - DOI
-
- Ekman, P. Emotions revealed: recognizing faces and feelings to improve communication and emotional life (Times Books/Henry Holt and Co,) (2003).
-
- Oprea, S. et al. A review on deep learning techniques for video prediction. CoRR[SPACE]arXiv: 2004.05214 (2020). - PubMed
-
- Liu, W. et al. A survey of deep neural network architectures and their applications. Neurocomputing234, 11–26. 10.1016/j.neucom.2016.12.038 (2017). - DOI
MeSH terms
LinkOut - more resources
Full Text Sources
