. 2024 Nov;26(11):1860-1877.
doi: 10.1038/s41556-024-01541-5. Epub 2024 Nov 1.

Spatiotemporal coordination of actin regulators generates invasive protrusions in cell-cell fusion

Affiliations

Spatiotemporal coordination of actin regulators generates invasive protrusions in cell-cell fusion

Yue Lu et al. Nat Cell Biol. 2024 Nov.

Abstract

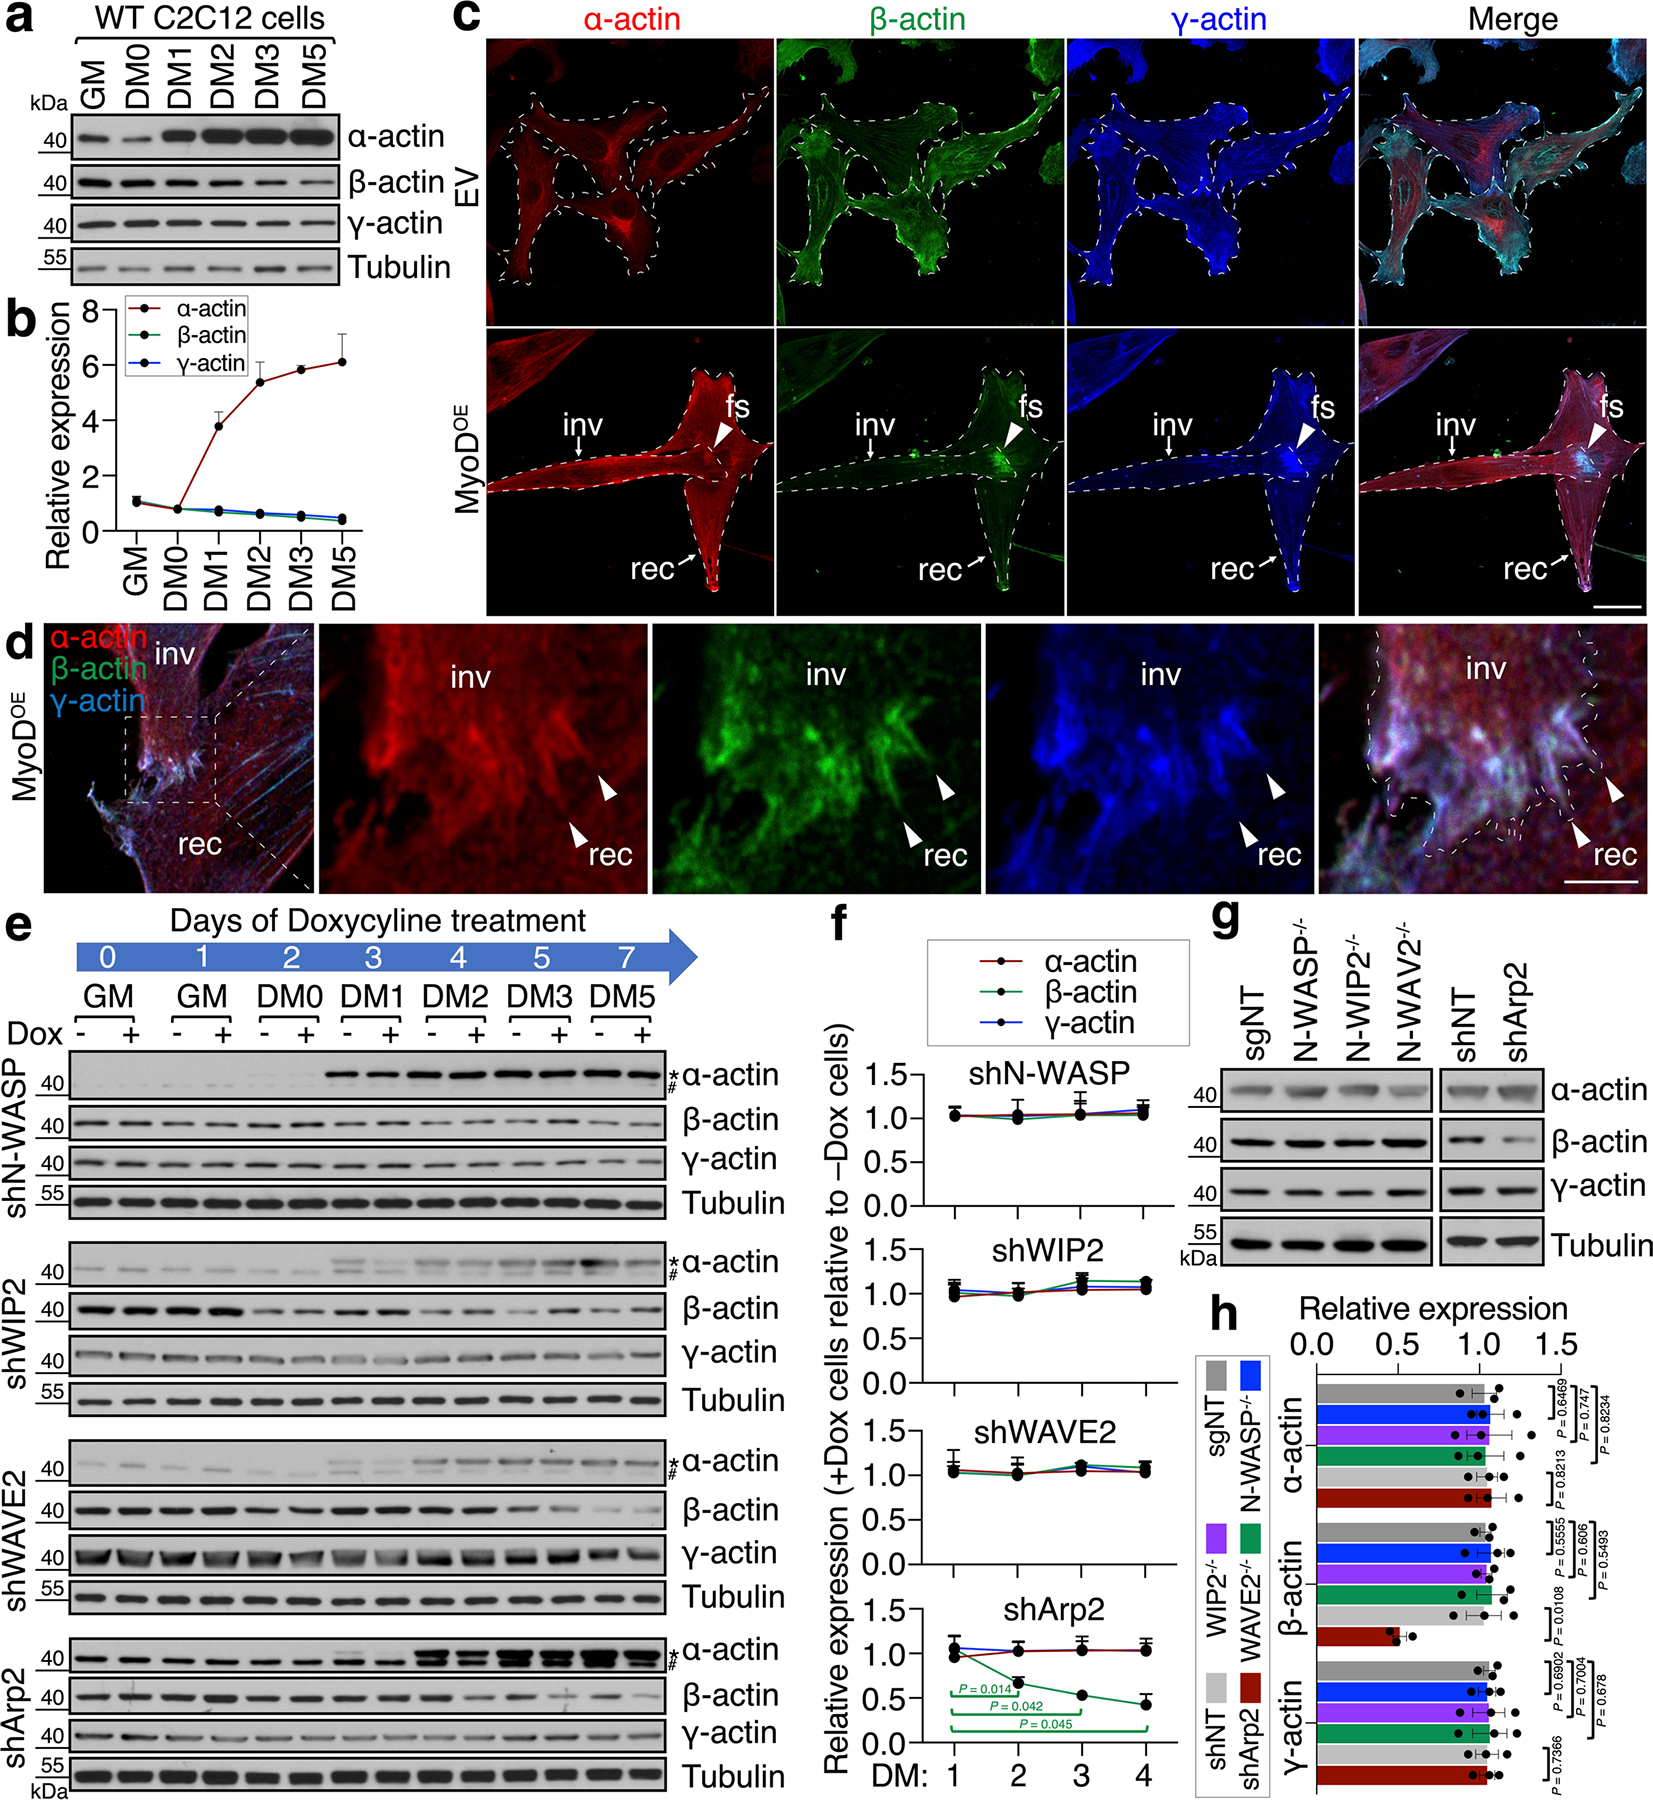
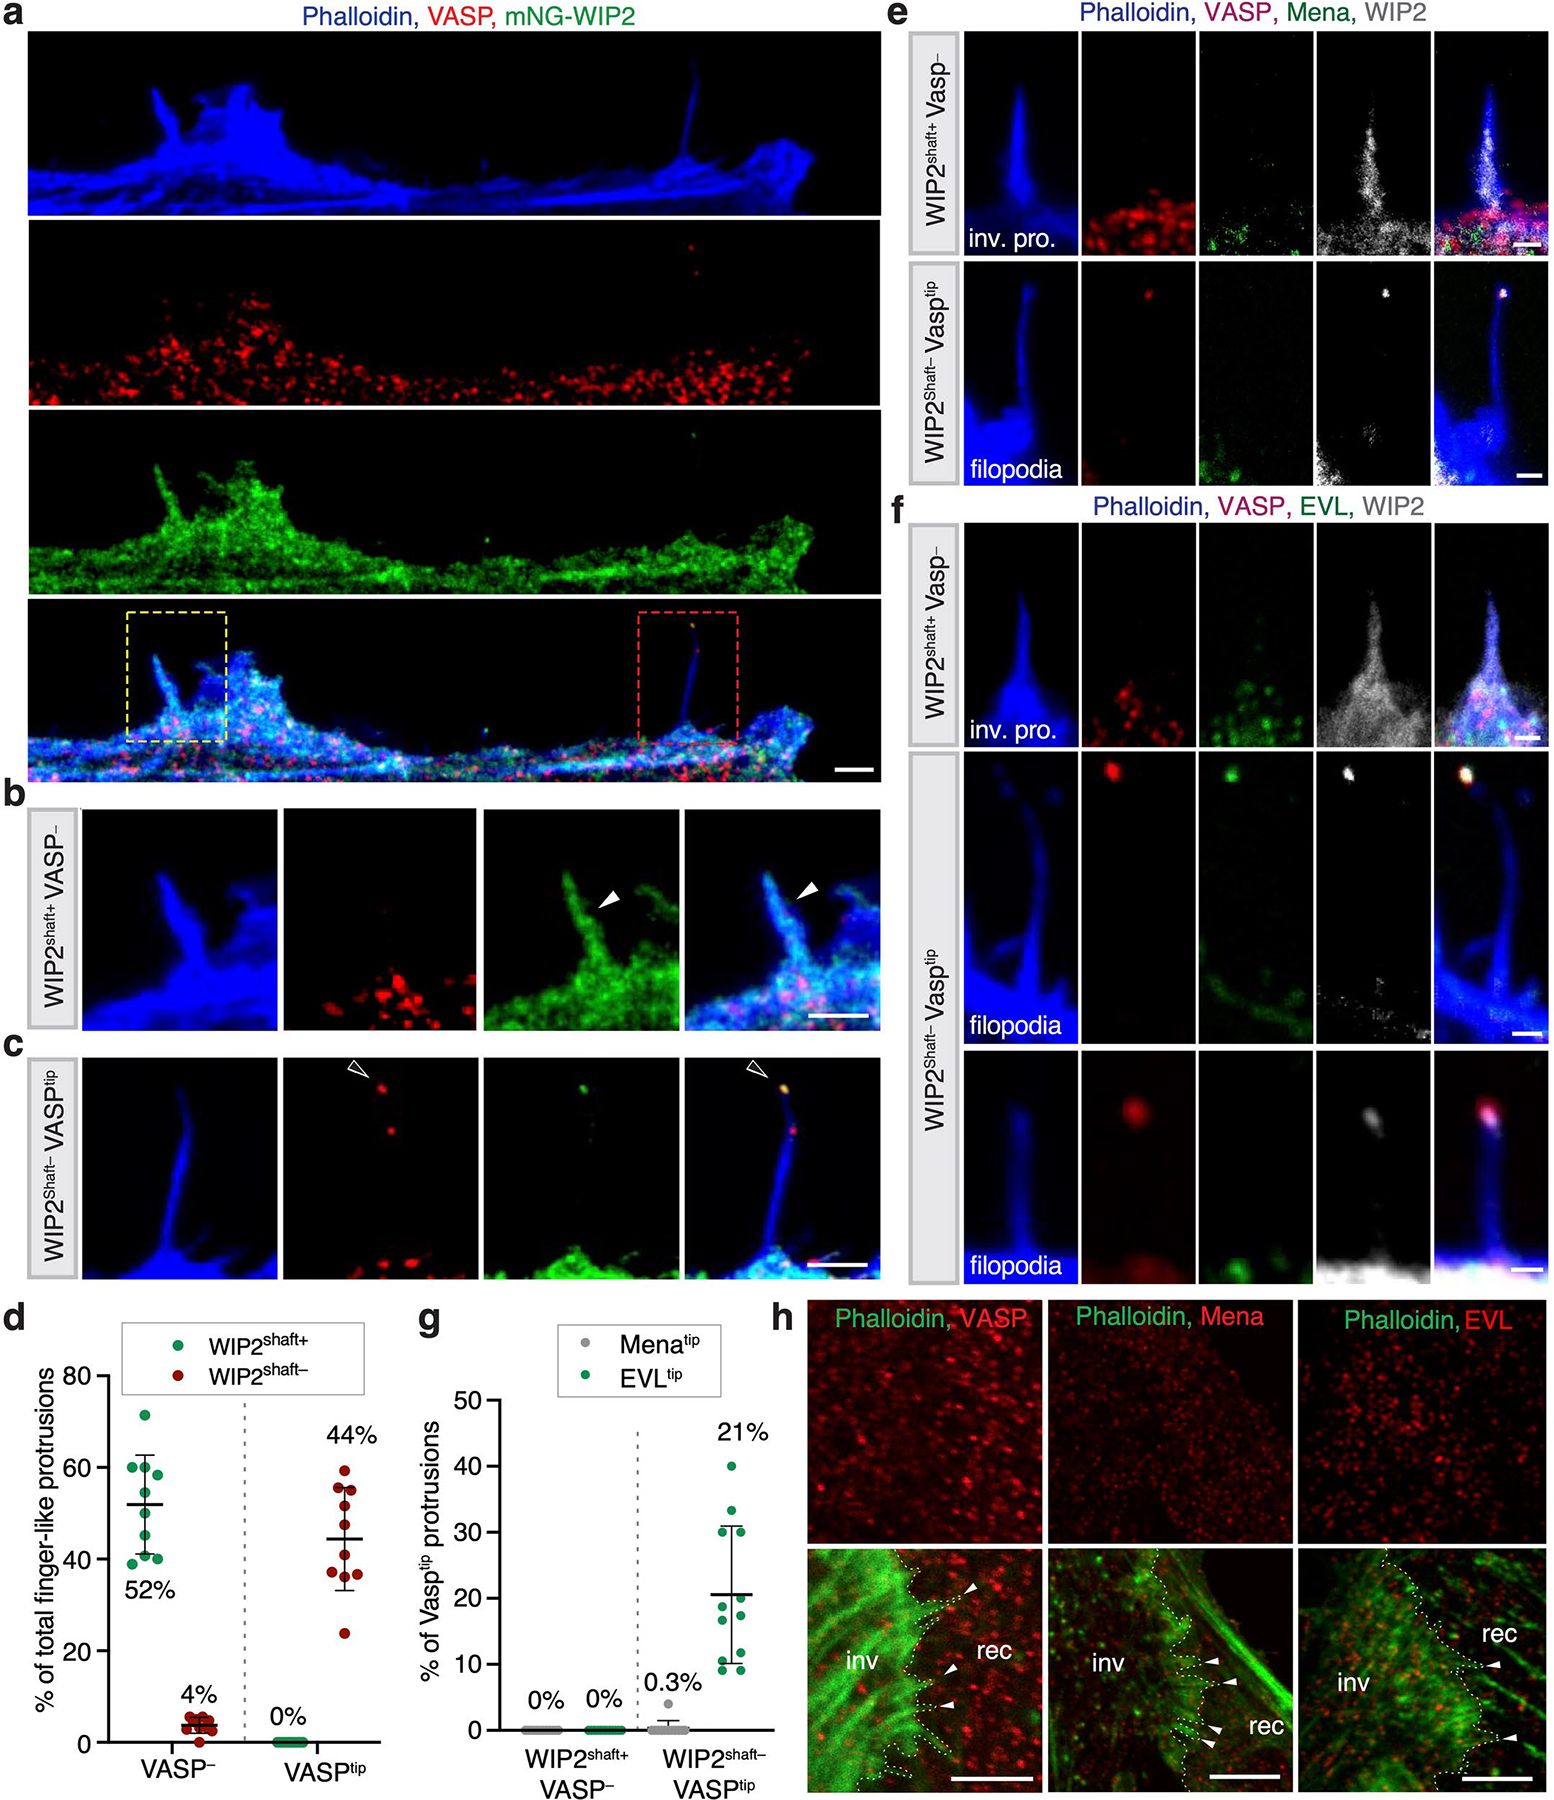
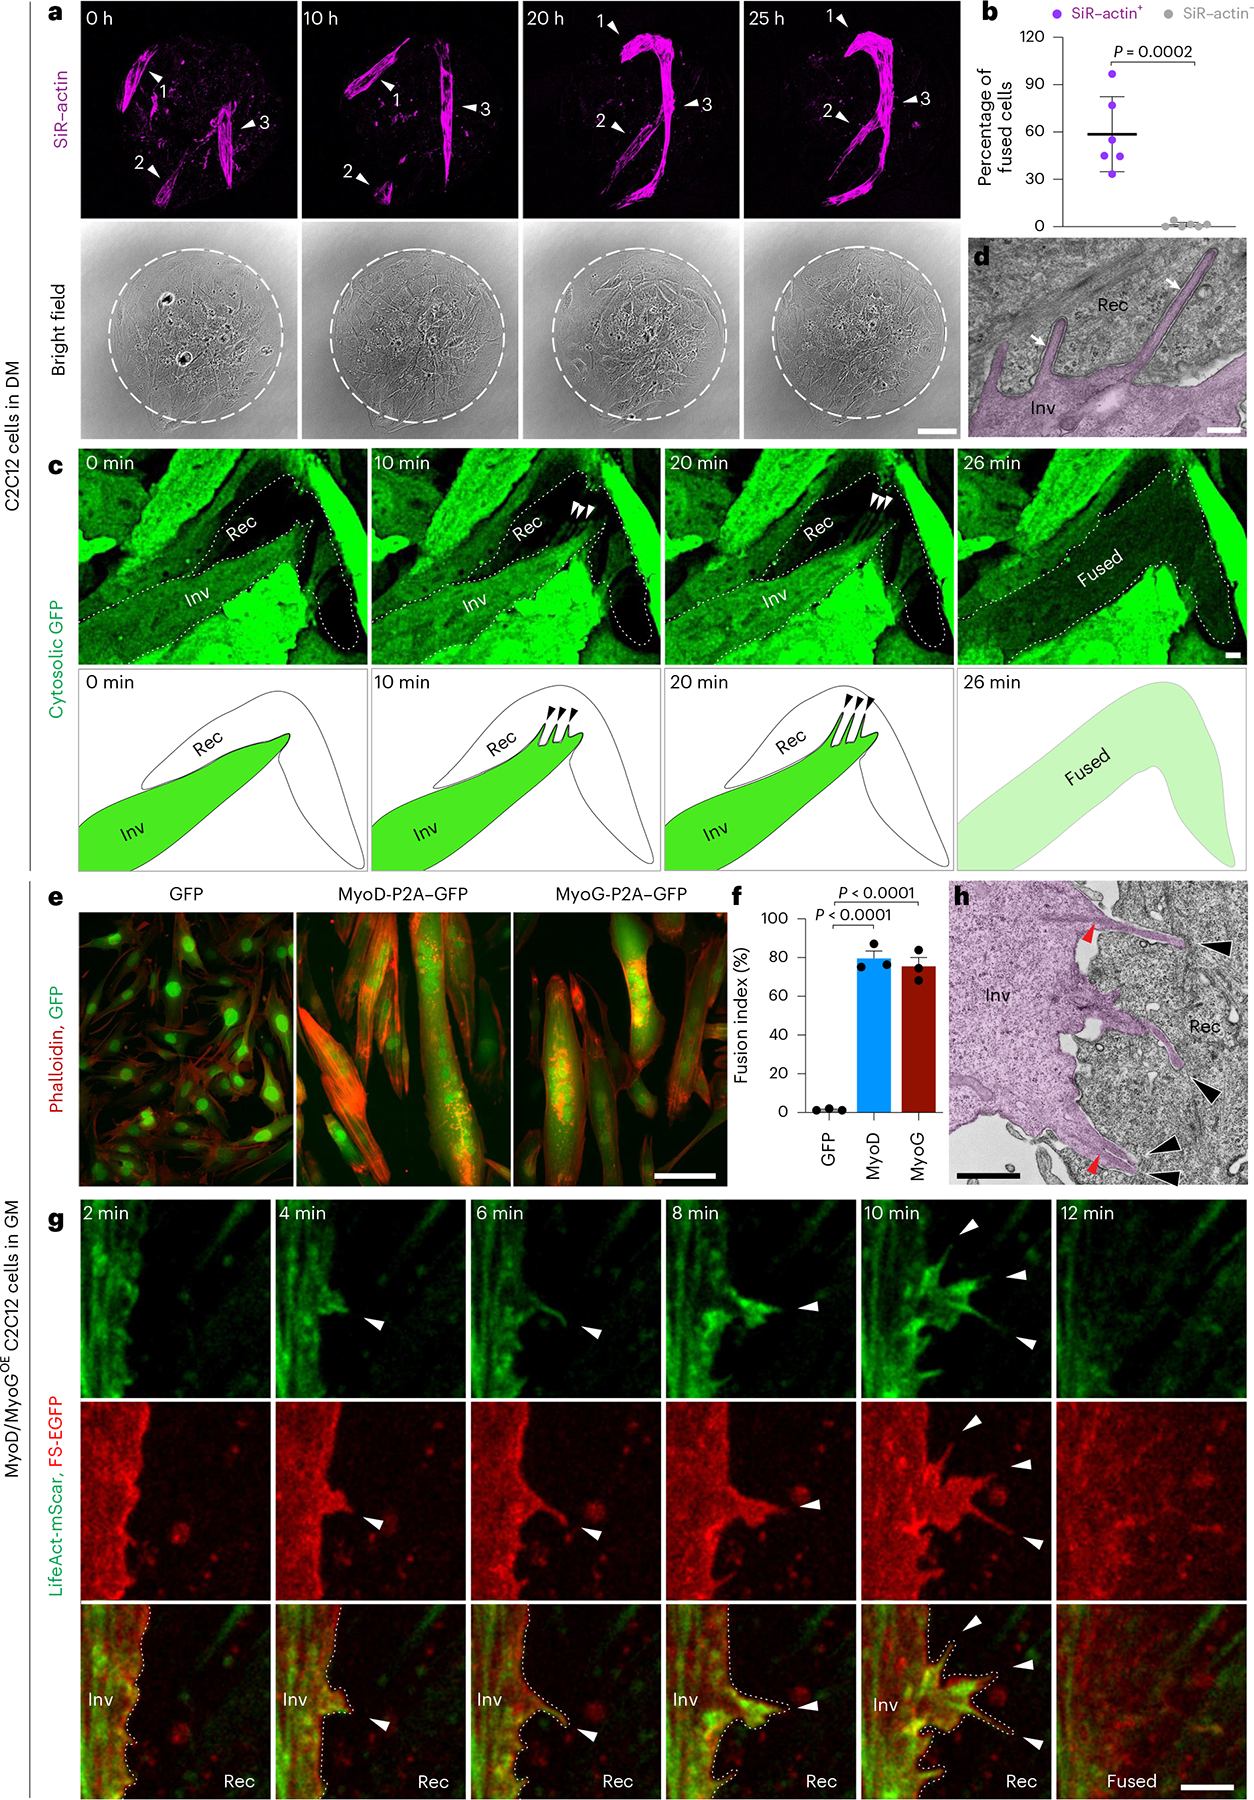
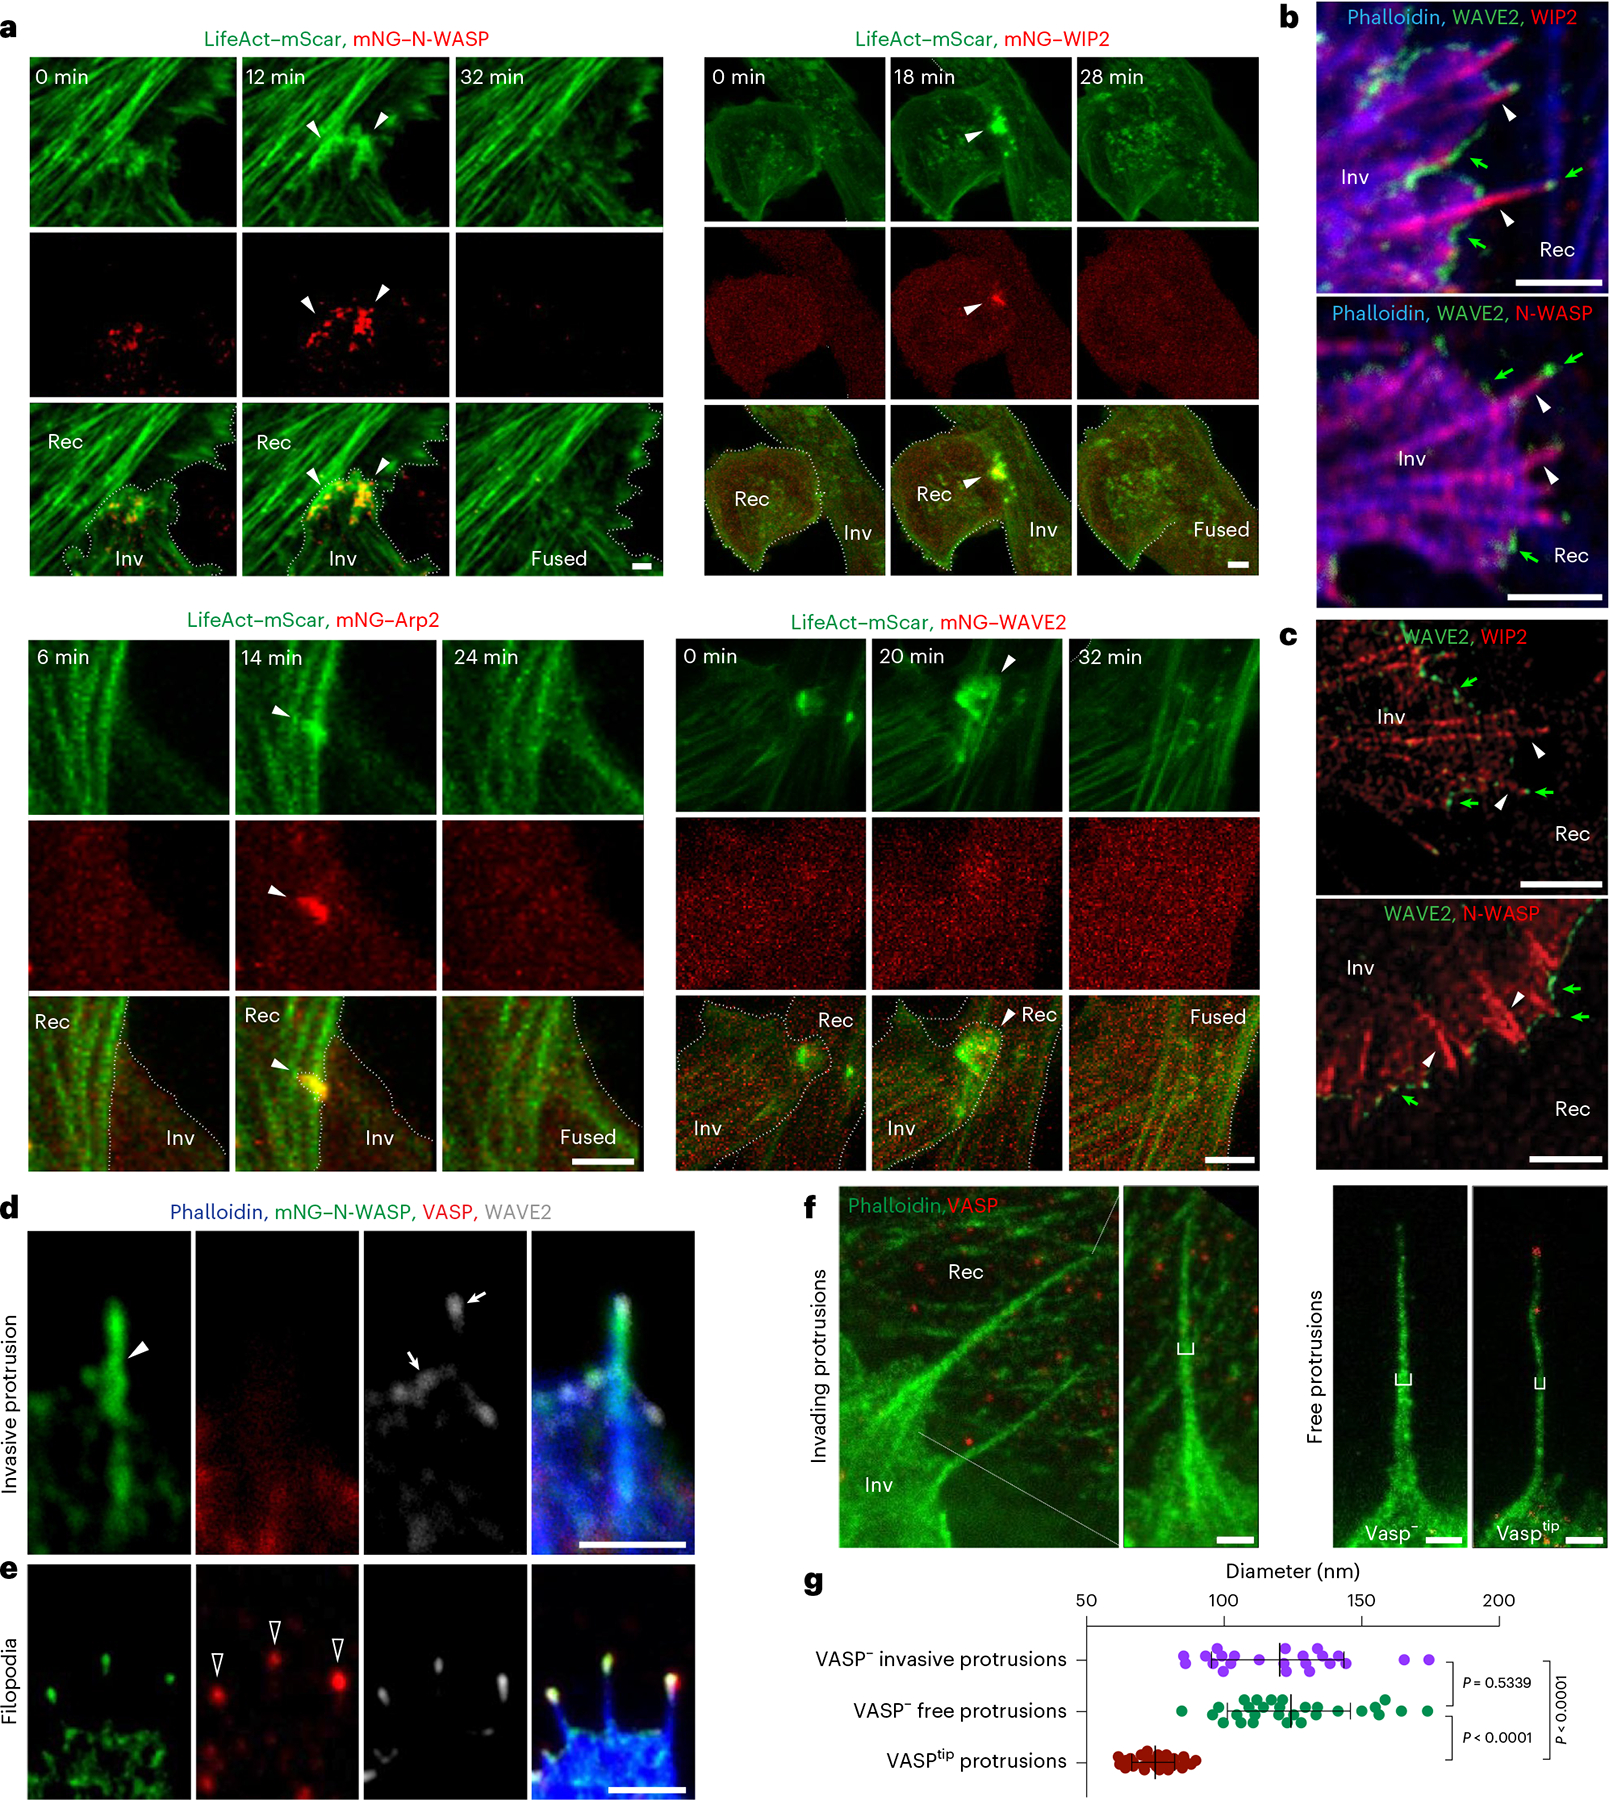
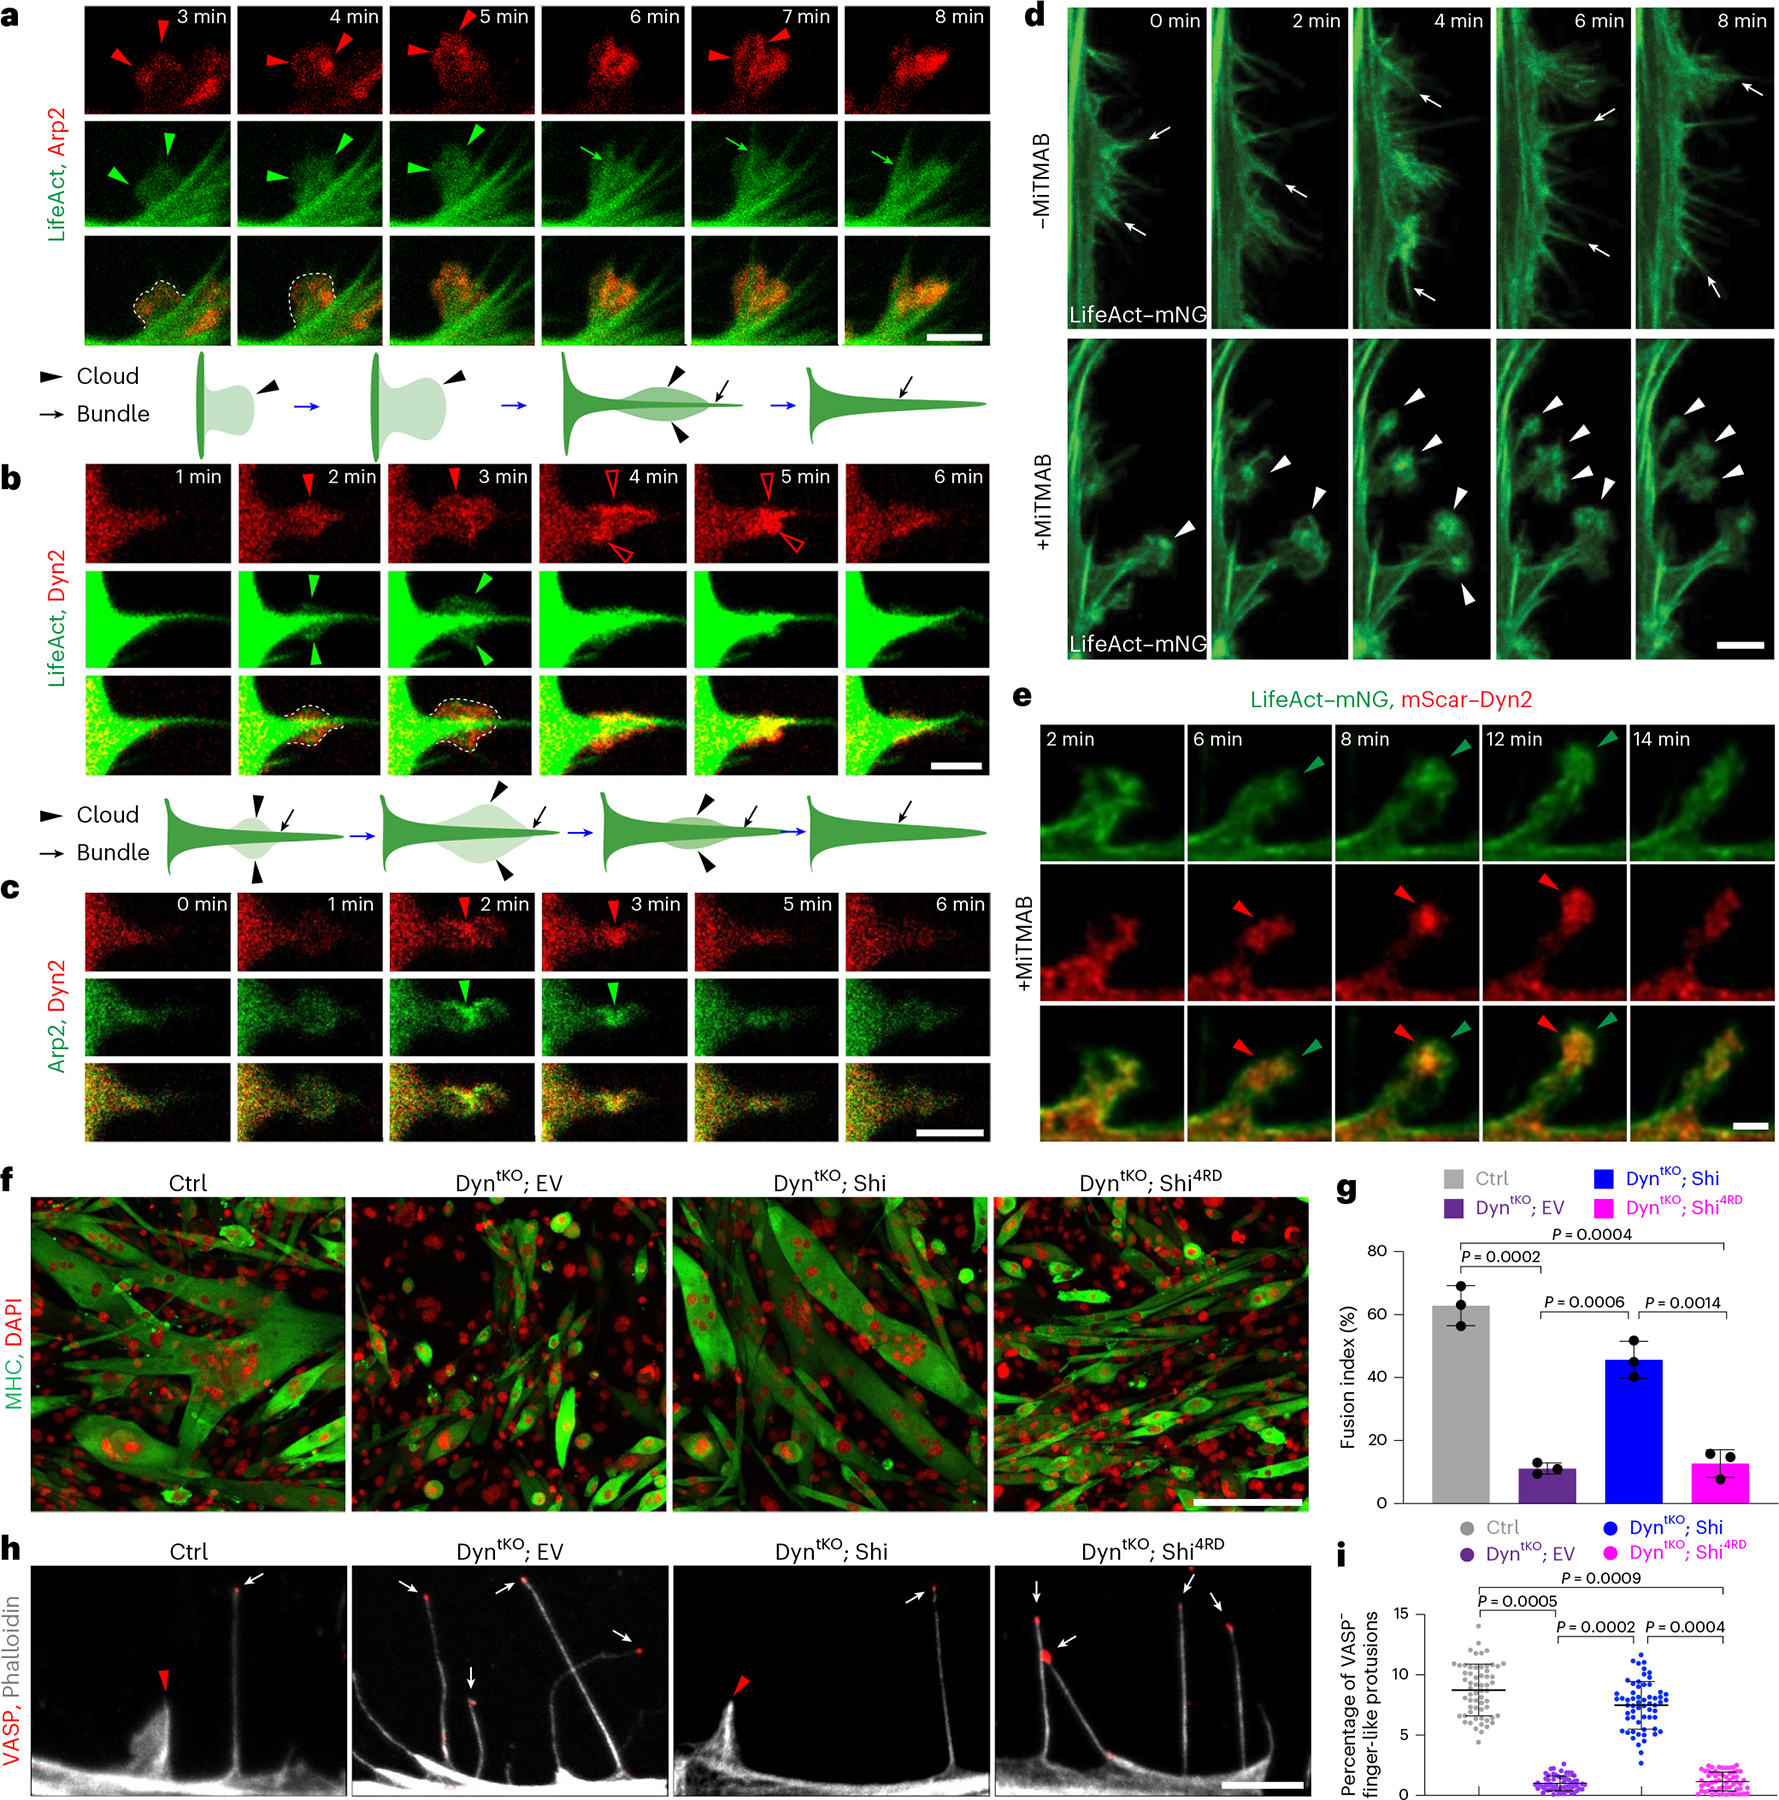
Invasive membrane protrusions play a central role in a variety of cellular processes. Unlike filopodia, invasive protrusions are mechanically stiff and propelled by branched actin polymerization. However, how branched actin filaments are organized to create finger-like invasive protrusions is unclear. Here, by examining the mammalian fusogenic synapse, where invasive protrusions are generated to promote cell membrane juxtaposition and fusion, we have uncovered the mechanism underlying invasive protrusion formation. We show that two nucleation-promoting factors for the Arp2/3 complex, WAVE and N-WASP, exhibit different localization patterns in the protrusions. Whereas WAVE is closely associated with the plasma membrane at the leading edge of the protrusive structures, N-WASP is enriched with WIP along the actin bundles in the shafts of the protrusions. During protrusion initiation and growth, the Arp2/3 complex nucleates branched actin filaments to generate low-density actin clouds in which the large GTPase dynamin organizes the new branched actin filaments into bundles, followed by actin-bundle stabilization by WIP, the latter functioning as an actin-bundling protein. Disruption of any of these components results in defective protrusions and failed myoblast fusion in cultured cells and mouse embryos. Together, our study has revealed the intricate spatiotemporal coordination between two nucleation-promoting factors and two actin-bundling proteins in building invasive protrusions at the mammalian fusogenic synapse and has general implications in understanding invasive protrusion formation in cellular processes beyond cell-cell fusion.


Conflict of interest statement

Competing interests The authors declare no competing interests.

Figures

Extended Data Fig. 1 |
Extended Data Fig. 1 |. F-actin-enriched invasive protrusions mediate the fusion of C2C12 and satellite cells.
a, MyoG, MHC, phalloidin, and DAPI staining of wild-type C2C12 cells cultured in DM. Arrowheads: a few randomly selected F-actinhigh cells. b, Quantification of the phalloidin signal intensity in MyoG and MyoG+ cells in (a). 122, 130 and 130 cells in n = 3 independent experiments were analysed (Statistics Source Data-Extended Data Fig. 1b). c, SiR-Actin labelling of U2OS cells at three days post MyoG overexpression. n = 3 independent experiments were performed with similar results. d,e, WB for MyoG, MHC, α-, β-, γ-, and pan-actin in U2OS cells in (c) (Statistics Source Data-Extended Data Fig. 1e). n = 3 independent experiments were performed with similar results. f, Schematic diagrams of the live imaging experiments of C2C12 cell fusion in DM. O/N: overnight. g, Time-lapse stills showing a fusion event between F-tractin-mCherry-expressing C2C12 cells with or without cytosolic GFP in DM. Note that the F-actin-enriched membrane protrusion (1.5 min, arrowhead) led to fusion pore formation indicated by GFP transfer from the top cell to the bottom (3 min, arrow) (Supplementary Video 3). h, Time-lapse stills showing a fusion event between two satellite cells cultured in DM. Boxed areas are enlarged at the bottom. Note the presence of an actin-enriched protrusion (56 min, arrowhead) prior to cell–cell fusion, and the subsequent LifeAct-mNG transfer from the invading cell to the receiving cell (58 min) after fusion (Supplementary Video 4). i, Time-lapse stills showing a fusion event between satellite cells cultured in GM supplemented with an Erk1/2 inhibitor. Boxed areas are enlarged at the bottom. Note that the invading cell projected actin- and Arp2-enriched protrusions (40 min, arrowheads) prior to cell fusion (48 min) (Supplementary Video 5). j, Schematic diagrams of the live imaging experiments of MyoDOE cell fusion in GM. k, Zoomed-out view of the fusion event shown in Fig. 1g. The boxed areas are enlarged in Fig. 1g. (a,c,i) Max z-projection of 8–10 focal planes from the ventral plasma membrane (z-step size: 500 nm). (g,h,k) Single plane confocal images. Mean ± s.d. values are shown in the line graph (b) and bar-dot plot (e), and significance was determined by two-tailed Student’s t-test. In (g,h,i,k), n = 23, 18, 7 and 3 fusion events were observed with similar results. The cell boundaries are delineated by dotted lines. Scale bars: 50 μm (a), 200 μm (c), 10 μm (h, top panel); 5 μm (h, bottom panel) and 10 μm (g,i,k).
Extended Data Fig. 2 |
Extended Data Fig. 2 |. The expression and localization of sarcomeric and cytosolic actin isoforms during mouse myoblast fusion.
a, WB for α-, β-, and γ-actin in C2C12 cells during differentiation in DM. b, Quantification of the results in (a). The band intensity of each protein at each time point was normalized against β-tubulin. The y axis indicates the expression at the indicated time points relative to that in GM (Statistics Source Data-Extended Data Fig. 2b). c,d, Immunostaining for α-, β-, and γ-actin in C2C12 cells at 48 h post MyoD overexpression. The cell boundaries are delineated by dotted lines. Arrowheads in (c): fusogenic synapse (fs). Arrowheads in (d): invasive protrusions. n = 3 independent experiments were performed for all actin isoforms with similar results. e,f, WB for α-, β-, and γ-actin in the control (-Dox) and cKD ( + Dox) cells as described in Fig. 2a,b. The band intensity of each protein at each time point was normalized against β-tubulin. The y axis indicates the expression of a protein in cKD relative to that in control cells (Statistics Source Data-Extended Data Fig. 2f). g, WB for α-, β-, and γ-actin in N-WASP−/−, WIP2−/−, WAVE2−/− KO, and Arp2 KD C2C12 cells at 48 h post MyoD overexpression. h, Quantification of protein expression in (g). The band intensity of each protein was normalized against β-tubulin. For each actin isoform, the x axis indicates its expression in different mutants relative to that in control cells (Statistics Source Data-Extended Data Fig. 2h). Mean ± s.d. values are shown in the line graph (b,f) and bar-dot plot (g), and significance was determined by two-tailed Student’s t-test. n = 3 independent experiments were performed. (c) Max z-projection of 8–10 focal planes from the ventral plasma membrane (z-step size: 500 nm). (d) Single plane confocal images. Scale bars: 30 μm (c) and 3 μm (d).
Extended Data Fig. 3 |
Extended Data Fig. 3 |. Branched actin polymerization promotes mouse myoblast fusion.
a, Schematic diagram of pharmacological treatment of C2C12 cells with actin polymerization inhibitors. b, MHC, MyoG, and DAPI staining of C2C12 cells at 24 h post DMSO (0.05%), CytD (18 nM), CK666 (50 μM), and SMIFH2 (10 μM) treatment in DM. c,d, Quantification of the differentiation index (c) and fusion index (d) for experiments shown in (b). 4,702, 4,598, 4,986 and 4,603 nuclei for each condition (from left to right) in n = 3 independent experiments were analysed (Statistics Source Data-Extended Data Figs.3c,3d). e,f, WB for NPFs, the Arp2/3 complex, muscle differentiation markers, and the fusogenic protein MymX in C2C12 cells (e) or satellite cells (f) in GM and DM. g, WB showing the KD efficiency of two independent shRNAs against N-WASP, WAVE2, and WIP2 in C2C12 cells. h, MHC and DAPI staining of C2C12 cells treated with the shRNAs in (g) at day five of differentiation. ik, WB for the NPFs and muscle differentiation markers of the control and NPF KD cells in (h). l, Quantification of the fusion index in (h). 4,076, 4,970, 4,586, 4,523, 4,371, 4,463 and 4,683 nuclei for each condition (from left to right) in n = 3 independent experiments were analysed. (Statistics Source Data-Extended Data Fig. 3l). m, Quantification of MyoG and MHC protein expression in the cKD cells shown in Fig. 2b. The band intensity of each protein at each time point was normalized against β-tubulin. The y axis indicates the expression of MyoG or MHC in both Ctrl (-Dox) and cKD (+Dox) cells at each time point relative to that in Ctrl cells at day five in DM. n= 3 independent experiments were performed (Statistics Source Data-Extended Data Fig. 3m). n, Quantification of MyoG and MHC protein expression in N-WASP−/−, WIP2−/−, WAVE2−/−, and Arp2 KD cells shown in Fig. 2e. The band intensity of each protein was normalized against β-tubulin. The y axis indicates the expression of MyoG or MHC in different mutants relative to the control (sgNT or shNT) cells. RC: rescue construct of the corresponding KO/KD gene. n = 3 independent experiments were performed (Statistics Source DataExtended Data Fig. 3n). o, Quantification of cell motility in N-WASP−/−, WIP2−/−, WAVE2−/−, and Arp2 KD cells (Supplementary Video 7). Each cell was tracked by TrackMate using ImageJ and is shown as one dot in the dot plot. n ≥ 223 cells of each genotype from three independent experiments were analysed (Statistics Source Data-Extended Data Fig. 3o). (b,h) Epifluorescence images. Scale bars: 50 μm. Mean ± s.d. values are shown in the line graph (m), bar-dot plot (c,d,l,n), and dot plot (o), and significance was determined by two-tailed Student’s t-test. In (e-k), n = 3 independent experiments were performed with similar results.
Extended Data Fig. 4 |
Extended Data Fig. 4 |. The dynamic enrichment of NPFs in the invasive protrusions at the fusogenic synapse.
a,b, mNG-tagged N-WASP, WIP2, WAVE2, and Arp2 rescued the fusion defects in N-WASP-, WIP2-, WAVE2- and Arp2-KD cells, respectively. The KD cells were infected by retrovirus containing the corresponding KD gene with an mNG tag. After two days, the cells were plated and allowed to grow in GM into 100% confluence, before switching into DM. At day five in DM, the cells were collected for WB (a) and staining with anti-MHC and DAPI (b). c, Quantification of the fusion index in (b). 4,546, 4,859, 4,859, 4,637, 4,359, 4,067, 4,627, 4,012 and 4,396 nuclei for each genotype (from left to right) in n = 3 independent experiments were analysed. Mean ± s.d. values are shown in the bar-dot plot, and significance was determined by two-tailed Student’s t-test (Statistics Source Data-Extended Data Fig. 4c). d, Time-lapse stills of single-plane confocal images showing the fusion events in Fig. 3a (Supplementary Video 8). n = 3 independent experiments were performed with similar results. e, WAVE2 and phalloidin staining of a mixed culture of wild-type and WAVE2 KD C2C12 cells. n = 3 experiments were performed with similar results. f, Single-channel images of the merged images shown in Fig. 3b,c. n = 3 independent experiments were performed with similar results. g,h, Time-lapse stills of single-plane confocal images showing that N-WASP (g) and WIP2 (h) co-localized with F-actin along the shafts of straight protrusions (Supplementary Video 9,10). Arrowheads: randomly selected protrusions. n = 3 experiments were performed with similar results. (b) Epifluorescence images. (d,f-h) Single plane confocal images. (e) Max z-projection of 8–10 focal planes from the ventral plasma membrane (z-step size: 500 nm). Scale bars: 200 μm (b), 30 μm (e), 2 μm (f) and 5 μm (d,g,h).
Extended Data Fig. 5 |
Extended Data Fig. 5 |. C2C12 cells generate both invasive protrusions and filopodia during differentiation.
a, Immunostaining with anti-VASP in C2C12 cells expressing mNG–WIP2 at day two post MyoD overexpression. The cortical region of a randomly picked cell is shown. n = 20 cells from three independent experiments were examined with similar results. b, Enlarged view of the yellow-boxed area in (a). arrowheads: mNG-WIP2 enrichment. c, Enlarged view of the red-boxed area in (a). Hollow arrowheads: VASP enrichment. d, Analysis of WIP2 enrichment in the VASP and VASPtip protrusions in cells as in (a). Note that the cells projected two types of protrusions, VASP and VASPtip. Most of the VASP protrusions, but none of the VASPtip protrusions, had WIP2 enrichment in their shafts. A total of n = 302 protrusions from ten randomly selected cells were analysed (Statistics Source Data-Extended Data Fig. 5d). e,f, Immunostaining with anti-Mena (or anti-EVL), anti-VASP, and phalloidin of cells as in (a). Randomly selected WIP2shaft+VASP invasive protrusions (inv. pro.) and WIP2shaft− VASPtip filopodia are shown for Mena- (e) and EVL- (f) labelling. g, Quantification of the percentage of Mena+ (e) and EVL+ (f) protrusions. Note that neither Mena or EVL was localized in the invasive protrusions (0 out of n ≥ 90 WIP2shaft+VASP protrusions). EVL was co-enriched with VASP at the tips of ~21% filopodia (41 out of n = 199 WIP2shaft−VASPtip filopodia), and Mena was rarely observed at the tip of any filopodia (1 out of n = 186 WIP2shaft−VASPtip filopodia) (Statistics Source Data-Extended Data Fig. 5g). h, VASP and phalloidin staining of cells as in (a) showing the absence of Ena/VASP family member enrichment in the invasive protrusions (arrowheads) at a fusogenic synapse. n ≥ 10 fusogenic synapses for each protein were examined with similar results. Cell boundaries are delineated by dotted lines. (ac,e,f,h) Single plane confocal images. (d,g) Mean ± s.d. values are shown in the dot-plot. Scale bars: 2 μm (a,b,c), 3 μm (e), 1 μm (f,g) and 10 μm (i).
Extended Data Fig. 6 |
Extended Data Fig. 6 |. Both WH2 domains of WIP2 are required for actin bundling and invasive protrusion formation.
a,b, High-speed (a) and low-speed (b) F-actin co-sedimentation assays for the WH2 domains of WIP2. 4 μM mNG-WH2–1 (mNG-tagged first WH2 domain (aa 35–53)), mNG-WH2–2 (mNG-tagged second WH2 domain (aa 80–105)), or mNG-WIP2-N (mNG-tagged N-terminal domain of WIP2 containing both WH2–1 and WH2–2 (aa 1–176)) was incubated with or without 5 μM F-actin at RT. After 30 min, the samples were subjected to high-speed (a; 100,000g) or low-speed (b; 13,600g) centrifugation. After centrifugation, the supernatant (S) and pellet (P) were subjected to SDS–PAGE. In (a), all three purified proteins bound F-actin (present in the pellet only when incubated with F-actin) (arrowheads), with mNG-WH2–2 showing weaker binding compared to mNG-WH2–1. In (b), F-actin was bundled by mNG-WIP2-N (arrowhead), but not by mNG-WH2–1 or mNG-WH2–2 (arrows). n = 3 independent experiments were performed for (a) and (b) with similar results. c, Zoomed-out view of the cells in Fig. 5f. The boxed areas are enlarged in Fig. 5f. A single-plane confocal image is shown for each image. n = 3 independent experiments for each cell type were performed with similar results. Scale bar: 10 μm.
Extended Data Fig. 7 |
Extended Data Fig. 7 |. Both dynamin and WIP2 are involved in actin bundling during invasive protrusion formation.
ac, The Dyn2 antibody specifically recognizes Dyn2. Ctrl, 4OH-tamoxifen-induced dynamin 1/2/3-tKO MEFs, and Dyn2 KD C2C12 cells were immunostained (a,b) or harvested for WB (c). Note that anti-Dyn2 detected no signal in tKO cells and greatly reduced signals in dyn2 KD cells, indicating its specificity. d, Dyn2 and phalloidin staining of Arp2-mNG-expressing C2C12 cells at day two of MyoD overexpression. Arrows: actin bundles; red arrowheads: Dyn2 enrichment; blue arrowheads: Arp2 enrichment. e, MiTMAB inhibits the disassembly of dynamin helices in the presence of GTP. Note that the dynamin-induced actin bundles were disassembled by GTP addition (top right panel). MiTMAB did not bundle actin by itself (bottom left panel) or inhibit dynamin-induced actin bundling (bottom middle panel), but it inhibited dynamin helix disassembly in the presence of GTP, thus leaving the actin bundles intact (bottom right panel). f, Specificity test of the HA antibody used in the immunogold labelling experiments. Boxed area is enlarged on the right. Dyn2 KD C2C12 cells (without Dyn2–3×HA expression) at day two of MyoD overexpression were stained with anti-HA for immunogold labelling, followed by PREM analysis. Note the absence of gold particles in these cells, demonstrating the specificity of both the primary and secondary antibodies. n = 13 protrusions were imaged with similar results. g, Another set of electron micrographs showing negatively stained, partially dissembled Shi-actin bundles by GTP hydrolysis without (top panel) or with (bottom panel) mNG-WIP-N addition (related to Fig. 7i). Arrowheads: randomly selected Shi helical rungs; green dashed lines: regions of bundled actin by Shi helices; yellow bracket: a stretch of loosened actin bundle without Shi; red dashed lines: tightened actin bundle by mNG-WIP2-N; arrows: mNG-WIP2-N patches on the bundle. (a,b) Epifluorescence images. (d,e) Single plane confocal images. In (ae,g), n = 3 independent experiments were performed with similar results. Scale bars: 50 μm (a,b,e), 4 μm (d), 100 nm (f) and 300 nm (g).
Extended Data Fig. 8 |
Extended Data Fig. 8 |. Branched actin polymerization is not required for myoblast proliferation and muscle-specific gene expression during skeletal muscle development.
a, Whole-mount MHC staining of embryo forelimbs shown in Fig. 8a at E17.5. n = 3 embryos of each genotype were examined with similar results. b, Ki67 (proliferation maker), MyoD/Pax7 (muscle progenitor markers), and DAPI staining of cross sections of forelimb muscle from E12.5, E15.5, and E17.5 control and mutant embryos shown in Fig. 8b. c, MyoG, MHC, and DAPI staining of cross sections of forelimb muscle from E12.5, E15.5, and E17.5 control and mutant embryos shown in Fig. 8b. d, Quantification of the proliferating myoblasts of the genotypes shown in (a). The percentage of Ki67+ nuclei out of Pax7/MyoD+ nuclei was quantified. Note that Ki67’s expression in muscle progenitors of the mutant embryos was normal. 1,494, 1,379, 1,479, 1,273, 1,056 and 1,430 cells at E12.5; 827, 959, 1,137, 1,056, 1,041 and 1,099 cells at E15.5; 881, 848, 672, 863, 794 and 900 cells at E17.5 in n = 3 embryos for each genotype (from top to bottom) were counted (Statistics Source Data-Extended Data Fig. 8c). e, Quantification of the percentage of MyoG+ nuclei out of the total nuclei in the samples in (b). Note that MyoG’s expression in muscle progenitors of the mutant embryos was normal. 2,671, 2,621, 2,683, 3,059, 3,480 and 3,358 nuclei at E12.5; 2,624, 3,139, 3,315, 2,983, 2,559 and 2,982 nuclei at E15.5; 3,253, 3,327, 2,614, 2,643, 3,392 and 3,164 nuclei at E17.5 in n = 3 embryos for each genotype (from top to bottom) were counted (Statistics Source Data-Extended Data Fig. 8d). For (d,e), Mean ± s.d. values are shown in the bar-dot plots, and significance was determined by two-tailed student’s t-test. (b,c) Single plane confocal images. Scale bars: 0.3 mm (a) and 100 μm (b,c).
Fig. 1 |
Fig. 1 |. Mouse myoblast fusion is mediated by finger-like invasive protrusions at the fusogenic synapse.
a, Time-lapse still images showing fusion events between SiR–actin-labelled C2C12 cells cultured on a micropattern (illustrated schematically in Extended Data Fig. 1f). Three fusing myoblasts (arrowheads) are labelled (1–3; Supplementary Video 1). The boundaries of the micropatterns in bright field are delineated by the dashed white circles. b, Comparison of the percentage of fused SiR–actin+ versus SiR–actin cells tracked by live imaging; n = 309 SiR–actin+ and 361 SiR–actin cells were tracked in n = 6 independent experiments. c, Time-lapse still images showing a fusion event between GFP+ and GFP C2C12 cells (top). The cell boundaries, except for the protrusive area, of the invading and receiving cells are delineated by dotted lines (Supplementary Video 2). Schematic diagram of this fusion event (bottom). The arrowheads point to protrusions; n = 22 fusion events were observed with similar results. d, Electron micrograph of C2C12 cells cultured for 48 h in DM. The invading cell is pseudo-coloured in magenta. The arrows point to invasive protrusions at the cell–cell contact site; n = 15 cell–cell contact sites were observed with similar results. e, Epifluorescence images of phalloidin staining of C2C12 cells at low cell density in GM 72 h post overexpression of GFP, MyoD-P2A–GFP or MyoG-P2A–GFP. P2A, self-cleaving porcine teschovirus-1 2A peptide. f, Calculated fusion index from e; n = 1,322, 1,706 and 1,452 nuclei were analysed in cells overexpressing GFP, MyoD-P2A–GFP and MyoG-P2A–GFP, respectively, in n = 3 independent experiments. g, Time-lapse still images (single-plane confocal images) showing a fusion event between two MyoDOE cells expressing LifeAct-mScarleti (mScar) (green) and farnesylation signal (FS)-EGFP (red) (schematic and zoomed-out view in Extended Data Fig. 1j and k, respectively). Cell boundaries are delineated by dotted lines in the merge channels (bottom; Supplementary Video 6). Arrowheads point to invasive protrusions; n = 51 fusion events were observed with similar results. h, Electron micrograph of MyoDOE cells 48 h post MyoD overexpression. The invading cell is pseudo-coloured in magenta. Invasive protrusions are indicated with black arrowheads and dense actin bundles along the shaft of the protrusions with red arrowheads; n = 13 cell–cell contact sites were observed with similar results. a,c, Maximum z-projections of 8–10 focal planes from the ventral plasma membrane (z-step size, 500 nm). b,f, Data are the mean ± s.d. Statistical significance was determined using a two-tailed Student’s t-test. a,ce,g,h, Scale bars, 55 μm (a), 5 μm (c), 500 nm (d), 100 μm (e), 3 μm (g) and 2 μm (h). Inv, invading cell; Rec, receiving cell.
Fig. 2 |
Fig. 2 |. Branched actin polymerization promotes mouse myoblast fusion.
a, Schematic of the cKD of genes during myoblast fusion. b, Western blots showing the cKD of branched actin polymerization regulators during myoblast fusion. Control (−Dox) and KD (+Dox) cells described in a were harvested at the indicated time points to examine the protein levels of NPFs, the Arp2/3 complex as well as the muscle differentiation markers MyoG and MHC. c, Immunostaining of the control and cKD cells described in b with anti-MHC and 4,6-diamidino-2-phenylindole (DAPI) on day five of differentiation. d, Calculated fusion index from c; n = 4,946, 3,565, 4,337, 3,835, 3,125, 3,030, 3,381 and 4,518 (from left to right) nuclei of cells with the indicated conditions were analysed in n = 3 independent experiments. e, Western blots showing that depletion of N-WASP, WAVE2 or Arp2, but not WIP2, led to a decrease in the expression of other members of the respective complexes. Note that N-WASP expression remained unchanged in WIP2−/− cells. Expression of other members of the protein complex in rescued cells recovered to normal levels. EV, empty vector; sgNT, non-targeting single-guide RNA (sgRNA). f, Immunostaining of the cells described in e with anti-MHC and DAPI 72 h post MyoD overexpression. g, Calculated fusion index from f; n = 4,672, 4,102, 3,768, 3,483, 4,762, 4,102, 3,555, 3,399, 3,384 and 4,390 (from left to right) nuclei in the indicated genotypes were analysed in n = 3 independent experiments. RC, rescue construct of the corresponding KO/KD gene. h, Phalloidin and DAPI staining of control and NPF-KO cells described in e two days post MymK and MymX co-overexpression in GM. i, Calculated fusion index from h; n = 4,345, 3,107, 4,751 and 4,671 nuclei in sgNT, N-WASP−/−, WIP2−/− and WAVE2−/− cells, respectively, were analysed in n = 3 independent experiments. c,f,h, Epifluorescence images. Scale bars, 100 μm (c) and 200 μm (f,h). d,g,i, Data are the mean ± s.d. Statistical significance was determined using a two-tailed Student’s t-test; n = 3 independent experiments. shNT, non-targeting shRNA; shN-WASP, shWIP2, shWAVE2 and shArp2, shRNA targeting N-WASP, WIP2, WAVE2 and Arp2, respectively.
Fig. 3 |
Fig. 3 |. Localization of branched actin polymerization machinery in invasive protrusions.
a, Time-lapse still images showing stable C2C12 cell lines coexpressing LifeAct–mScar and mNG–N-WASP (mNG–WIP2, mNG–WAVE2 or Arp2–mNG) after 48 h of MyoD overexpression. Cell boundaries are delineated by dotted lines in the merge panels (Supplementary Video 8); n ≥ 15 fusogenic synapses (arrowheads) were imaged for each stable line with similar results. Maximum z-projection of 8–10 focal planes from the ventral plasma membrane (z-step size, 500 nm; single-plane confocal images are shown in Extended Data Fig. 4d). b,c, Representative confocal (b) and SIM (c) images showing stable C2C12 cell lines expressing 3×Flag–WIP2 or 3×Flag–N-WASP immunostained with anti-WAVE2, anti-Flag and phalloidin after 48 h of MyoD overexpression. The green arrows indicate WAVE2 enrichment and white arrowheads N-WASP and WIP2 enrichment; n ≥ 20 cells were imaged for each cell type with similar results. b, Single-channel images are shown in Extended Data Fig. 4f. d,e, Immunostaining of mNG–N-WASP-expressing C2C12 cells with anti-WAVE2, anti-VASP and phalloidin after 48 h of MyoD overexpression; n = 25 protrusions of each type were imaged with similar results. d, Arrowheads point to N-WASP enrichment in the shaft of a VASP invasive protrusion and arrows to WAVE2 enrichment at the leading edge and tip of the invasive protrusion. e, Hollow arrowheads indicate VASP, N-WASP and WAVE2 enrichment at the tips of VASPtip protrusions (filopodia). f, Representative STED images of C2C12 cells immunostained with anti-VASP and phalloidin 48 h post MyoD overexpression. bf, Single-plane confocal images. g, Protrusion diameters at the midpoint of the VASPtip protrusions in f (indicated by brackets). Note that the VASP protrusions (both invasive and free) had similar diameters, which were significantly wider than that of the VASPtip protrusions. Data are the mean ± s.d. Statistical significance was determined using two-tailed Student’s t-test; n = 23, 29 and 30 randomly selected protrusions of each type (from top to bottom) in 12, 14 and 14 cells were analysed in n = 3 independent experiments. af, Scale bars, 5 μm (a), 2 μm (be) and 500 nm (f).
Fig. 4 |
Fig. 4 |. N-WASP–WIP2 and WAVE2 have distinct functions during protrusion formation.
a, Time-lapse still images showing cortical protrusion formation in (i) wild-type control (Ctrl), (ii)–(iv) NPF-KO and (v) Arp2-KD C2C12 cells 48 h post MyoD overexpression (Supplementary Video 11). Randomly selected cortical regions containing finger-like protrusions (arrowheads) and lamellipodia (asterisks) are shown. Note the straight versus bendy protrusions projected from the leading edge of the lamellipodia in Ctrl (i) versus N-WASP−/− (iii) cells, the loss of lamellipodia and the decreased number of protrusions in WAVE2−/− cells (ii), the bendy protrusions in WIP2−/− cells (iv) and no protrusions in Arp2-KD cells (v). Maximum z-projections of 8–10 focal planes from the ventral plasma membrane (z-step size, 500 nm). b, Number of newly formed finger-like protrusions in cells with the genotypes shown in a; n = 86, 82, 90, 79 and 67 (left to right) cells from n = 3 independent experiments were measured for each genotype. cg, Localization of N-WASP, WIP2, WAVE2 and VASP in individual protrusions of Ctrl and mutant MyoDOE cells. Ctrl cells expressing mNG–N-WIP2 (c) or mNG–N-WASP (d), WAVE2−/− cells expressing mNG–N-WASP (e), N-WASP−/− cells (f) and WIP2−/− cells expressing mNG–N-WASP (g) were immunostained with anti-WAVE2, anti-VASP and phalloidin 48 h post MyoD overexpression. The arrowheads point to WIP2 (c) and N-WASP (d,e) enrichment in the shafts of VASP invasive protrusions, arrows to WAVE2 enrichment at the leading edge and tips of invasive protrusions (c,f) and hollow arrowheads to VASP enrichment at the tips of filopodia (f,g). Single-plane confocal images. h, Percentage of VASP protrusions in cells with the genotypes shown in cg; n = 60 cells from n = 3 independent experiments were quantified for each genotype. b,h, Data are the mean ± s.d. Statistical significance was determined using a two-tailed Student’s t-test. a,cg, Scale bars, 10 μm (a), 3 μm (eg), 2 μm (c) and 1.5 μm (d).
Fig. 5 |
Fig. 5 |. WIP2 is an actin-bundling protein.
a, Low-speed co-sedimentation assay showing mNG–WIP2-N bundles F-actin. b, TIRF images of WIP2- and Shi-mediated actin bundling (Supplementary Video 12). S, supernatant; P, pellet. c, Time-lapse still TIRF images showing three examples of mNG–WIP2-mediated actin filament bundling (Supplementary Video 13). Magenta and green dots indicate actin filaments being bundled; n = 3 independent imaging experiments were performed with similar results. d, SIM images of mNG–WIP2-N-mediated actin bundles visualized using phalloidin. e, Electron micrographs of negatively stained actin filaments alone (top), WIP2–actin bundles with different diameters (middle) as well as dynamin–actin single and ‘super’ bundles (bottom). The hollow arrowheads point to randomly selected mNG–WIP2-N patches, white arrowheads point to randomly selected dynamin helical rungs and asterisks indicate single bundles in a four-helix dynamin–actin super bundle. f, Control and WIP2−/− cells expressing mNG–WIP2FL, mNG–WIP2ΔWH2–1, mNG–WIP2ΔWH2–2, mNG–WIP2ΔWH2-N or mNG immunostained with anti-VASP and phalloidin after 48 h of MyoD overexpression. Single-plane confocal images. The red arrowheads point to VASP protrusions and the white arrows to VASP enrichment at filopodial tips. Zoomed-out views of the cells are shown in Extended Data Fig. 6c. g, Epifluorescence images of cells with the genotypes in f stained with phalloidin and DAPI 72 h post MyoD overexpression. h, Percentage of VASP protrusions for each genotype in f; n = 523, 604, 579, 612, 557 and 498 (from left to right) randomly selected protrusions in 60 cells of each genotype from n = 3 independent experiments were analysed. i, Bendiness of the protrusions in the indicated genotypes, with each data point calculated as the change in tortuosity index relative to the mean index of Ctrl cells (dashed line); n = 54, 54, 53, 54, 53 and 55 (from left to right) protrusions in 14 cells of each genotype from n = 3 independent experiments were analysed. j, Calculated fusion index from g; n = 3,485, 3,264, 4,023, 3,890, 4,891 and 4,567 nuclei for the indicated genotypes (from left to right) were analysed in n = 3 independent experiments. ae, n = 3 independent experiments were performed with similar results. hj, Data are the mean ± s.d. Statistical significance was determined using a two-tailed Student’s t-test. bg, Scale bars, 10 μm (b), 2 μm (c), 1 μm (d), 100 nm (e), 5 μm (f) and 50 μm (g).
Fig. 6 |
Fig. 6 |. Dynamin is required for bundling the Arp2/3 complex-nucleated branched actin filaments.
ac, Time-lapse still images showing the dynamic localization of Arp2, Dyn2 and newly polymerized branched actin filaments in C2C12 cells 48 h post MyoD overexpression (Supplementary Video 14–16). The red arrowheads point to Arp2–mScar (a) and mScar–Dyn2 (b, 2 and 3 min) enrichment, green arrowheads to actin clouds (a,b) and Arp2–mNG enrichment (c), green arrows to actin bundles (a) and hollow arrowheads to highly enriched mScar–Dyn2 (b, 4 and 5 min); n = 3 independent experiments were performed with similar results. a,b, Actin clouds are outlined by dotted lines in the merge channel and a schematic is shown (bottom). d, Time-lapse still images showing cortical protrusions of LifeAct–mNG-expressing C2C12 cells that were either untreated (top) or treated with 5 μM MiTMAB (bottom) at 48 h post MyoD overexpression (Supplementary Video 17). The arrows point to finger-like protrusions and arrowheads to persistent actin clouds along the protrusions; n = 3 independent experiments were performed with similar results. Maximum z-projection of 8–10 focal planes from the ventral plasma membrane (z-step size, 500 nm). e, Time-lapse still images showing Dyn2 enrichment in the persistent actin clouds of MiTMAB-treated C2C12 cells coexpressing LifeAct–mNG and mScar–Dyn2 48 h post MyoD overexpression (Supplementary Video 18). The green arrowheads point to persistent actin clouds and red arrowheads to mScar–Dyn2; n = 3 independent experiments were performed with similar results. f, Epifluorescence images of MHC and DAPI staining of Ctrl and dynamin-tKO (DyntKO) MEFs expressing wild-type Shi or Shi4RD five days post MyoD overexpression. g, Calculated fusion index from f; n = 4,901, 4,162, 4,764 and 4,860 nuclei for the indicated genotypes (from left to right) were analysed in n = 3 independent experiments. h, Immunostaining of the MEFs described in f with anti-VASP and phalloidin. The red arrowheads point to VASP protrusions and white arrows to VASPtip filopodia. i, Percentage of VASP protrusions shown in h; n = 531, 573, 560 and 608 (from left to right) randomly selected protrusions in n = 60 cells per genotype from n = 3 independent experiments were analysed. ac,e,h, Single-plane confocal images. j,h, Data are the mean ± s.d. Statistical significance was determined using a two-tailed Student’s t-test. af,h, Scale bars, 3 μm (ac), 2 μm (d,e), 5 μm (h) and 200 μm (f).
Fig. 7 |
Fig. 7 |. Dynamin and WIP2 bundle branched actin filaments in a sequential manner.
a, Immunofluorescence labelling of Dyn2 in detergent-extracted MyoDOE cells. (i),(ii), Two examples of actin clouds, each with two consecutive focal planes (z1 and z2; 500 nm apart). Note that Dyn2 was localized in three patterns: pattern 1, scattered punctae in areas of low actin density (white arrowheads in z1 of (i)); pattern 2, partially aligned Dyn2 punctae in low-density area (hollow arrowheads in z1 of (ii)) and pattern 3, well-aligned Dyn2 punctae along actin bundles (arrows in z2 of (i) and (ii)). In mature bundles with high F-actin content, only a few Dyn2 punctae were aligned with the bundle (red arrowheads in z2 of (ii)). bf, Dyn2 localization at the ultrastructure level revealed by immunogold labelling and PREM of detergent-extracted cells. Dyn2 was localized in three patterns within the actin clouds: pattern 1, scattered clusters on branched actin filaments (white arrowheads in b(i), c(i) and d(ii)); pattern 2, partially aligned clusters on loosely organized actin filaments (hollow arrowheads in c(ii) and e(i)); and pattern 3, clusters well-aligned along nascent actin bundles (arrows in c(iii) and d(i)–(iii)). In addition, PREM revealed pattern 4: clusters encompassing multiple bundles (green arrowheads in d(iii). In mature bundles with high F-actin content, a few small Dyn2 clusters were observed along thick bundles (f(i)). The boundaries of actin bundles and clouds are delineated by red and yellow dotted lines, respectively; n ≥ 15 samples at each stage of protrusion formation were analysed with similar results. Magnified views of the regions of interest delineated by white boxes are provided. g, Time-lapse still images showing protrusion formation in MyoDOE cells coexpressing mScar–Dyn2 and mNG–WIP2 (Supplementary Video 19). Hollow arrowheads point to mScar–Dyn2 enrichment and white arrowheads to mNG–WIP2 enrichment. h, Relative intensity of mScar–Dyn2 and mNG–WIP2 at different stages of protrusion formation. For each protein, the mean intensity in the entire protrusion was normalized to that at the cloud expansion stage. Data are the mean ± s.d.; n = 5 randomly selected protrusions from five cells were analysed. i, Electron micrographs of negatively stained, partially dissembled Shi-actin bundles by GTP hydrolysis without (left) or with (right) mNG–WIP-N addition. The arrowheads point to randomly selected Shi helical rungs, the green dashed lines indicate regions of bundled actin by Shi helices, the yellow bracket encompasses a stretch of loosened actin bundle without Shi, the red dashed lines delineate a tightened actin bundle by mNG–WIP2-N and the arrows point to mNG–WIP2-N patches on the bundle. a,g, Single-plane confocal images; n = 3 independent experiments were performed with similar results. ag,i, Scale bars, 3 μm (a), 120 nm (c(i),(ii)), 1 μm (d), 200 nm (b(i),d(i)–(iii),f(i),i), 100 nm (c(iii)), 500 nm (b,c,e,f), 250 nm (e(i)) and 5 μm (g).
Fig. 8 |
Fig. 8 |. Arp2/3 complex-mediated branched actin polymerization promotes invasive protrusion formation and fusion of mouse myoblasts in vivo.
a, Gross morphology of control (Pax3Cre or MyoDiCre), N-WASPPax3-KO (Pax3Cre; N-WASPfl/fl), CYFIP1Pax3-KO (Pax3Cre; CYFIP1fl/fl), Pax3-dKO (Pax3Cre; N-WASPfl/fl; CYFIP1fl/fl) and ArpC2MyoD-KO (MyoDiCre; ArpC2fl/fl) embryos on E12.5, E15.5 and E17.5. b, Single-plane confocal images of forelimb cross sections of control and mutant E17.5 embryos in a immunostained with anti-MHC. c, Cross-sectional area (CSA) of the forelimb skeletal muscle of the control and mutant embryos in b. d, Number of myofibres in the extensor carpi redialis (ECR) muscle of the control and mutant embryos in c. e, MHC and DAPI staining of longitudinal sections of the forelimbs of the control and mutant embryos in b. The arrowheads point to randomly selected mononucleated MHC+ myoblasts. Maximum z-projection of three focal planes (z-step size, 1 μm). f, Number of mononucleated MHC+ myoblasts in e. Mononucleated MHC+ myoblasts in 12 microscopy (×40) fields were counted for each embryo. A total of n = 262, 413, 477, 4,379, 263 and 1,040 (from left to right) mononucleated MHC+ myoblasts were identified. c,d,f, Three embryos were examined for each genotype. g, TEM analysis of the forelimb muscle of control and ArpC2MyoD-KO embryos on E15.5. The mononucleated myoblast is pseudo-coloured in magenta. Nine of 30 (30%) muscle cells in the control and two of 57 (3.5%) in the ArpC2MyoD-KO embryos exhibited invasive protrusions. The arrows point to invasive protrusions; n = 3 mice were examined for each genotype. h, Model describing the mechanisms underlying invasive protrusion formation propelled by branched actin polymerization at the mammalian fusogenic synapse. Five distinct stages ((i)–(v)) are illustrated (top), with magnified views of the boxed areas in each step (bottom). (i), WAVE2 and N-WASP activate the Arp2/3 complex to generate a small lamellipodium-like structure (actin cloud) composed of branched actin filaments. WAVE2 is enriched at the leading edge, whereas N-WASP–WIP2 are broadly distributed in the cloud. Dynamin is in scattered clusters (pattern 1) on the branched actin filaments. (ii) The branched actin network has begun to be organized into loosely aligned filaments or nascent bundles, corresponding to partially aligned (pattern 2) or well-aligned (pattern 3) dynamin clusters along the actin filaments, respectively. (iii) More nascent bundles have formed in the proximal region of the protrusive structure, some of which are laterally crosslinked to form a wider base. Dynamin clusters are seen encompassing the actin bundles, probably in the process of forming multi-helical super bundles (pattern 4). (iv) Small actin clouds continue to form in the distal region of the main bundle, with multiple dynamin clusters partially aligned next to it (pattern 2), contributing to bundle growth. At this point, WIP has become highly enriched in the main bundle, positioning N-WASP at the plasma membrane along the bundle. (v) The mature protrusion contains densely packed actin filaments with only a few small dynamin clusters but more WIP, the latter of which tightens and stabilizes the thick bundle. c,d,f, Data are the mean ± s.d. Statistical significance was determined using a two-tailed Student’s t-test. a,b,e,g, Scale bars, 5 mm (a), 0.5 mm (b), 100 μm (e) and 1 μm (g).

References

    1. Muller WA Mechanisms of leukocyte transendothelial migration. Annu. Rev. Pathol 6, 323–344 (2011). - PMC - PubMed
    1. Paz H, Pathak N & Yang J Invading one step at a time: the role of invadopodia in tumor metastasis. Oncogene 33, 4193–4202 (2014). - PMC - PubMed
    1. Kelley LC et al. Adaptive F-actin polymerization and localized ATP production drive basement membrane invasion in the absence of MMPs. Dev. Cell 48, 313–328 (2019). - PMC - PubMed
    1. Kim JH & Chen EH The fusogenic synapse at a glance. J. Cell Sci 132, jcs213124 (2019). - PMC - PubMed
    1. Tamzalit F et al. Interfacial actin protrusions mechanically enhance killing by cytotoxic T cells. Sci. Immunol 4, eaav5445 (2019). - PMC - PubMed

MeSH terms

Substances

LinkOut - more resources