. 2025 Sep;43(9):1525-1538.
doi: 10.1038/s41587-024-02442-6. Epub 2024 Nov 1.

Development of compact transcriptional effectors using high-throughput measurements in diverse contexts

Affiliations

Development of compact transcriptional effectors using high-throughput measurements in diverse contexts

Josh Tycko et al. Nat Biotechnol. 2025 Sep.

Abstract

Transcriptional effectors are protein domains known to activate or repress gene expression; however, a systematic understanding of which effector domains regulate transcription across genomic, cell type and DNA-binding domain (DBD) contexts is lacking. Here we develop dCas9-mediated high-throughput recruitment (HT-recruit), a pooled screening method for quantifying effector function at endogenous target genes and test effector function for a library containing 5,092 nuclear protein Pfam domains across varied contexts. We also map context dependencies of effectors drawn from unannotated protein regions using a larger library tiling chromatin regulators and transcription factors. We find that many effectors depend on target and DBD contexts, such as HLH domains that can act as either activators or repressors. To enable efficient perturbations, we select context-robust domains, including ZNF705 KRAB, that improve CRISPRi tools to silence promoters and enhancers. We engineer a compact human activator called NFZ, by combining NCOA3, FOXO3 and ZNF473 domains, which enables efficient CRISPRa with better viral delivery and inducible control of chimeric antigen receptor T cells.


Conflict of interest statement

Competing interests: J.T., L.B. and M.C.B. are inventors on provisional patents related to this work and acknowledge outside interest in Stylus Medicine. L.S.Q. is a founder and scientific advisory board member of Epicrispr Biotechnologies and Refuge Biotechnologies. X.X. and L.S.Q. are inventors on provisional patents related to dCasMINI. A.S.K. is an inventor on patents related to synZiFTR, is a scientific advisor for and holds equity in Senti Biosciences and Chroma Medicine and is a cofounder of K2 Biotechnologies. All other authors declare no competing interests.

Figures
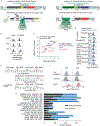
Extended Data Fig. 1 ∣
Extended Data Fig. 1 ∣. HT-recruit to varied reporters and endogenous gene targets in K562 and HEK293T cells.
a, Schematics of recruitment constructs. These can be used to recruit effectors to either reporter constructs that are integrated into the AAVS1 safe harbor, or to endogenous genes. Safe sgRNAs target the genome at a safe location, and the TetO sgRNA targets the synthetic reporter at an overlapping location as rTetR (the TetO motif upstream of the promoter). b, Observation of background silencing at reporters (n = 1 replicate per promoter type). Reporters were stably integrated at the AAVS1 safe harbor locus in both cell types by TALEN-mediated homology-directed repair. c, Mean fluorescent intensity (MFI) of the citrine reporter under different promoters. Each dot represents a mean from 3 replicates, and error bars show SD. Promoters with red text represent reporters that are OFF in both cell types. d, Silencing was measured by CD43 surface marker immunostaining and flow cytometry 7 days after lentiviral sgRNA infection in stable cell lines. Data are gated for sgRNA (mCherry+, only in samples with a sgRNA) and dCas9 (BFP+) delivery (n = 1 infection replicate). e, dCas9-activators targeting surface marker genes in K562 cells. sgRNAs were stably installed by lentiviral delivery and puromycin selection. Then 500 ng of dCas9 plasmids were electroporated into 1e6 cells. Two days later, cells were stained for surface CD2 (APC), CD20 (APC) or CD28 (PE) expression and analyzed by flow cytometry after gating for dCas9 (BFP) and the stably expressed sgRNA (GFP; n = 1 electroporation replicate). f, Magnetic separation using anti-CD43 antibody and protein G Dynabeads performed 9 days after lentiviral delivery of dCas9-Pfam library in K562 cells expressing sgRNAs that target CD43. Separation is measured by flow cytometry with gates for dCas9 (BFP+) and sgRNA (mCherry+). g, Overlap in hit Pfam domains in both biological replicates for HT-recruit screens, defined as elements that had ≥5 sequencing reads in bound and unbound and log2(OFF:ON) scores 2 standard deviations beyond (that is, higher for repressors, lower for activators) the median of the poorly expressed controls.
Extended Data Fig. 2 ∣
Extended Data Fig. 2 ∣. dCas9 fusions to tiles of all human chromatin regulators and transcription factors uncovers unannotated effectors.
a, Schematic of a library tiling all human chromatin regulator and transcription factor (CR and TF) proteins in 80 amino acid tiles with a 10 amino acid step size (n = 128,565 elements). This library was fused to dCas9 and used to target CD43 with sg15 and CD2 with sg717. b, Replicates of CR and TF library fused to dCas9 and recruited to CD43 or CD2 in K562 cells. Hit threshold shown at 2 standard deviations above (for CD43 screen) or below (CD2) the median of the random controls. Elements with >20 sequencing counts in both the bound (ON) and unbound (OFF) samples are included. The linear regression goodness of fits (R2) is shown for all elements and for the subset that are hits in both replicates.
Extended Data Fig. 3 ∣
Extended Data Fig. 3 ∣. Pooled measurement of domain expression level across cell types and DBDs.
a, Schematic of pooled approach to measuring domain expression. Cells are permeabilized and then stained with a fluorescent anti-FLAG antibody. Then, cells are sorted into high and low FLAG level bins using gates that account for transcription variability by using the fluorescent delivery marker (mCherry for rTetR constructs, and BFP for dCas9 constructs), which is found on the same transcript after the T2A cleavage signal. Genomic DNA is extracted, and then the domains are sequenced in those two cell populations. b, Gating strategy for sorting based on FLAG stain intensity in HEK293T cells. Example gate shown in red accounts for variation across cells in transcription level of the rTetR-3XFLAG-effector-T2A-mCherry transcript by using mCherry fluorescence. c, Comparison of Pfam domain library expression levels between HEK293T and K562 cells (Spearman ρ = 0.84). In both cell types, the DBD was rTetR(SE-G72P) and the cell line was the minCMV reporter (n = 2 replicates). Data were filtered for elements with >5 reads in both FLAG high and low samples. Well-expressed domains were identified based on a hit threshold (dashed lines) set 1 S.D. above the median of the random controls. The number of library elements in each quadrant is labeled in the corners. d, Comparison of Pfam domain library expression levels when fused to dCas9 and delivered to cell lines expressing either a safe control sgRNA or a sgRNA targeting CD43 (n = 1 replicate). e, Comparison of Pfam domain library expression levels when fused to dCas9 or rTetR(SE-G72P) and delivered to K562 cells (n = 2 replicates). For dCas9, one replicate each from the Safe sgN4293 and CD43 sg15 cells are averaged.
Extended Data Fig. 4 ∣
Extended Data Fig. 4 ∣. Activators function more similarly at minimal promoters than with a different DBD or at a silenced promoter.
a, HT-recruit with rTetR in K562 cells (n = 2 biological replicates). Dashed lines show hit thresholds at 2 standard deviations above the median of the poorly expressed domains. b, Validation of activator domains across core promoter reporters in K562 cells. rTetR-activator fusions or the rTetR-only negative control were delivered by lentivirus to reporter cells. After selection, cells were treated with 1000 ng/ml doxycycline for 2 days to induce reporter activation. The percent of cells activated was measured by flow cytometry for the citrine reporter, after gating for delivery with mCherry. Percentages normalized to no-doxycycline control and shown as an average from 3 biological replicates. c, HT-recruit with rTetR in HEK293T cells (n = 2 biological replicates per promoter). rTetR-domain fusions were recruited to the reporter with 1000 ng/ml doxycycline for 2 days. The number of Pfam domains in each quadrant is labeled. d, Individual validations of activators in HEK293T as measured by average percentage of cells ON normalized to no-doxycycline control. rTetR-activators were stably delivered by lentivirus. Cells were treated with 1000 ng/ml doxycycline for 2 days to induce reporter activation (n = 2 independently transduced replicates for each promoter type). e, HT-recruit with dCas9 recruitment of activators with a sgRNA that binds the TetO site upstream of the minCMV reporter in K562 cells (n = 2 biological replicates). f, dCas9 activators recruited with a sgRNA that binds the TetO site (n = 2 infection replicates shown as dots). dCas9 fusions were delivered by lentivirus, selected with blasticidin starting on day 5 and cells were analyzed on day 9. Flow cytometry measurements were gated for dCas9 and TetO_sg1 using BFP and mCherry, respectively. g, Other dCas9 activators were recruited in K562 cells with the TetO sgRNA (n = 1 replicate). dCas9 fusions were delivered by lentivirus, selected with blasticidin starting on day 3 and cells were analyzed on day 9 as in f. h, HT-recruit with the dCas9-Pfam domain library targeted to the CD2 gene TSS using two different guides (n = 2 replicates for sg717, and n = 1 for sg718) in K562 cells. Screen measurement was taken 10 days after library delivery. Schematic shows locations of the CD2-targeting guides. i, Recruitment of dCas9-activator hits at the CD2 gene using two different guides in K562 cells. sgRNA were stably delivered by lentivirus and selected for with puromycin, then dCas9 fusion plasmids were delivered by electroporation, then cells were analyzed 3 days later by flow cytometry for surface stained CD2 after gating for dCas9 (BFP) and sgRNA (GFP). The percentage of cells ON is shown (n = 1 electroporation replicate). The 80 amino acid sequences match the library elements, while the trimmed sequences match the annotated Pfam domain. The polyQ is a homopolymer of 15 repeated glutamines, which is also found at the C-terminus of the 80 amino acids QLQ and is not present in the trimmed QLQ. bZIP_2 domain from CEBPE was filtered due to low counts in the screen. j, dCas9-HLHs were delivered to K562 cells by lentivirus and selected for with blasticidin, and then sgRNAs were delivered by lentivirus and selected with puromycin. Then 8 days after sgRNA delivery, the cells were stained for the targeted surface markers and measured by flow cytometry (n = 1 infection replicate). Data were gated for dCas9 with BFP and sgRNA with GFP. k, Nine days after lentiviral delivery of dCas9 fusions, K562 cells were immunostained with CD2 antibody to measure gene activation by flow cytometry (n = 1 replicate). l, HT-recruit scores for activators that were hit in ≥5 samples across target, cell type and DBD contexts (n = 2 replicates per rTetR and sg717 screens, and n = 1 for other dCas9 screens shown as columns). The rows are clustered in an unbiased manner. mC = minCMV and P = PGK. m, Comparison of HLH domain HT-recruit scores from the dCas9 screen at CD2 with sg717 with published data, wherein the ORFeome was fused to dCas9 and recruited to activate a reporter gene. Dashed lines show hit thresholds. The number of elements in each quadrant is labeled (not all corresponding HLH full-length genes were included in the ORFeome study). P-value from 2-sided Fisher’s exact test is shown. The HLH phylogenetic groups are shown as colors-.
Extended Data Fig. 5 ∣
Extended Data Fig. 5 ∣. dCas9 fusions to tiles of all human chromatin regulators and transcription factors uncovers unannotated and HLH activators.
a, dCas9 recruitment of CR and TF tiles to CD2 compared with rTetR recruitment to minCMV. Dashed lines show average of hit thresholds (n = 2 replicates per screen). b, Proteins with activator hit tiles. Each horizontal line is a tile, and vertical bars show the range (n = 2 screen replicates). Dashed horizontal line is the hit-calling threshold based on random controls. Hit domains, defined as the sequence from the start of the first hit tile to the end of the last hit tile for a stretch of 1 or more consecutive hit tiles (that are below the hit threshold in both replicates), are shaded. UniProt annotations and Pfam domains are shown below. c, Overlap of hit activator domains from different contexts. Shared hits are defined as hit domains with any overlapping sequence. Proteins containing the top 6 strongest hit domains are listed, and for the shared hit category, the proteins with the top 6 strongest CD2 activators are listed. d, Percentage of hit domains overlapping annotations. NR box motif is associated with recruitment of nuclear receptor coactivators. Some domains are hits in both contexts or overlap multiple annotations.
Extended Data Fig. 6 ∣
Extended Data Fig. 6 ∣. dCas9 recruitment of tiling library to CD43 uncovers unannotated repressors.
a, Comparison of dCas9 recruitment of the CRTF tiling library to CD43 with rTetR recruitment to pEF1α. Dashed lines show hit threshold (n = 2 replicates per screen) based on random 80 amino acids controls. b, Tiling methyl-binding domain protein MBD3 and CDCA7L. Each horizontal line is a tile, and vertical bars show the range (n = 2 screen replicates). Dashed horizontal line is the hit-calling threshold based on random controls. c, Overlap of hit repressor domains from different contexts. Proteins containing the top 6 strongest hit domains are listed, and for the shared hit category, the proteins with the top 6 strongest CD43 repressors are listed. d, Percentage of hit domains overlapping a curated set of annotations of interest. SLIM are short linear interaction motifs. HP1, WRPW and CtBP motifs are associated with co-repressor recruitment. SIM are SUMO-interacting motifs, and SUMO are SUMOylation sites. ‘Any annotation’ refers to any of these. To conservatively select hit domains from the rTetR screens, here we used domains that are hit with both pEF and PGK. Some domains are hits in both rTetR and dCas9 contexts or overlap multiple annotations.
Extended Data Fig. 7 ∣
Extended Data Fig. 7 ∣. Dual-functioning HLH domains.
a, rTetR fusions were delivered by lentivirus to K562 cells with the pEF1α reporter. Cells were selected with blasticidin, and then cells were treated with doxycycline for 6 days, then doxycycline was washed out to measure silencing memory. The percentage of cells silenced was measured by flow cytometry for the citrine reporter after gating for delivery with mCherry and normalizing to the matched no-doxycycline control (n = 2 infection replicates shown as dots). b, Classification of HLH effector hits from the Pfam library screens at pEF with rTetR and CD2 with dCas9 in K562 cells. Hits are shown as colors and compared with phylogenetic grouping defined in refs. - and reported as used here in ref. . For this analysis, an HLH domain is counted as repressing pEF if the average log2(OFF:ON) across biological replicates is above the lower threshold (>0.9, equivalent to the weakest individually validated repressor; Methods). U, unclassified. c, dCas9 recruitment of the CRTF tiling library to CD2 and CD43. Dashed lines show hit thresholds at 2 standard deviations below or above the median of the random controls (n = 2 replicates per screen). d, Comparison of dCas9 recruitment of the CRTF tiling library to CD2 with rTetR recruitment to pEF (n = 2 replicates per screen). Labels are orange for HLH proteins. e, Tiling HLH proteins and targeting CD2. Each horizontal line is a tile, and vertical bars show the range (n = 2 screen replicates). Dashed horizontal line is the hit-calling threshold. UniProt annotations and Pfam domains are shown below. The bHLH domains contain a short N-terminal basic DNA-binding region followed by an HLH heterodimerization region. f, Integrated analysis of NGN2 experiments. From the top, (i) shows deletion scan data for an 80 amino acids repressor tile in NGN2 that contains the HLH domain. Each short horizontal bar depicts a 10 amino acid deletion from the 80 amino acids tile, which was recruited to the pEF reporter. The light blue shaded region shows the reference score for the full 80 amino acids tile. Bars below the dashed line are deletions that ablate repressor function. Dots show the middle of the deletion, and vertical error bars show the range of two biological replicates. Below, individual recruitment experiments (ii–iv) with NGN2 are depicted, with colored sequences showing what was recruited and the summarized results written on the right. (ii) The blue sequence is the same tile that was deletion scanned in (i). (iii) The trimmed Pfam-annotated HLH domain is shown in gray, and (iv) the extended 80 amino acids HLH domain from the Pfam library is shown in red. These recruitment assay data are shown in d, Fig. 2g and Extended Data Fig. 4i. g, AlphaFold structural prediction of the NGN2 region, accessed via UniProt ID Q9H2A3 (refs. 118-120). Residues that delimit the tested domains are labeled. The HLH region shown to be necessary by deletion scanning (N126 to G175) is bracketed. The boundary between the basic region and helix 1 is not structurally distinguishable and is determined here based on the presence of basic residues. Colors correspond with f.
Extended Data Fig. 8 ∣
Extended Data Fig. 8 ∣. KRAB mutant and paralogs with improved CRISPRi efficiency.
a, dCas9 constructs were delivered by lentivirus to K562 cells, and then sgRNAs were delivered by lentivirus. Three days later, the cells were selected with puromycin and blasticidin. Then, 9 days after sgRNA infection, the cells were stained for CD81 expression, fixed and analyzed by flow cytometry with gating for both dCas9 (BFP) and sgRNA (mCherry; n = 1 infection replicate). b, Shaded histogram shows the cells expressing both the dCas9 vector (BFP) and the sgRNA (mCherry); their percentage of cells OFF is shown. The unshaded histogram shows the cells from the same sample that express neither (n = 1 replicate). c, HT-recruit scores for selected KRAB domains compared across cell type, DBD and target gene contexts that measured repression directly or by using a growth phenotype associated with repressing GATA1. Each dot shows the average of two screen biological replicates (n = 12 contexts). Black line shows identity, and blue line shows linear regression with shaded 95% confidence interval estimated using a bootstrap. d, Schematic of a CRISPRi benchmarking screen for comparing KRAB repressors (Methods). e, CRISPRi benchmarking screen. Greater depletion over 14 days of growth relative to the original plasmid pool representation is associated with stronger effector-mediated silencing of the essential gene promoters. Violin shows distribution of average sgRNA-level depletion from two screen replicates; solid line shows median; dotted lines are quartiles (N = 405 sgRNAs, ****P < 0.0001 by Kruskal–Wallis test). The dashed line at 0 represents the median of the safe-targeting negative controls. f, Comparison KRABs from CRISPRi benchmarking screen targeting the promoters of 37 essential genes. Effect sizes are the log2(fold-change) of sgRNA representation after 14 days of growth relative to the original plasmid pool representation. The median effect across 8–10 sgRNAs per gene was computed, and each dot shows its average for two infection replicate screens. Horizontal and vertical error bars show the ranges. Dashed line shows parity between KRAB domains. g, sgRNA distance from the primary TSS of 37 essential genes as defined by FANTOM, (n = 405 sgRNAs shown as dots, average of 2 screen replicates). h, Top, schematic of dCas9-repressor recruitment at the pEF1α-TagRFP-T reporter in HEK293T using TetO-targeting sgRNA. Bottom, transient transfection of dCas9–KRAB paralogs with a sgRNA targeting the TetO sites upstream of the reporter gene (bar shows mean from n = 2 biological replicates shown as dots). Percentage of cells OFF was normalized to safe-targeting sgRNA. i, After targeting the dCas9–KRAB paralog fusions for 5 days by transient transfection at the TagRFP reporter in HEK293T cells, silenced cells were sorted, and memory dynamics was measured by flow cytometry throughout 35 days. Each dot is a biological replicate (n = 2). The percentage of cells OFF was normalized to safe-targeting sgRNA. j, sgRNAs and then dCas9 fusions were delivered by lentivirus to THP-1 monocytes. Eight days later, cells were stained for surface CD43 expression and analyzed by flow cytometry, with gates applied for sgRNA expression (mCherry) and dCas9 expression (BFP; n = 1 infection replicate). KRAB data are shared with Fig. 3e. k, iPSCs were transfected with dCas9–KRAB and sgRNA plasmids and then stained and measured by flow cytometry 2 days later. Data were gated for sgRNA delivery (GFP for safe and sgA, or mCherry for sg3) and dCas9 (BFP; n = 3 transfection replicates shown as shaded histograms). The gray unshaded histogram shows the cells from the same sample that express neither and serve as an internal control. The percentage of cells OFF with the gene-targeting sgRNA, using the threshold shown by the black vertical line, is shown. l, iPSC were similarly transfected, then permeabilized and stained for intracellular Nanog protein expression and measured by flow cytometry 2 days later. Data were gated for sgRNA delivery (GFP) and dCas9 (BFP; n = 3 transfection replicates shown as dots, and bar shows mean). m, Comparison of baseline silencing with ZNF10 KRAB and relative improvement with ZNF705 KRAB when dCas12a fusions were recruited to silence CD43 or CD32, with the same method as in Fig. 3f. Dots show the average for two infection replicates of a guide RNA. Horizontal and vertical error bars show the ranges. Dashed line shows parity between KRAB domains. n, Chromatin regulator and transcription factor tiles and random controls are ranked by their mean repression scores from the pEF, PGK and CD43 screens with the larger library (n = 2 replicates per screen). The ZNF705E tile is 99% identical to the ZNF705B/ZNF705D/ZNF705F KRAB Pfam domain, which was not itself included in the tiling library because most of the >300 KRAB-containing ZNF proteins were excluded from the library design due to space constraints. The top 20 ranked tiles are listed, with their protein name, tile start and end position, colored by whether they overlap a KRAB or RYBP domain. o, Tiling ZNF705E. Each horizontal line is a tile, and vertical bars show the range (n = 2 screen replicates). Dashed horizontal line is the hit-calling threshold based on random controls. UniProt annotations are shown below, associated with the UniProt accession ID written above. p, RNA-seq of K562 cells after stable lentiviral delivery of dCas9–KRABs and blasticidin selection compared to cells expressing dCas9-only (n = 3 technical replicates). No sgRNA was included. Red dots show transcripts with fold-change (FC) >4 in either direction. The total number of transcripts (after filtering for at least 10 counts) is labeled.
Extended Data Fig. 9 ∣
Extended Data Fig. 9 ∣. Characterization of transcriptional control tools using compact human activators.
a, dCas9-activator delivery to K562 cells by lentiviral infection. Flow cytometry measuring BFP delivery marker was performed 3 days after infection (n = 8 infection replicates). *P < 0.0001 by unpaired 2-sided t test for comparison of NFZ and VPR. b, 5× LentiX-concentrated lentivirus was used and cells were analyzed by flow cytometry at 3 time points. Blasticidin selection was initiated on day 5. Each dot is an independent infection (n = 8 replicates per dCas9 construct). c, Lentiviral delivery to MCF10a breast cancer cells with 10× LentiX concentration, measured by flow cytometry after 4 days (n = 1 replicate). d, dCas9 activators recruited to CD28 in K562 cells (n = 1 infection replicate). The mean fluorescence intensity (MFI) is labeled. Vertical black line shows the threshold chosen to quantify the percentage of cells ON in Fig. 4f. e, Lentiviral delivery to J774 mouse macrophages with or without 4× LentiX concentration. 1e5 cells were infected with 1 mL of virus for 24 hours. Flow cytometry was performed 6 days after infection (n = 1 replicate). BFP is a positive control lentivirus (pEF-PuroR-P2A-BFP). f, Activation of endogenous Cd2 in J774 macrophages after lentiviral sgRNA delivery (n = 1 infection replicate). Data are gated for sgRNA delivery (GFP+) and for fair comparison, not gated for dCas9 delivery. Non-targeting (NT) sgRNAs are negative controls. g, Optimization of the tripartite activator by changing the N, F and Z domains’ orientation. The various configurations were fused onto dCas9 and targeted to the CD2 gene in K562 cells. sgRNAs and then dCas9 fusions were delivered by unconcentrated lentivirus and selected with puromycin and blasticidin, respectively. Activation was measured 8 days after dCas9 infections by immunostaining CD2 with an APC-conjugated antibody followed by flow cytometry. The average percentage of cells ON is shown. The darker-shaded histogram is CD2 sg717, and the lighter shade is sg718 (n = 1 infection per sgRNA). dCas9-only and VP64 control data are shared with Fig. 1c. h, dCas9 activators targeting CD2, CD20 and CD28 surface marker genes in K562 cells. sgRNAs (CD2: sg39, sg42, sg46, sg89; CD20: sg135, sg148, sg275; CD28: sg7, sg56, sg94) were stably installed by lentiviral delivery and puromycin selection. Then 500 ng of dCas9 plasmids were electroporated into 1e6 cells. Two days later, cells were stained for surface CD2 (APC), CD20 (APC) or CD28 (PE) expression and analyzed by flow cytometry after gating for dCas9 (BFP) and the stably expressed sgRNA (GFP). Each dot represents a different sgRNA targeting the gene (n = 3 for CD20 and CD28; n = 4 for CD2), and error bars show SD. Control data are shared with Extended Data Fig. 1e. i, Percentage of CD2 endogenous gene activated 3 days after transient transfection of dCas9 activators and a sgRNA in HEK293T cells. Cells were immunostained for CD2 (APC) expression and analyzed by flow cytometry after gating for transfection (GFP on the sgRNA plasmid). Each dot represents an independently transfected biological replicate (n = 2). j, dCas9-activator delivery 2 days after plasmid transfection in HEK293T cells measured by flow cytometry for the BFP marker on the dCas9-effector-T2A-BFP-P2A-BlastR transcript, with no gating on co-transfected delivery markers. dCas9–NFZ is significantly better delivered than dCas9-VPR with a greater fraction of BFP+ cells using a linear gate at 1.5 × 10⁷ (P = 0.0281, two-tailed t-test). Each dot is an individual co-transfection of 500 ng of dCas9 plasmid and 300 ng of a sgRNA plasmid in a 24-well plate (n = 11 transfection replicates for NFZ and VPR) or an untransfected negative control. Bar shows mean, and error bars show standard deviation. k, BFP expression level in the same samples after accounting for overall delivery efficiencies by gating for transfectable cells based on the presence of GFP (from the co-transfected sgRNA plasmid). Each line is an individual co-transfection or the untransfected control, and the black line shows the linear gate for BFP+ cells (n = 10 for VPR and 11 for NFZ). l, Fusion of SMARCA2 QLQ (Q) to dCas9-NZF. Nine days after lentiviral delivery of dCas9 activators, K562 cells were immunostained with CD2 antibody to measure gene activation by flow cytometry, and the average percentage of cells ON is shown. The darker-shaded histogram is CD2 sg717, and the lighter shade is sg718 (n = 1 replicate per sgRNA). m, dCas9 recruitment of activators with a sgRNA that binds the TetO site upstream the minCMV reporter in K562 cells (n = 2 infection replicates). dCas9 fusions were delivered by lentivirus and cells were analyzed 2, 5 and 9 days later with blasticidin selection starting at day 5. Flow cytometry measurements were gated for dCas9 and TetO_sg1 using BFP and mCherry, respectively (VPR measurements not shown due to having <100 BFP+ cells). Control data are shared with Extended Data Fig. 4g. Bars show mean, and error bars show standard deviation. n, dCas9 activators were delivered to K562 cells by lentivirus and selected for with blasticidin, and then sgRNAs were delivered by lentivirus and selected for with puromycin. Then 8 days after sgRNA delivery, the cells were stained for the targeted surface marker genes and measured by flow cytometry. Surface marker expression is shown after gating for dCas9 with BFP and sgRNA with GFP, and dCas9-only data are shared with Extended Data Fig. 4j, which was performed in parallel. o, Homotypic combination of Q, N, Z and F activators fused onto dCas9 and delivered stably by lentivirus to target CD2 in K562 cell lines stably expressing the sgRNA. The mean fluorescence intensity (MFI) of CD2 staining (Alexa 647) of the cell population after gating for delivery of the sgRNA (GFP) and dCas9 fusion (BFP) is shown. Staining was performed 9 days after dCas9 fusion infection. Each point is a sgRNA (sg717 or sg718), and bars show the mean of two different sgRNAs (n = 2 infection replicated).
Extended Data Fig. 10 ∣
Extended Data Fig. 10 ∣. Inducible chimeric antigen receptor (CAR) expression with compact human activator domains in primary T cells.
a, Schematic of the synZiFTR genetic circuit for inducible CAR expression. Lenti 1 constitutively expresses a synthetic transcription factor with a zinc finger 10 (ZF10) DBD fused to an NS3 protease domain and an activator domain. Upon protease inhibition by GZV treatment, the activator is inducibly stabilized and recruited to the second lentivirus, which contains 8× ZF10-binding motifs upstream of a minimal pybTATA to drive expression of an anti-CD19 chimeric antigen receptor (CAR) fused to mCherry. b, Schematic of activator domains recruited with synZiFTR. c, Distribution of CAR-mCherry expression levels in primary T cells. Cells were co-infected with synZiFTR-expressing and CAR-mCherry lentiviruses (or reporter-alone controls), and then expression was induced with 1 μM GZV for 72 hours. Cells were analyzed by flow cytometry with no gating applied for delivery of synZiFTR (n = 1 representative replicate shown). d, Lentiviruses expressing synZiFTRs with p65 or NFZ activator domains were normalized for titer and then delivered to primary human T cells. Simultaneously, cells were co-infected with a ZF10-targeting CAR-mCherry lentivirus, or with a constitutive CAR as a control. After 3 days of infection and 3 days of puromycin selection, cells were treated with GZV or DMSO for 72 hours. Then mCherry induction was measured by flow cytometry (n = 2 infection replicates with 2 technical replicates each shown as dots, bars show mean and error bars show standard deviation). ‘No synZF’ control virus only contains the CAR-mCherry transgene, and UTD is untransduced. Data are gated for mCherry+ cells. e, After 72 hours of induction with GZV, SynZiFTR T cells were co-cultured overnight for 18 hours with the NALM6 BFP-expressing cancer cell line while being continuously treated with GZV. Killing efficiency was estimated by measuring the reduction in BFP+ cells compared to a NALM6-only negative control by flow cytometry (n = 2 infection replicates measured with 3 technical replicates each shown as dots, bars show mean and error bars show standard deviation). ***P < 0.005, ****P < 0.00005, by unpaired 2-sided t-test. f, At the same time point, supernatant was collected from the cells and interferon-γ secretion was measured by ELISA (n = 3 technical replicates shown as dots, bars show mean and error bars show standard deviations). g, After 48 hours of induction with GZV, SynZiFTR T cells were co-cultured overnight for 18 hours with the NALM6 cells and then measured by flow cytometry (n = 2 infection replicates measured with 3 technical replicates each shown as dots, bars show mean and error bars show standard deviation). **P < 0.0005, ****P < 0.00005, by unpaired 2-sided t-test. UTD is untransduced. h, An independent batch of primary T cells was transduced with synZiFTR lentiviruses. Cells were induced with GZV for 48 hours and then measured by flow cytometry (n = 2 infection replicates measured with 3 technical replicates each shown as dots, and bar shows mean).
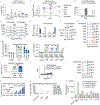
Fig. 1 ∣
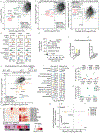
Fig. 1 ∣. HT-recruit quantifies transcriptional effector functions across DBD, cell type and target gene contexts.
a, Schematic representation of HT-recruit to quantify transcriptional effector function while varying the context of DBDs, cell type and target synthetic reporters or endogenous genes. A pooled library of Pfam domains from human nuclear proteins of ≤80 amino acids is synthesized as 300-mer DNA oligonucleotides, cloned downstream of the DBD (context 1) and delivered to cells (context 2) at a low MOI such that most cells express a single domain. The synthetic reporters encode a synthetic surface marker (Igκ-hIgG1-Fc-PDGFRβ) and fluorescent marker (citrine), while the endogenous target genes encode surface markers (context 3). After the recruitment of Pfam domains, ON and OFF cells were magnetically separated using beads that bind these synthetic or endogenous surface markers, and the domains were sequenced in the bound and unbound populations to compute enrichments. b, Expression of synthetic reporters. Positive control effectors, such as ZNF10 KRAB repressor or VP64 activator, were stably delivered by lentivirus. Cells were treated with 1,000 ng ml−1 doxycycline for 5 days for repression and 2 days for activation (or untreated as a negative control), and citrine expression was measured by flow cytometry after gating for rTetR delivery (mCherry+; n = 2 infection replicates shown as histogram curves). c, Expression of endogenous surface marker genes in K562 cells measured by immunostaining and flow cytometry. dCas9 fusions and sgRNAs were delivered by lentivirus and selected for by blasticidin and puromycin, respectively. Data are gated for sgRNA delivery (mCherry+ in CD43 and GFP+ in CD2 samples) and for dCas9 (BFP+; n = 1 infection replicate). d, Transcriptional effector hits’ activation and silencing activity across different target gene, DBD and cell-type recruitment contexts (n = 2 biological replicates per screen). A subset of effectors (columns) are shown that are a hit at a high threshold of 3 s.d. stronger than the median of the poorly expressed domains in ≥2 samples (rows; n = 143). Unbiased column clustering shows three major clusters of effectors (top). dCas9 targets pEF1α and minCMV with sgTetO-1, CD2 with sg717 and CD43 with sg10 (upper two rows) and sg15. Column labels on the bottom show the protein, Pfam domain and domain start position within the protein; select Pfam domain families are colored. Rows are manually ordered, with the targets that are predominantly repressible above the activatable targets. e, Distribution of the number of screen contexts in which a Pfam domain was a hit effector in two replicates. Domains that are shared hits in multiple contexts are colored green.
Fig. 2 ∣
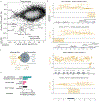
Fig. 2 ∣. Context-dependent transcriptional effectors.
a, HT-recruit with rTetR targeting two minimal promoters, minCMV and NTX, in K562 cells (n = 2 biological replicates). Dashed lines show hit thresholds at 2 s.d. above the median of the poorly expressed domains (same in c, d and f). b, Validation of activator domains across minimal promoter reporters in K562 cells. Individual rTetR-activator fusions or the rTetR-only negative control were delivered by lentivirus, and, after selection, cells were treated with 1,000 ng ml−1 doxycycline for 2 days to induce reporter activation. The percentage of cells activated was measured by flow cytometry for the citrine reporter, after gating for delivery with mCherry. Bars show the average percentage of cells ON normalized to no-doxycycline control; error bars are s.d. (n = 3 infection replicates shown as dots). c, HT-recruit with dCas9 targeting endogenous gene CD2 with sg717 compared with rTetR targeting the minCMV reporter in K562 cells (n = 2 biological replicates). d, HT-recruit with rTetR targeting the minCMV reporter in K562 and HEK293T cells (n = 2 biological replicates per cell type). e, Individual rTetR fusions were measured in minCMV reporter cells as in b (n = 2–3 infection replicates shown as dots). f, HT-recruit with dCas9 targeting endogenous gene CD43 with sg15 compared with rTetR targeting the pEF1α reporter in K562 cells (n = 2 biological replicates). g, HT-recruit with dCas9 to activate CD2 using sg717 compared with repression of pEF1α promoter with rTetR in K562 cells, showing only the HLH domains within the Pfam library (n = 2 replicates per screen). Black line shows the best linear fit. The conservative hit threshold (black dashed line) was chosen to identify strong effectors. The gray dashed vertical line is equivalent to the strength of the weakest repressor that was individually validated (Methods). The HLH phylogenetic groups are shown in colored solid circles-. h, rTetR recruitment to the pEF1α reporter in K562 cells with 6 days of treatment with 1,000 ng ml−1 of doxycycline (n = 2 infection replicates shown as histograms). i, dCas9 recruitment to CD2 in K562 cells (n = 2 sgRNAs, sg717 in darker and sg718 in lighter shade). j, Full-length HLH TFs were defined as not yet defined (none, n = 45), activators (A, n = 13), both (A + R, n = 17) or repressors (R, n = 25), in previous studies reviewed in ref. . Colors show the effector function of HLH domains from these TFs.
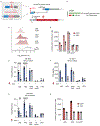
Fig. 3 ∣
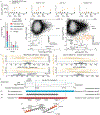
Fig. 3 ∣. Improved CRISPRi using ZNF705 and ZNF471 KRABs.
a, dCas9 recruitment in K562 cells. sgRNAs were delivered by lentivirus, followed by dCas9 constructs, and the cells were stained 7 days after dCas9 infection. The shaded histogram shows the cells after gating for both the dCas9 (BFP) and the sgRNA (mCherry), and their percentage of cells OFF is shown. The unshaded histogram shows the cells from the same sample that express neither and serve as an internal control (n = 1 infection replicate). b, Western blot of dCas9 only, ZNF10 KRAB and ZNF10 KRAB(WSR7EEE) fusions (n = 1 biological replicate). dCas9 and KRAB fusions were tagged with 3xFLAG. The band intensity ratio is below. c, Chromatin modifications mapped by CUT&RUN after dCas9 recruitment of ZNF10 KRAB(WSR7EEE) using sg15. Stable cell lines expressing the dCas9 fusion and the sgRNA were selected with antibiotics and fluorescent cell sorting before chromatin was analyzed. d, KRAB domains ranked by repression in HT-recruit screens across the target, cell type and DBD contexts (a higher average log2(OFF:ON) from two biological replicates is better ranked). The 323/336 KRAB domains that had no missing data across contexts are included. The red target labeled G shows the growth-based screen at the GATA1 enhancer. The HEK293T pEF screen has two time points as follows: a silencing measurement at 4 days after doxycycline addition and a memory measurement at day 12 (8 days after doxycycline removal). e, sgRNAs were delivered by lentivirus, followed by dCas9 constructs, and the cells were stained 9 days after dCas9 infection (n = 1). f, CRISPRi growth screen to compare KRAB repressors. A sgRNA library targeting 37 essential gene promoters was delivered into K562 cell lines that stably express either dCas9–KRAB. Cells were passaged for 14 days, and then the guides were sequenced to measure fitness effects (change from the original plasmid pool to the final day 14 genomic DNA). Greater depletion is a measure of stronger silencing of the essential genes. Each dot shows the average effect for a sgRNA, and the error bars show the s.d. from two screen replicates (n = 405 sgRNAs). The diagonal line represents the identity between KRAB domains. g, Results are shown similarly for the sgRNAs in the library that target cCREs of growth genes (n = 10,155 sgRNAs). h, sgRNAs were delivered to THP-1 monocytes by lentivirus, followed by dCas9 fusions. Eight days later, cells were stained. Gating and shading as in a (n = 2 targeting sgRNAs shown as histograms). i, dCas12a recruitment in K562 cells. dCas12a–KRAB fusions and then guide RNAs were delivered by lentivirus. Nine days after guide RNA infection, cells were stained. Data are gated for guide RNA expression (mCherry) and dCas12a expression (hemagglutinin (HA)-tag stain). Infection replicates are shown as separate histograms (n = 2 biological replicates shown as histograms). cCREs, candidate cis-regulatory elements.
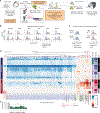
Fig. 4 ∣
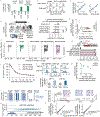
Fig. 4 ∣. Compact NFZ activator improves CRISPRa systems in different cell types.
a, HT-recruit scores for activators that were hit in ≥5 samples across the target, cell type and DBD contexts (n = 2 replicates per rTetR screen and n = 1–2 replicates per sgRNA for dCas9 screens shown as columns). The rows are clustered in an unbiased manner. Labels for NCOA3 (1,045–1,092; N), FOXO3 FOXO–TAD (604–644; F) and ZNF473 KRAB (5–48; Z) are colored. b, Size of N, Z and F human activator domains and combinations compared to viral activators. c, The effectors were recruited with dCas9 in K562 cells. sgRNAs were delivered by lentivirus, and cells were selected with puromycin. Then dCas9 fusions were delivered by 10× concentrated lentivirus. Four days after dCas9 delivery, cells were stained and measured by flow cytometry (n = 2 infection replicates shown as histograms). Left, CD2 expression after gating cells for sgRNA delivery (GFP). Middle, the average percentage of cells with dCas9 delivery (BFP) is written in blue. Right, CD2 expression after gating for both sgRNA and dCas9 delivery. The darker histogram is CD2 sg717, and the lighter shade is sg718. d, Comparison of activation and dCas9-activator delivery (BFP) after gating for sg717 delivery (GFP+). Color shows the smoothed density of flow cytometry data. The percentage of BFP+ cells is labeled (n = 2 infection replicates). e, Schematics of CRISPR activator systems using the NFZ tripartite activator fused to dCas9, dEnAsCas12a or dCasMINI_V4. f, dCas9 activators were delivered by 5× concentrated lentivirus into stable sgRNA-expressing cell lines; 5 days later, blasticidin selection was started, and then 4 days later, cells were stained. Top, the percentage of cells ON (APC) is shown after gating for the sgRNA (GFP+) and dCas9 (BFP+). All of the VPR samples had <250 BFP+ cells counted (associated with poor infection and survival of blasticidin selection), while all other samples had >6k BFP+ cells (mean = 53k). Bottom, the percentage of BFP+ cells is shown (n = 5–7 sgRNAs per effector). The CD28 sgRNAs infected with VPR poorly survived blasticidin selection, and <300 cells total could be counted, so they are not shown. g, dCas9–NFZ was stably delivered to J774 mouse macrophages by lentivirus and selected with blasticidin. Activation of endogenous Gpr84 or Actc1 measured by qPCR after lentiviral sgRNA delivery (n = 3 qPCR replicates). NT sgRNAs are negative controls. h, THP-1 monocytes stably expressing the sgRNAs were generated using lentiviral delivery, followed by infection with dCas9-activator lentiviruses. Cells were stained for CD2 expression 8 days later. Gated for sgRNA delivery (GFP) and dCas9 (BFP; n = 1 infection per sgRNA). i, iPSCs were transfected with dCas9 activator and sgRNA plasmids and then stained 2 days later. Gated for sgRNA delivery (GFP) and dCas9 (BFP; n = 3 transfection replicates shown as histograms). The percentage of cells ON with the gene-targeting sgRNA, using the threshold shown by the black vertical line, is shown. j, dEnAsCas12a activators on a marker-less plasmid were co-electroporated into K562 cells with a gRNA-mCherry expression plasmid. After 3 days, cells were stained. Gated for high mCherry (n = 2 replicates). K, dCasMINI activators on a plasmid with an mCherry marker were cotransfected into HEK293T GFP reporter cells with a gRNA-BFP expression plasmid. Two days later, GFP reporter activation was measured by flow cytometry with gates for BFP+/mCherry+ cells (n = 6 transfection replicates shown as dots, and bar shows mean). Np NLS, nucleoplasmin nuclear localization signal; NT, nontargeting.
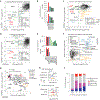
Fig. 5 ∣
Fig. 5 ∣. Compact NFZ activator improves therapeutically relevant inducible systems.
a, Schematic representation of the minimized rapamycin-inducible transcription cassette using the ZFHD1 DBD fused to NFZ. b, Rapamycin-inducible expression of citrine with ZFHD1 recruitment of NFZ or a control activator combination, p65 + HSF1. In total, 3 μg of plasmids were transfected into HEK293T cells; 1 day later, 10 nM rapamycin was added, and then 2 d later, citrine MFI was measured by flow cytometry (n = 2 transfection replicates shown as dots, and bar shows mean). c, Rapamycin-inducible expression of HGF with ZFHD1 recruitment of NFZ, after transfection in HEK293T cells. Secreted HGF protein concentrations were measured in the cell culture supernatant by ELISA after 2 days of rapamycin treatment with varied doses. Transfection of no plasmid and a constitutive pEF1α–HGF plasmid served as a negative and positive control, respectively (n = 2 transfection replicates; the curve shows nonlinear regression fit to dose–response data). d, Schematic representation of synZiFTR circuit for drug-regulated control of CAR T cells. SynZiFTR uses the FDA-approved drug Grazoprevir (GZV) to inducibly inhibit NS3 protease-mediated self-cleavage of an engineered zinc finger activator. Upon induction, the activator is recruited to synthetic ZF10-binding motifs to activate an anti-CD19 CAR fused to a mCherry reporter. Bottom illustration shows a synZiFTR CAR T cell targeting a CD19+ cancer cell. e, Efficiency of activating CAR–mCherry as measured using the vertical threshold shown in Extended Data Fig. 10c (n = 1–2 infection replicates measured with two technical replicates each shown as dots, and bar shows mean and error bars show s.d.). ‘Cons. CAR’ control is the constitutive spleen focus-forming virus (SFFV) promoter, and ‘no synZF’ control only contains the CAR–mCherry transgene. f, After 72 h of induction with GZV, SynZiFTR T cells were cocultured in the continuous presence of GZV for 48 h with a CD19+ NALM6 precursor leukemia B cell line engineered to express BFP. Killing efficiency was estimated by measuring the reduction in BFP+ cells compared to a NALM6-only negative control by flow cytometry (n = 1–2 infection replicates measured with three technical replicates each shown as dots, bars show mean and error bars show s.d.). **P < 0.005 and ****P < 0.00005, by two-sided unpaired t test. UTD, untransduced; MFI, mean fluorescence intensity.

References

    1. Lambert SA et al. The human transcription factors. Cell 172, 650–665 (2018). - PubMed
    1. Medvedeva YA et al. EpiFactors: a comprehensive database of human epigenetic factors and complexes. Database 2015, bav067 (2015). - PMC - PubMed
    1. Göös H. et al. Human transcription factor protein interaction networks. Nat. Commun 13, 766 (2022). - PMC - PubMed
    1. Perez-Pinera P. et al. RNA-guided gene activation by CRISPR–Cas9-based transcription factors. Nat. Methods 10, 973–976 (2013). - PMC - PubMed
    1. Gilbert LA et al. CRISPR-mediated modular RNA-guided regulation of transcription in eukaryotes. Cell 154, 442–451 (2013). - PMC - PubMed

Substances