. 2024 Nov 1;7(1):1424.
doi: 10.1038/s42003-024-07062-z.

Combined transcriptome and proteome profiling reveal cell-type-specific functions of Drosophila garland and pericardial nephrocytes

Affiliations

Combined transcriptome and proteome profiling reveal cell-type-specific functions of Drosophila garland and pericardial nephrocytes

Heiko Meyer et al. Commun Biol. .

Abstract

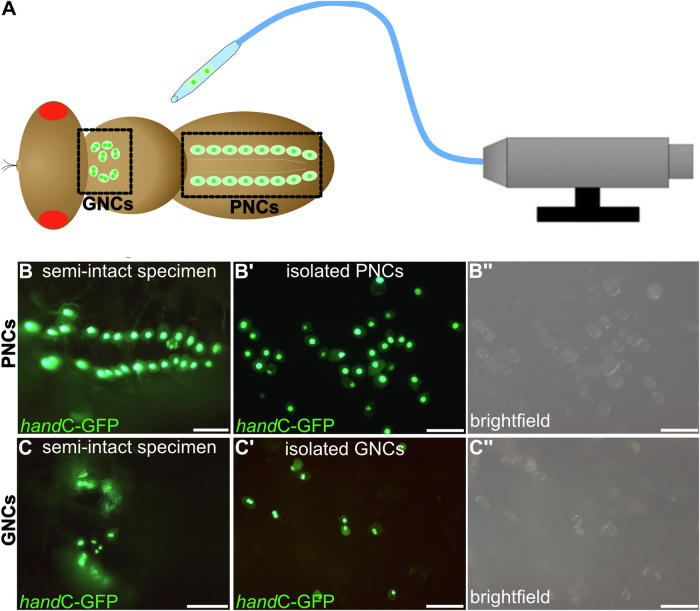
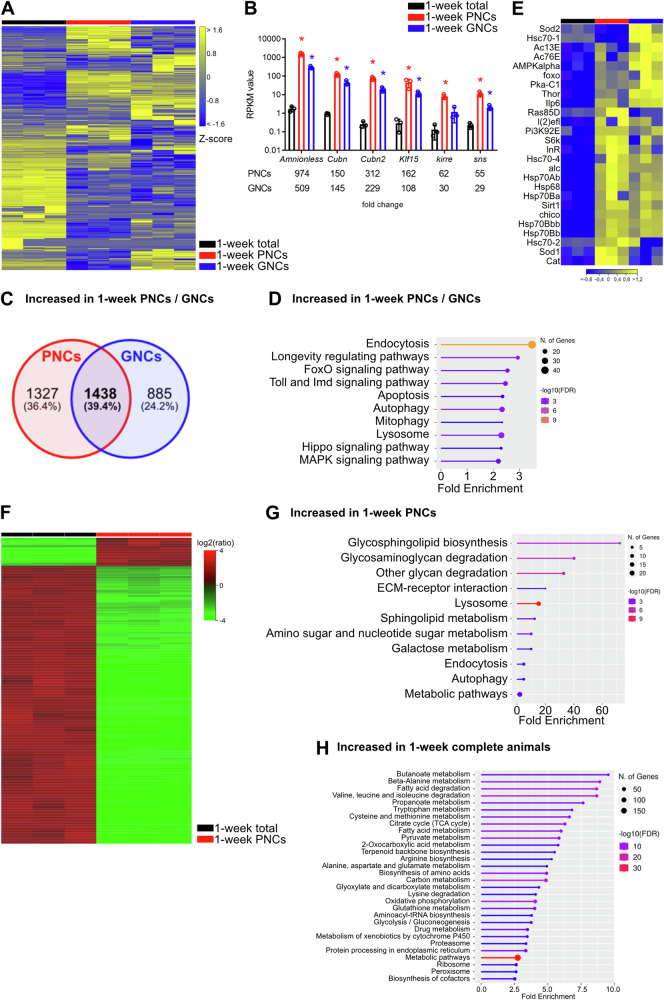
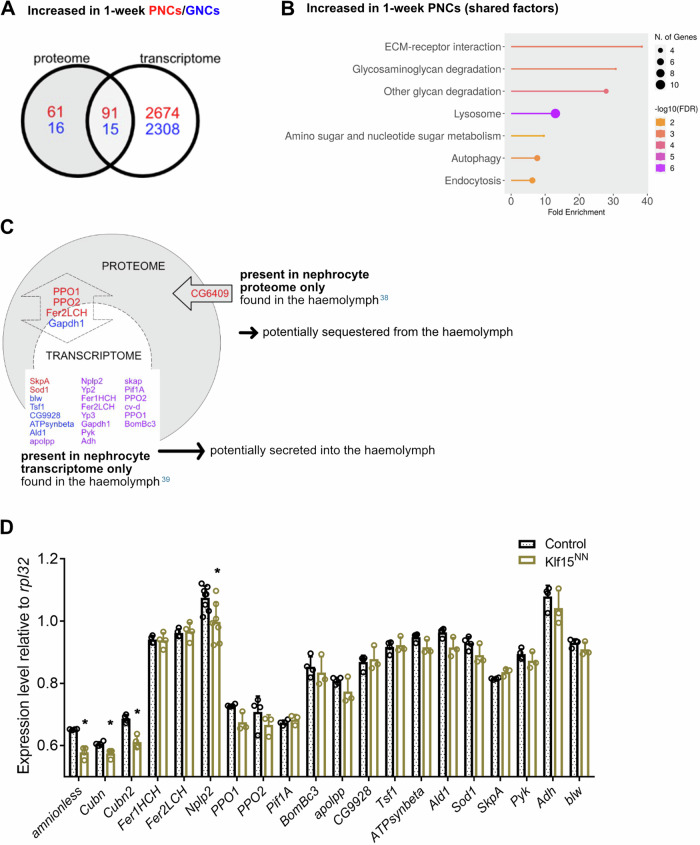
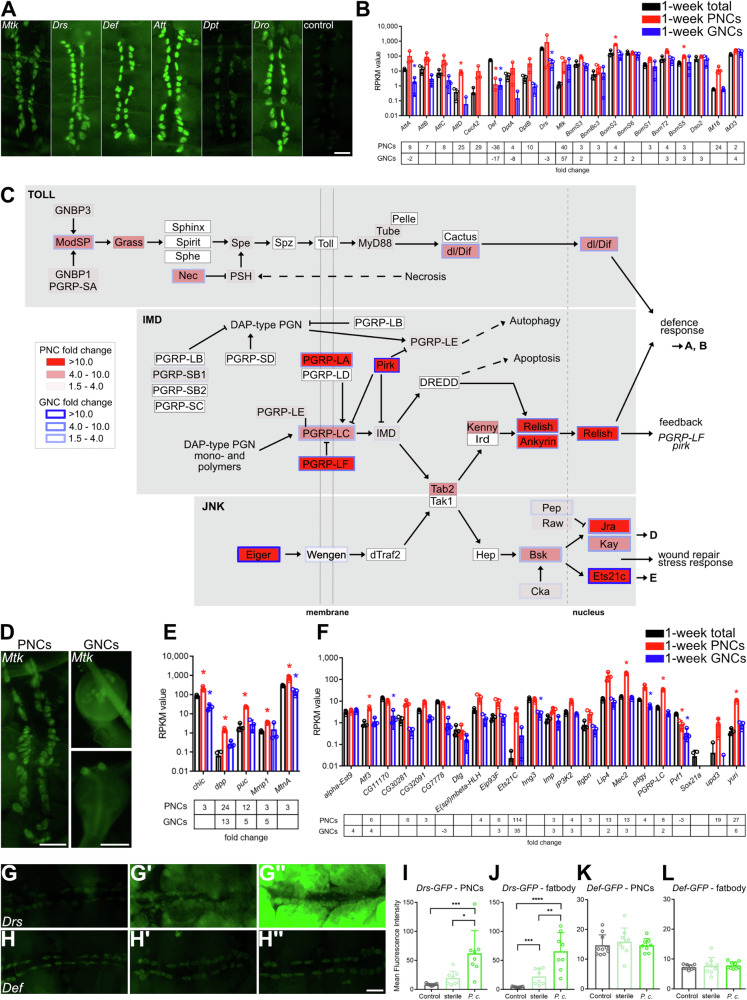
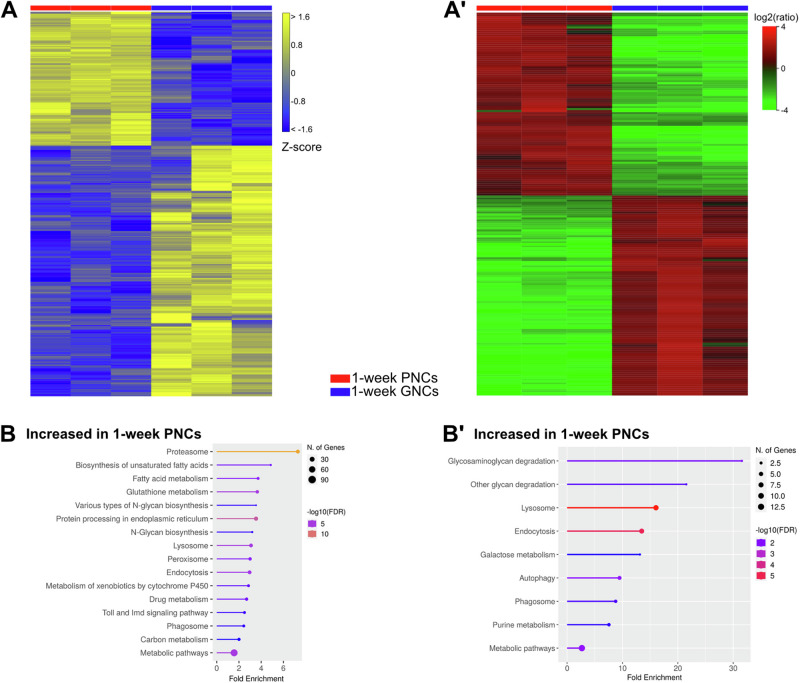
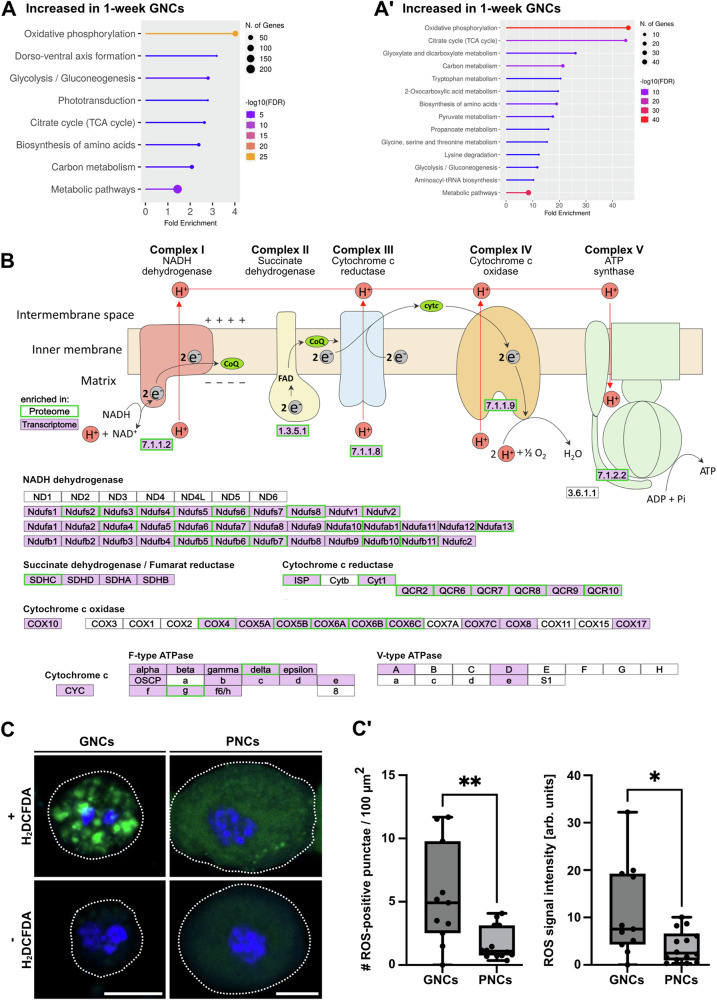
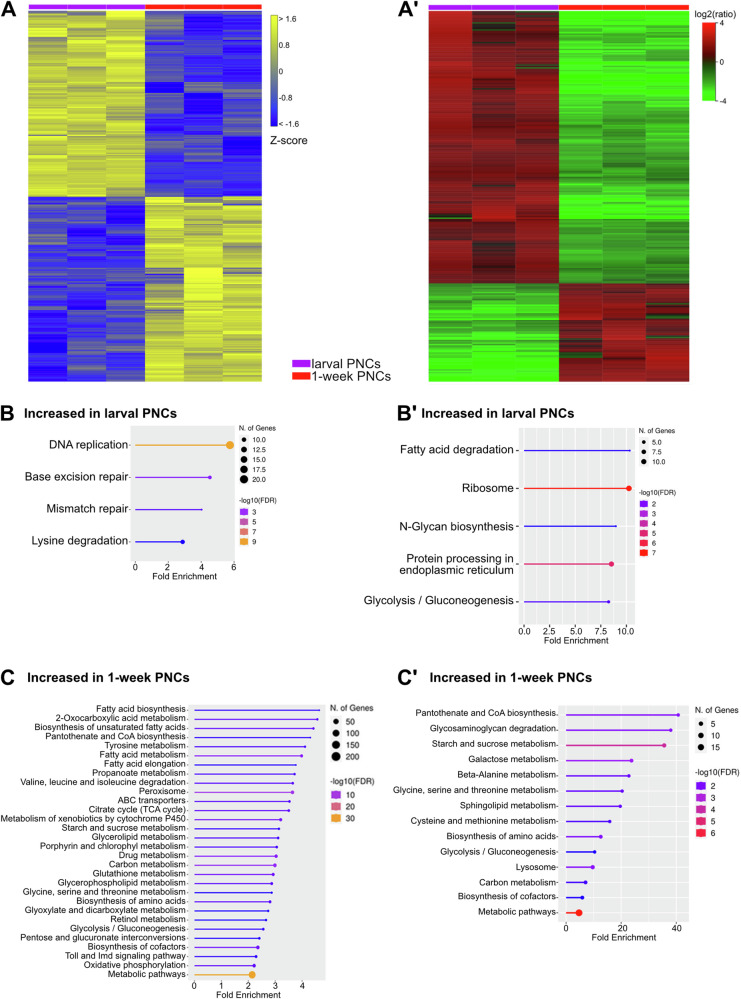
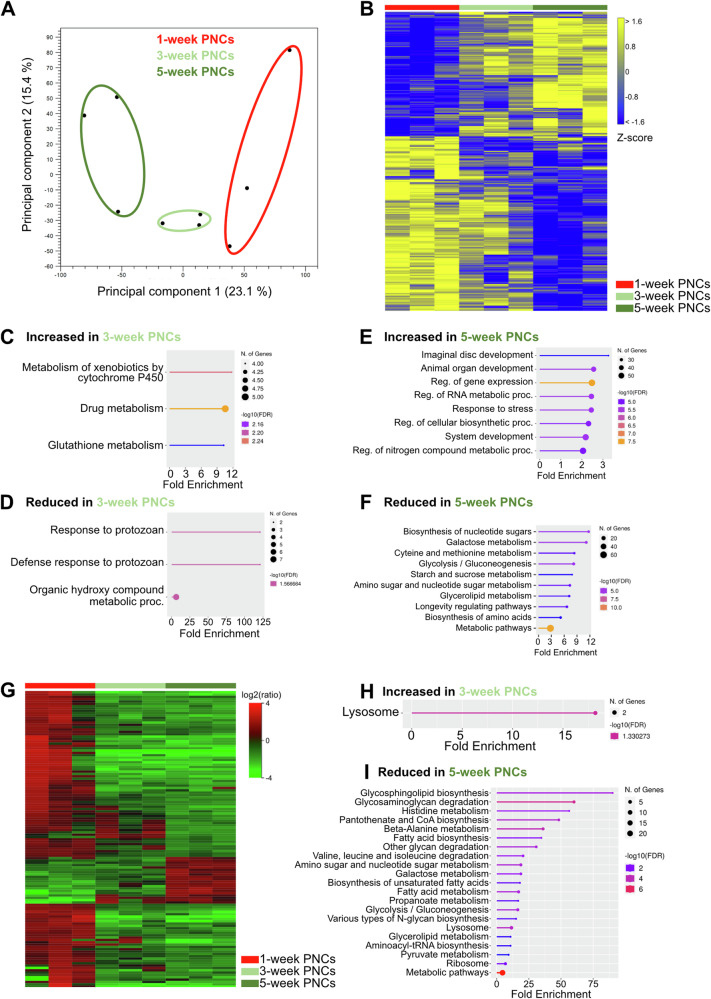
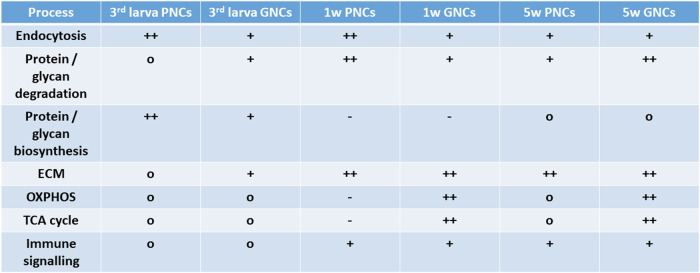
Drosophila nephrocytes are specialised cells that share critical functional, morphological, and molecular features with mammalian podocytes. Accordingly, nephrocytes represent a preferred invertebrate model for human glomerular disease. Here, we established a method for cell-specific isolation of the two types of Drosophila nephrocytes, garland and pericardial cells, from animals of different developmental stages and ages. Mass spectrometry-based proteomics and RNA-Seq-based transcriptomics were applied to characterise the proteome and transcriptome of the respective cells in an integrated and complementary manner. We observed characteristic changes in the proteome and transcriptome due to cellular ageing. Furthermore, functional enrichment analyses suggested that larval and adult nephrocytes, as well as garland and pericardial nephrocytes, fulfil distinct physiological functions. In addition, the pericardial nephrocytes were characterised by transcriptomic and proteomic profiles suggesting an atypical energy metabolism with very low oxidative phosphorylation rates. Moreover, the nephrocytes displayed typical signatures of extensive immune signalling and showed an active antimicrobial response to an infection. Factor-specific comparisons identified novel candidate proteins either expressed and secreted by the nephrocytes or sequestered by them. The data generated in this study represent a valuable basis for a more specific application of the Drosophila model in analysing renal cell function in health and disease.


Conflict of interest statement

The authors declare no competing interests.

Figures

Fig. 1
Fig. 1. Experimental setup for isolating garland or pericardial nephrocytes from adult flies.
A handC-GFP expressing female flies were immobilised, ventral side up, and either garland (GNCs) or pericardial nephrocytes (PNCs) were isolated using a CellTram equipped with a thin glass capillary. Semi-intact specimen before collagenase treatment with GFP-labelled pericardial cells (B, one nucleus per cell) or garland cells (C, two nuclei per cell). (B’, B”, C’, C”) After collagenase treatment. The dissociated nephrocytes are isolated and collected. Scale bars: 100 µm.
Fig. 2
Fig. 2. Core characteristics of nephrocytes at the transcript and protein level.
A Heatmap of RNAseq replicates (minimum fold change 1.5, FDR p value cutoff 0.05) from total animals (black bar), PNCs (red bar) and GNCs (blue bar). B RPKM values of Amnionless, Cubilin (Cubn) and Cubilin 2 (Cubn2), Kruppel-like factor 15 (Klf15), sticks and stones (sns), and kin of irre (kirre) in the three groups. The corresponding fold changes relative to complete animals are shown in the lower panel. Asterisks indicate a differential expression of the respective gene compared to the total animals. C Venn diagram of 2765 upregulated genes in PNCs and 2323 upregulated genes in GNCs, relative to total animals; 1438 genes (39.4%) were shared between the two groups. D KEGG pathway enrichment analysis of the shared genes. E Heatmap of genes associated with the ‘Longevity regulating pathway’ (KEGG) depicting alterations for the RNA-seq groups and replicates. F Heatmap of proteome replicates from total animals (black bar) and PNCs (red bar). G KEGG pathways enriched in PNCs, relative to complete animals. H KEGG pathways enriched in complete animals, relative to PNCs.
Fig. 3
Fig. 3. Correlative analyses of the nephrocyte transcriptome and proteome.
A Red: Venn diagram of 152 proteins enriched in PNCs and 2765 genes upregulated in PNCs, relative to total animals; 91 proteins/genes were shared between the two groups, which corresponds to 59.9% of the enriched proteins. Blue: Venn diagram of 31 proteins enriched in GNCs and 2323 genes upregulated in GNCs, relative to total animals; 15 proteins/genes were shared between the two groups, which corresponds to 48.4% of the enriched proteins. B KEGG pathway enrichment analysis of the shared factors. C Analysis of factors present only in the nephrocyte proteome (arrow), only in the nephrocyte transcriptome (dashed circle), or in both (double arrow). Factors in red font were detected only in PNCs, factors in blue font only in GNCs, and factors in purple font were detected in both cell types. D Quantitative RT-PCR of the genes expressed in 1-week-old animals with depleted nephrocytes (Klf15NN), relative to wildtype (w1118). Mean and SD are shown, n = 4, *p = <0.05, Mann–Whitney U test.
Fig. 4
Fig. 4. Nephrocytes exhibit increased expression of Toll, Imd and JNK signalling components.
A Expression of different antimicrobial peptides in PNCs indicated by GFP reporter activity. Control animals (w1118) do not exhibit any signal above background. Scale bar: 100 µm. B RNAseq RPKM (Reads Per Kilobase Million) values of defence response target genes in PNCs and GNCs, relative to complete animals (total). The lower panel depicts the expression fold changes in PNCs and GNCs relative to the total animals. C Schematic representation of Toll, Imd and JNK signalling pathways. RNAseq fold change of PNCs (red background) and GNCs (blue frame), relative to total animals, is indicated by colour coding. Insignificant differential expression of a component is indicated by a white fill (PNCs) or a fine black border (GNCs). Connected pathways are depicted by dashed arrows. Targeted processes downstream of the three pathways are shown to the right. D Mtk-GFP reporter expression in PNCs (left) and GNCs (right). Scale bars: 100 µm. E RPKM values of JNK target genes regulated by Jra/Kay in PNCs (red) and GNCs (blue), relative to complete animals. The lower panel depicts the corresponding expression fold changes. F RPKM values of JNK target genes regulated by Ets21c in PNCs (red) and GNCs (blue), relative to complete animals. The lower panel depicts the corresponding expression fold changes. Asterisks indicate a differential expression of the respective gene compared to the total animals (B, E, F). GL Uninfected PNCs of Drs-GFP and Def-GFP reporter lines (G, H) compared to sterile infected (G’, H’) and Pectobacterium carotovorum (P.c.) infected adults (G”, H”). Scale bar: 1 mm. The mean fluorescence intensity of PNCs (I, K) and the adjacent fatbody cells (J, L) was quantified. Mean and SD are shown, n > 8, *p = <0.05, **p = <0.01, ***p = <0.001, ****p = <0.0001, Mann–Whitney U test.
Fig. 5
Fig. 5. Nephrocytes exhibit cell-type-specific transcriptomic and proteomic signatures.
A Heatmap of RNAseq replicates (minimum fold change 1.5, FDR p value cutoff 0.05) from 1-week-old PNCs (red bar) and 1-week-old GNCs (blue bar). (A´) Heatmap of proteome replicates from 1-week-old PNCs (red bar) and 1-week-old GNCs (blue bar). B KEGG pathways (transcriptome-based) enriched in 1-week-old PNCs, relative to 1-week-old GNCs. (B´) KEGG pathways (proteome-based) enriched in 1-week-old PNCs, relative to 1-week-old GNCs.
Fig. 6
Fig. 6. Nephrocytes exhibit transcriptomic and proteomic signatures indicative of a cell-type-specific energy metabolism.
A KEGG pathways (transcriptome-based) enriched in 1-week-old GNCs, relative to 1-week-old PNCs. (A´) KEGG pathways (proteome-based) enriched in 1-week-old GNCs, relative to 1-week-old PNCs. B Scheme depicting factors relevant to oxidative phosphorylation (KEGG pathway). Transcripts (purple background) and proteins (green frame) with significantly increased abundance in GNCs, relative to PNCs, are highlighted. C Isolated GNCs and PNCs with or without the addition of a ROS indicator (H2DCFDA, green channel). DAPI was used as a counter stain to visualise the nuclei (blue channel). A dotted line indicates the cell perimeter. Scale bars: 10 µm. (C´) The number (#) of ROS-positive punctae and the overall ROS signal intensity were determined by pixel intensity measurements. Signal intensities were normalised to corresponding control cells without the ROS indicator. For both boxplots, the centre line indicates the median, the upper and lower bounds indicate the 75th and 25th percentiles, respectively, and the whiskers indicate the minimum and maximum. For each analysis, a minimum of 10 individual cells was measured. Asterisks indicate statistically significant differences between the two cell types (*p < 0.05, **p < 0.01, Mann–Whitney U test).
Fig. 7
Fig. 7. Nephrocytes exhibit developmental stage-specific transcriptomic and proteomic signatures.
A Heatmap of RNAseq replicates (minimum fold change 1.5, FDR p value cutoff 0.05) from 3rd instar larval PNCs (purple bar) and 1-week-old adult PNCs (red bar). (A´) Heatmap of proteome replicates from 3rd instar larval PNCs (purple bar) and 1-week-old adult PNCs (red bar). B KEGG pathways (transcriptome-based) enriched in 3rd instar larval PNCs, relative to 1-week-old adult PNCs. (B´) KEGG pathways (proteome-based) enriched in 3rd instar larval PNCs, relative to 1-week-old adult PNCs. C KEGG pathways (transcriptome-based) enriched in 1-week-old adult PNCs, relative to 3rd instar larval PNCs. (C´) KEGG pathways (proteome-based) enriched in 1-week-old adult PNCs, relative to 3rd instar larval PNCs.
Fig. 8
Fig. 8. Nephrocytes exhibit age-dependent changes in transcriptomic and proteomic signatures.
A Principal component analysis of transcriptome profile alterations among 1-week- (1w), 3-week- (3w) and 5-week- (5w) old PNCs. Circles were added manually. B Heatmap of RNAseq replicates (minimum fold change 1.5, FDR p value cutoff 0.05) from 1-week-old PNCs (red bar), 3-week-old PNCs (light green bar) and 5-week-old PNCs (dark green bar). C KEGG pathways enriched in 3-week-old PNCs, relative to 1-week-old PNCs (transcriptome-based). D KEGG pathways (transcriptome-based) reduced in 3-week-old PNCs, relative to 1-week-old PNCs. E Biological processes increased in 5-week-old PNCs, relative to 1-week-old PNCs (transcriptome-based). F Biological processes reduced in 5-week-old PNCs, relative to 1-week-old PNCs (transcriptome-based). G Heatmap of proteome replicates isolated from 1-week-old PNCs (red bar), 3-week-old PNCs (light green bar) and 5-week-old PNCs (dark green bar). H KEGG pathways enriched in 3-week-old PNCs, relative to 1-week-old PNCs (proteome-based). I KEGG pathways reduced in 5-week-old PNCs, relative to 1-week-old PNCs (proteome-based).
Fig. 9
Fig. 9. Summary of garland and pericardial nephrocyte characteristics.
Depicted are processes that were indicated as significantly upregulated (+, ++) or downregulated (−) in GNCs or PNCs, relative to complete animals (o = not significantly altered). ‘1w’ and ‘5w’ indicate animals of 1 week and 5 weeks of age, respectively.

References

    1. Knepper, M. A., Kwon, T. H. & Nielsen, S. Molecular physiology of water balance. N. Engl. J. Med.372, 1349–1358 (2015). - PMC - PubMed
    1. Caulfield, J. P. & Farquhar, M. G. The permeability of glomerular capillaries to graded dextrans. Identification of the basement membrane as the primary filtration barrier. J. Cell Biol.63, 883–903 (1974). - PMC - PubMed
    1. Hamano, Y. et al. Determinants of vascular permeability in the kidney glomerulus. J. Biol. Chem.277, 31154–31162 (2002). - PubMed
    1. Weavers, H. et al. The insect nephrocyte is a podocyte-like cell with a filtration slit diaphragm. Nature457, 322–U325 (2009). - PMC - PubMed
    1. Dow, J. A. T. et al. The malpighian tubules of Drosophila melanogaster—a novel phenotype for studies of fluid secretion and its control. J. Exp. Biol.197, 421–428 (1994). - PubMed