. 2024 Dec;25(12):5537-5560.
doi: 10.1038/s44319-024-00303-6. Epub 2024 Nov 1.

STAG2 loss in Ewing sarcoma alters enhancer-promoter contacts dependent and independent of EWS::FLI1

Affiliations

STAG2 loss in Ewing sarcoma alters enhancer-promoter contacts dependent and independent of EWS::FLI1

Daniel Giménez-Llorente et al. EMBO Rep. 2024 Dec.

Abstract

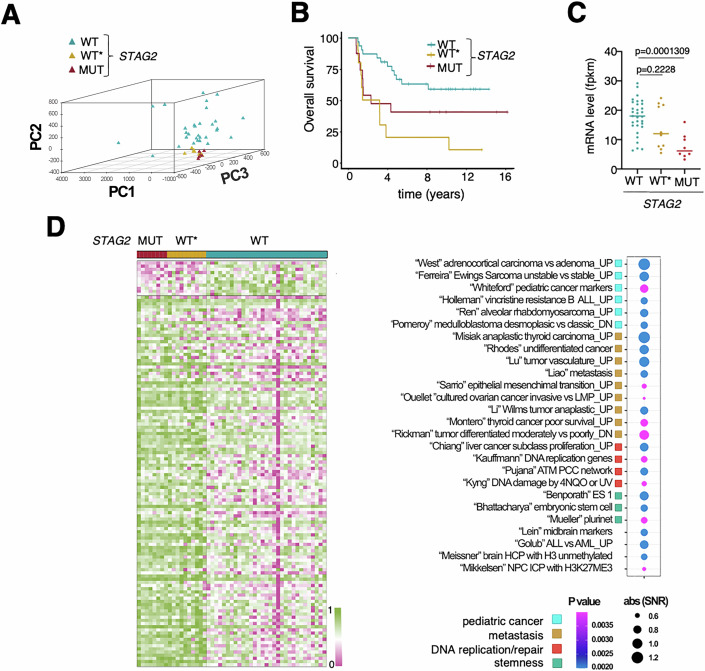
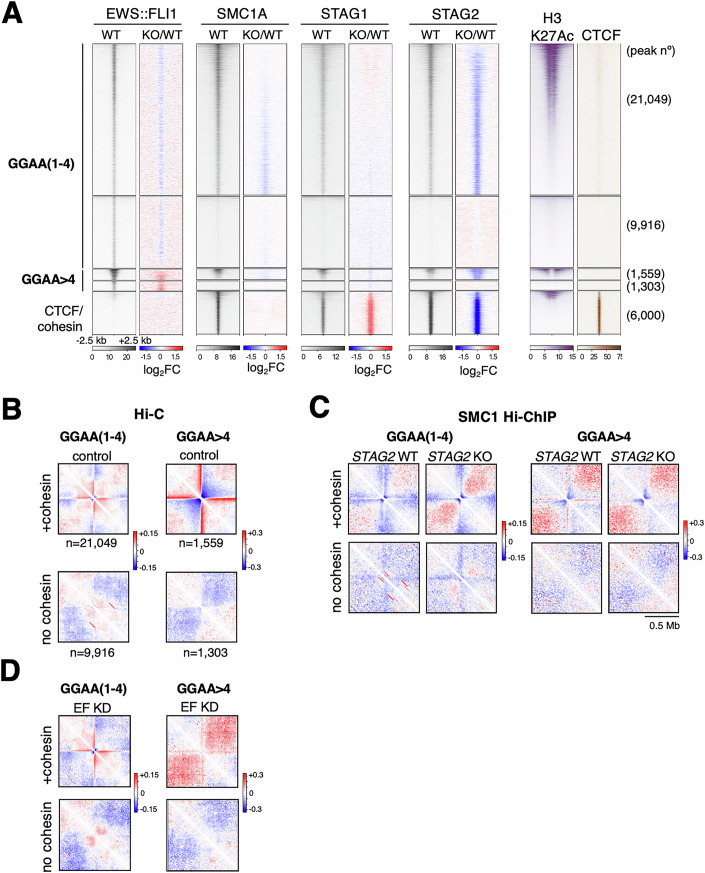
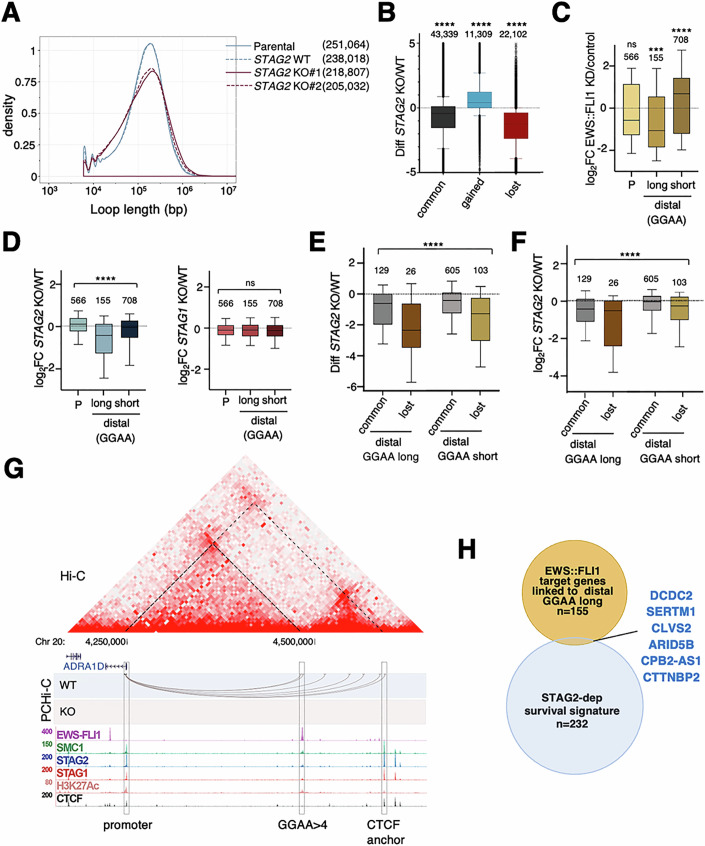
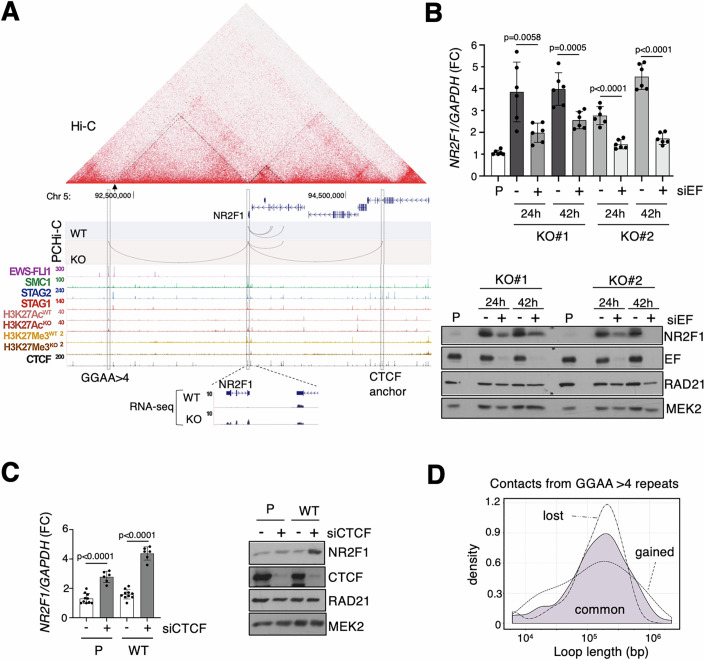
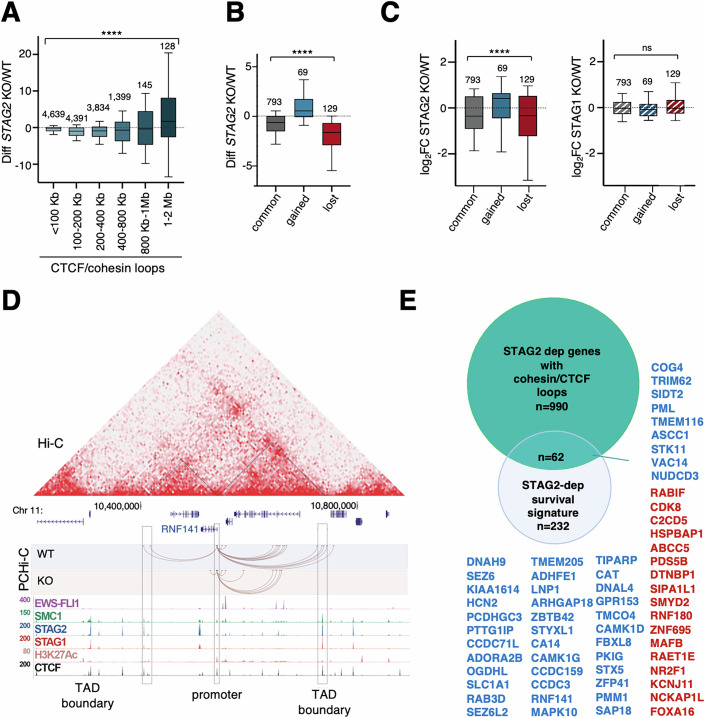
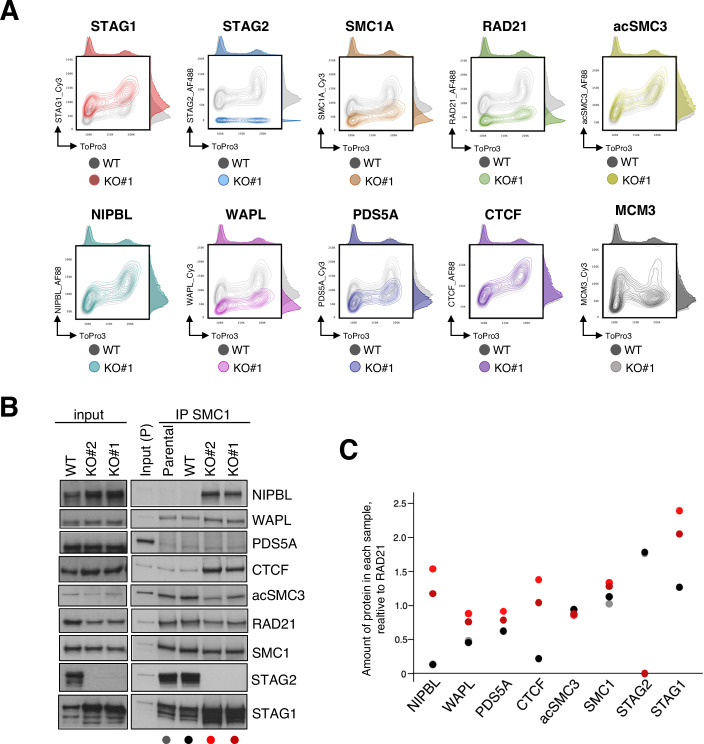
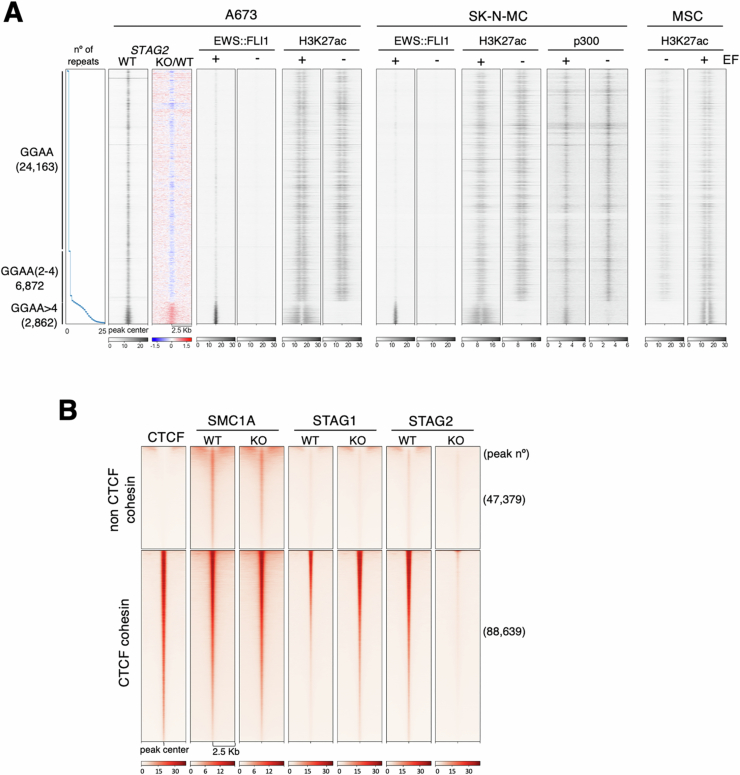
Cohesin complexes carrying STAG1 or STAG2 organize the genome into chromatin loops. STAG2 loss-of-function mutations promote metastasis in Ewing sarcoma, a pediatric cancer driven by the fusion transcription factor EWS::FLI1. We integrated transcriptomic data from patients and cellular models to identify a STAG2-dependent gene signature associated with worse prognosis. Subsequent genomic profiling and high-resolution chromatin interaction data from Capture Hi-C indicated that cohesin-STAG2 facilitates communication between EWS::FLI1-bound long GGAA repeats, presumably acting as neoenhancers, and their target promoters. Changes in CTCF-dependent chromatin contacts involving signature genes, unrelated to EWS::FLI1 binding, were also identified. STAG1 is unable to compensate for STAG2 loss and chromatin-bound cohesin is severely decreased, while levels of the processivity factor NIPBL remain unchanged, likely affecting DNA looping dynamics. These results illuminate how STAG2 loss modifies the chromatin interactome of Ewing sarcoma cells and provide a list of potential biomarkers and therapeutic targets.

Keywords: Cohesin; Genome Organization; Pediatric Cancer; Transcription.


Conflict of interest statement

Disclosure and competing interests statement. The authors declare no competing interests.

Figures

Figure 1
Figure 1. Transcriptome changes in response to STAG2 loss in Ewing sarcoma patients.
(A) PCA of transcriptome data from patients of the IGC cohort (n = 49) uncovers a subset of 10 patients (WT*) with no detectable STAG2 mutations that cluster with STAG2 mutant (MUT) cases. (B) Survival probability in the three groups of patients defined above. P values were obtained with Cox proportional hazards regression model comparing STAG2 WT* vs WT (0.0001309) and STAG2 WT* vs MUT (0.19806). (C) STAG2 expression levels in the three groups. Each dot corresponds to a patient, colored as in (A); p values were calculated with a Mann–Whitney test. (D) Left, ssGSEA separates STAG2 WT and MUT patients and further shows that STAG2 MUT and WT* patients display similar enrichments. The actual enrichment (Signal to Noise Ratio, SNR) and significance (P value) of selected gene sets in the transcriptome of STAG2 MUT patients were obtained using the tool “ComparativeMarkerSelection” from GenePattern and are shown on the right. Source data are available online for this figure.
Figure 2
Figure 2. Identification of a STAG2-dependent gene signature associated with survival in Ewing sarcoma.
(A) Heatmap showing expression data for STAG2 and 232 STAG2-dependent genes in cells and patients proficient or deficient for STAG2, as indicated. Patient data from the IGC cohort (Data ref: Tirode et al, 2014). Replicates (r) were obtained for A673 parental cell line (P), WT clone and for parental clones either mock transfected (siC) or transfected with siSTAG2. See Dataset EV1 for lists of DEGs in each condition. (B) PCA segregates patients from two independent cohorts (n = 109; primary tumors only; Data ref: Savola et al, ; Data ref: Volchenboum et al, 2015) according to expression of 232 STAG2-dependent genes. See Methods for details. (C) Overall survival probability in these patients (n = 27 signature-like and n = 82 signature-different). P value calculated with Cox proportional hazards regression model. (D) mRNA levels of STAG2 in the same patients. P value calculated with Mann–Whitney test. Source data are available online for this figure.
Figure 3
Figure 3. Cohesin-STAG2 contributes to the establishment of EWS::FLI1 mediated interactions at long GGAA repeats.
(A) Genome-wide distribution of EWS::FLI1 in A673 cells and presence of cohesin, H3K27ac, and CTCF at those sites (gray heatmaps). Changes in this distribution in STAG2 KO cells are shown for EWS::FLI1 and cohesin (colored heatmaps, log2FC). Sites have been separated according to the number of GGAA repeats (see also Fig. EV3A) and further subdivided according to the presence or absence of cohesin-STAG2. The cluster at the bottom is a fraction of CTCF/cohesin sites provided for comparison. Full map of these sites in Fig. EV3B. (BD) Metaplots that aggregate chromatin interactions from Hi-C (B, D) or SMC1 Hi-ChIP data (C) emanating from GGAA repeats of different length, with or without cohesin, and extending up to 0.5 Mb away in both directions. Numbers (n, below each metaplot) in (C) and (D) are the same as in (B) and come from the analyses shown in (A). Color scales represent the ratio of Observed over Expected interactions (log2). (B) and (D) show interactions in control (B) and EWS::FLI1 (EF) KD cells (D). For datasets used, see Table EV1.
Figure 4
Figure 4. Cohesin STAG2-mediated looping facilitates contacts between EWS::FLI1-bound long GGAA repeats and target promoters.
(A) Distribution of loop length according to PCHi-C analyses in the indicated conditions. (B) Changes in contacts between STAG2 KO and WT conditions in the indicated loops. Mann–Whitney test, ****p < 0.0001. Number of contacts in each category is indicated on top of the box. (C) Gene expression changes after EWS::FLI1 KD in genes with EWS::FLI1-bound at GGAA motif(s) present at their promoter (P) and genes whose promoters interact with distal GGAA repeats of the indicated length, also bound by EWS::FLI1. Mann–Whitney test: ns, not significant, p = 0.2361; ***p = 0.0007; ****p < 0.0001. (D) Gene expression changes in the same genes as (C) in STAG2 KO (left) or STAG1 KO (right) cells. Kruskal–Wallis test: ns, not significant, p = 0.5532; ****p < 0.0001. (E) Changes in contacts between promoters and distal GGAA repeats upon STAG2 loss. Kruskal–Wallis test: ****p < 0.0001. (F) Correlation between gene expression and contact changes for EWS::FLI1 target genes with no EWS::FLI1 at promoters. Kruskal–Wallis test: ****p < 0.0001. In (CF), number of genes in each category is indicated above the box. For all boxplots in (BF), the minimum and maximum are typically 1.5 times the Interquartile Range (IQR) from the quartiles, the center value is the median, the box edges are the 25th (Q1) and 75th (Q3) percentiles, and the whiskers extend to the nearest non-outlier points within 1.5 times the IQR. (G) Genomic landscape of the region encompassing ADRA1D. From top to bottom, Hi-C matrix, contacts from PCHi-C from the ADRA1D promoter and ChIP-seq data. Dotted lines in the Hi-C matrix identify loops emanating from ADRA1D promoter. (H) Venn diagram showing overlap between the indicated gene subsets. Source data are available online for this figure.
Figure 5
Figure 5. Loops established upon STAG2 loss create new EWS::FLI1 target genes.
(A) Genomic landscape of the region encompassing the NR2F1 gene, an upregulated gene of the survival signature, as in previous Fig. 4G. Reads from RNA-seq for this gene are included at the bottom. (B) Gene expression levels of NR2F1 measured by qRT-PCR (top) and protein levels assessed by immunoblot analysis of whole-cell extracts (bottom) of STAG2 KO A673 cells either mock transfected (−) or transfected (+) with siRNA against EWS::FLI1 (siEF). Non-transfected parental A673 cells (P) were used as a reference. MEK2 was used as a loading control. Bar graph represents mean ± SD from n = 6 biological replicates, one-way ANOVA test. (C) As in (B) for Parental (P) and STAG2 WT A673 cells either mock transfected (−; n = 10) or transfected (+; n = 6) with siRNA against CTCF (siCTCF) for 72 h. Bar graph represents mean ± SD, one-way ANOVA test. (D) Loop length distribution of chromatin contacts anchored at long GGAA repeats that either persist (common, mauve), or are lost or gained in STAG2 KO A673 cells. Source data are available online for this figure.
Figure 6
Figure 6. Gene expression changes independent of EWS::FLI1 that result from changes in CTCF/cohesin loops.
(A) Changes in all cohesin/CTCF-bordered interactions between promoters and distal regions for different loop sizes upon STAG2 loss. The number of interactions in each category is indicated on the top of the box. Kruskal–Wallis test: ****p < 0.0001. (B) Differential interactions between STAG2 WT and KO cells for cohesin/CTCF loops involving STAG2-dependent genes (number of genes is indicated). Kruskal–Wallis test: ****p < 0.0001. (C) Gene expression changes associated with the loops in (B) in STAG2 KO (left) and STAG1 KO cells (right). Number of genes in each category is indicated above the box. Kruskal–Wallis test: ns, not significant, p = 0.2678; ****p < 0.0001. In boxplots in (AC), the minimum and maximum are typically 1.5 times the Interquartile Range (IQR) from the quartiles, the center value is the median, the box edges are the 25th (Q1) and 75th (Q3) percentiles, and the whiskers extend to the nearest non-outlier points within 1.5 times the IQR. (D) Genomic landscape of the region encompassing RNF141, which belongs to the survival signature. (E) Venn diagram showing overlap between the indicated gene subsets. Upregulated genes are in red, downregulated genes are in blue. Source data are available online for this figure.
Figure 7
Figure 7. STAG2 loss alters the balance of cohesin regulators in Ewing sarcoma cells.
(A) Chromatin-bound levels of cohesin subunits and regulators assessed by Chromoflow flow cytometry. A representative experiment comparing A673 WT and STAG2 KO#1 is shown. Similar results were obtained comparing WT or Parental cells and STAG2 KO#1 or KO#2 in two independent experiments. (B) Immunoprecipitation of cohesin with anti-SMC1 from the indicated cell extracts followed by immunoblotting of cohesin and regulators. Colored dots below the panels identify each sample. (C) Quantification of the amount of the indicated proteins co-immunoprecipitated with anti-SMC1, relative to the amount of RAD21, in these four samples. Gray dots often overlap with black dots. Source data are available online for this figure.
Figure EV1
Figure EV1. Generation and characterization of Ewing sarcoma cell lines with and without STAG2.
(A) Mutations generated by CRISPR/Cas9 editing in STAG2 gene. All clones were generated from a clone carrying an inducible Cas9 at the AAVS1 locus (STAG2 WT). (B) Immunoblot analysis of whole-cell extracts of parental (P) A673 cells and clones prepared in RIPA buffer. (C) A673 cells were mock transfected (control, siC) or transfected with siRNA against STAG2 (siSTAG2) and used for RNA-seq (3 replicates per condition, r1 to r3). Tubulin is used as loading control. (D) Immunoblot analysis of whole-cell extracts of Ewing sarcoma cells SK-N-MC and A4573 with and without STAG2, used for RNA-seq. A673 WT and STAG2 KO#2 were used for comparison. Tubulin as loading control. Parental (P) SK-N-MC cells express STAG2 while A4573 cells do not, and they were edited to generate STAG2 KO and KI clones, respectively, by CRISPR/Cas9 editing. Related to Fig. 1.
Figure EV2
Figure EV2. Contribution of 232 STAG2-dependent genes to survival.
Overall survival probability (expressed as percentage) of patients from two different cohorts according to the survival signature described in main text. Only data from primary tumors were used. P values calculated with Cox proportional hazards regression. Related to Fig. 2.
Figure EV3
Figure EV3. Genomic profiling in Ewing sarcoma cell lines.
(A) Heatmaps showing EWS::FLI1 binding in A673 cells, ordered according to number of GGAA repeats. Peak calling was performed after merging data from two studies (Data ref: Surdez et al, ; Data ref: Adane et al, 2021). All other heatmaps showing occupancy of EWS::FLI1 (EF), H3K27ac and p300 around these peaks in A673 and SK-N-MC cells expressing shGFP (+EF) or shEF (−EF) as well as in mesenchymal stem cells (MSC) transfected with empty vector (−EF) or the oncogene (+EF), use data from (Data ref: Riggi et al, 2014). (B) Heatmaps showing ChIP-seq read distribution of cohesin in STAG2 WT or STAG2 KO A673 cells within a 5-kb window. Sites are clustered based on the presence of CTCF. Cohesin and CTCF data from (Data ref: Surdez et al, 2021) and (Data ref: Adane et al, 2021), respectively. Related to Fig. 3.
Figure EV4
Figure EV4. Transcriptome similarities in STAG2 KO and PRC2 KO A673 cells.
(A) Scatterplot depicting changes in H3K27me3 at the promoter and gene expression in STAG2 KO cells compared to STAG2 proficient cells. (B) Immunoblot analysis of whole-cell extracts of A673 clones KO for PRC2 components EZH2 and SUZ12. MEK2 serves as loading control. (C) Scatterplots showing differentially expressed genes in A673 clones KO for PRC2 components EZH2 and SUZ12. Genes deregulated also in STAG2 KO cells (although not necessarily in the same direction) are colored in red. P values (P value-adj) were obtained using the DEseq2 package. (D) Comparison of genes significantly deregulated in PRC2 KO and STAG2 KO A673 cells in the same direction. Chi-square test was applied. Related to Fig. 5.
Figure EV5
Figure EV5. Changes in gene expression and protein abundance of cohesin subunits and regulators in A673 cells with and without STAG2.
(A) Changes in gene expression levels of cohesin subunits and regulators assessed by RNA-seq of STAG2 WT and KO A673 cells. Data taken from Dataset EV1A. Red and blue values correspond to significant up- and down-regulation, respectively (FDR < 0.05). (B) Immunoblot analysis of whole-cell extracts of parental (P) A673 cells and indicated clones prepared in RIPA buffer. Four gels were loaded to allow for immunoblotting with antibodies for cohesin subunits and regulators. The upper part of the figure is the same as in Fig. EV1B. Related to Fig. 7.

References

    1. Adane B, Alexe G, Seong BKA, Lu D, Hwang EE, Hnisz D, Lareau CA, Ross L, Lin S, Dela Cruz FS et al (2021) Gene Expression Omnibus GSE1165977 (Hi-ChIP) (https://www.ncbi.nlm.nih.gov/geo/query/acc.cgi?acc=GSE165977) [DATASET]
    1. Adane B, Alexe G, Seong BKA, Lu D, Hwang EE, Hnisz D, Lareau CA, Ross L, Lin S, Dela Cruz FS et al (2021) Gene Expression Omnibus GSE116495 (ChIP-seq) (https://www.ncbi.nlm.nih.gov/geo/query/acc.cgi?acc=GSE116495) [DATASET]
    1. Adane B, Alexe G, Seong BKA, Lu D, Hwang EE, Hnisz D, Lareau CA, Ross L, Lin S, Dela Cruz FS et al (2021) STAG2 loss rewires oncogenic and developmental programs to promote metastasis in Ewing sarcoma. Cancer Cell 39:827–844 - PMC - PubMed
    1. Alonso-Gil D, Cuadrado A, Giménez-Llorente D, Rodríguez-Corsino M, Losada A (2023) Different NIPBL requirements of cohesin-STAG1 and cohesin-STAG2. Nat Commun 14:1326 - PMC - PubMed
    1. Alonso-Gil D, Losada A (2023) Protocol to analyze chromatin-bound proteins through the cell cycle using Chromoflow flow cytometry. STAR Protoc 4:102568 - PMC - PubMed

MeSH terms