. 2024 Nov 1;21(1):283.
doi: 10.1186/s12974-024-03278-2.

Senolytic treatment diminishes microglia and decreases severity of experimental autoimmune encephalomyelitis

Affiliations

Senolytic treatment diminishes microglia and decreases severity of experimental autoimmune encephalomyelitis

Sienna S Drake et al. J Neuroinflammation. .

Abstract

Background: The role of senescence in disease contexts is complex, however there is considerable evidence that depletion of senescent cells improves outcomes in a variety of contexts particularly related to aging, cognition, and neurodegeneration. Much research has shown previously that inflammation can promote cellular senescence. Microglia are a central nervous system innate immune cell that undergo senescence with aging and during neurodegeneration. The contribution of senescent microglia to multiple sclerosis, an inflammatory neurodegenerative disease, is not clear, but microglia are strongly implicated in chronic active lesion pathology, tissue injury, and disease progression. Drugs that could specifically eliminate dysregulated microglia in multiple sclerosis are therefore of great interest to the field.

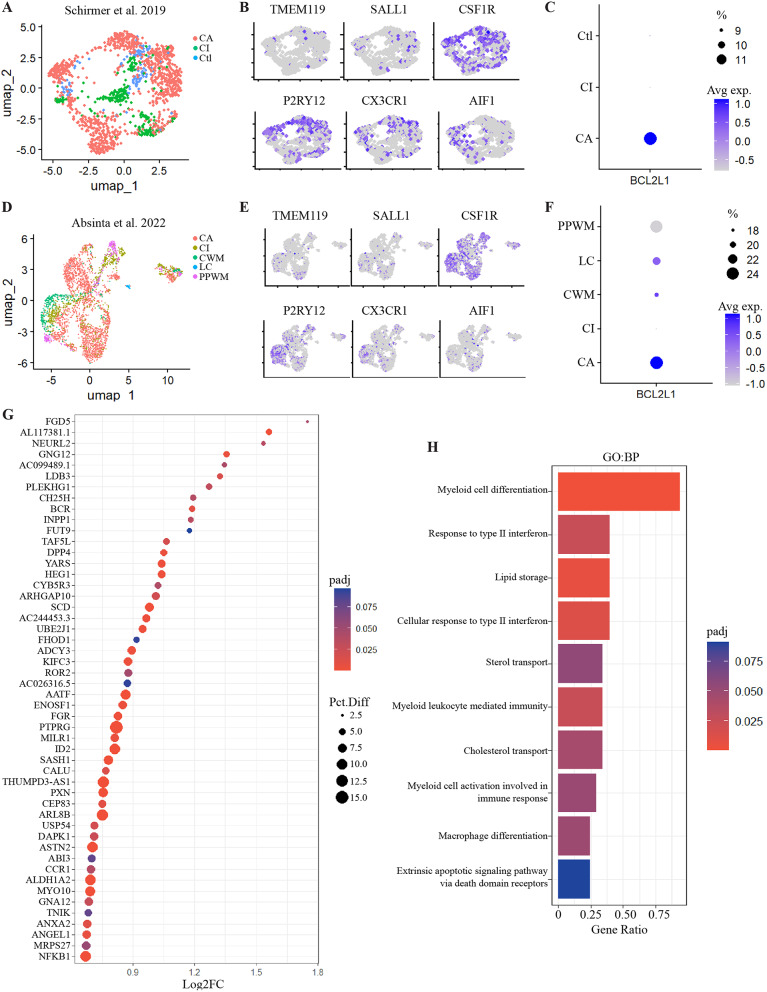
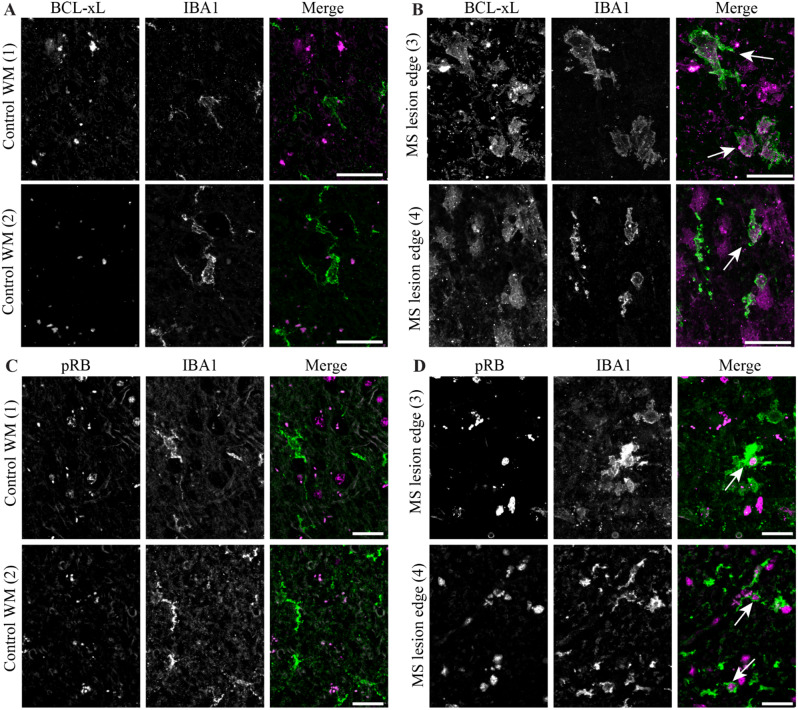
Results: A single-cell analysis of brain tissue from mice subjected to experimental autoimmune encephalomyelitis (EAE), a mouse model of CNS inflammation that models aspects of multiple sclerosis (MS), identified microglia with a strong transcriptional signature of senescence including the presence of BCL2-family gene transcripts. Microglia expressing Bcl2l1 had higher expression of pro-inflammatory and senescence associated genes than their Bcl2l1 negative counterparts in EAE, suggesting they may exacerbate inflammation. Notably, in human single-nucleus sequencing from MS, BCL2L1 positive microglia were enriched in lesions with active inflammatory pathology, and likewise demonstrated increased expression of immune genes suggesting they may be proinflammatory and contribute to disease processes in chronic active lesions. Employing a small molecule BCL2-family inhibitor, Navitoclax (ABT-263), significantly reduced the presence of microglia and macrophages in the EAE spinal cord, suggesting that these cells can be targeted by senolytic treatment. ABT-263 treatment had a profound effect on EAE mice: decreasing motor symptom severity, improving visual acuity, promoting neuronal survival, and decreasing white matter inflammation.

Conclusion: These results support the hypothesis that microglia and macrophages exhibit transcriptional features of cellular senescence in EAE and MS, and that microglia expressing Bcl2l1 demonstrate a proinflammatory signature that may exacerbate inflammation resulting in negative outcomes in neuroinflammatory disease. Depleting microglia and macrophages using a senolytic results in robust improvement in EAE disease severity, including across measures of neurodegeneration, inflammation, and demyelination, and may therefore represent a novel strategy to address disease progression in multiple sclerosis.

Keywords: Experimental autoimmune encephalomyelitis; Microglia; Multiple sclerosis; Neuroinflammation; Senescence; Senolytics; Senotherapeutic.


Conflict of interest statement

The authors declare no competing interests.

Figures

Fig. 1
Fig. 1
Single-cell RNA-seq of EAE microglia implicates senescence and identifies inflammatory subpopulation expressing ABT-263 targets. A-E) Microglial cells from Fournier et al. 2023 from EAE and Control mice, as confirmed by expression in the cluster of microglial specific genes Aif1 (B), P2ry12 (C), Csf1r (D), and Cx3cr1 (E). F) Kegg pathway enrichment for genes upregulated in EAE microglial demonstrates an enrichment for immune signaling pathways, cellular senescence, and neurodegenerative diseases. G) Percent of EAE microglia expressing various targets of ABT-263 and log2FC between EAE and control microglia. H) Top 20 upregulated genes in Bcl2l1 positive EAE microglia compared to Bcl2l1 negative EAE microglia, colour represents the difference in % positive cells between Bcl2l1 + population and Bcl2l1- population. I) Genes belonging to the SenMayo dataset significantly dysregulated (p < 0.05) in EAE vs. Control microglia (n = 47 genes, up = 42,down = 5, gene labels removed for clarity of figure). J) Significant dysregulation (p < 0.05) of genes from the 47 SenMayo genes dysregulated in EAE in Bcl2l1 positive EAE microglia, colour represents the difference in % positive cells between Bcl2l1 + and Bcl2l1- populations, positive number/red indicates higher percent positive cells in Bcl2l1 + population, negative number/blue indicates higher percent positive cells in Bcl2l1- population (n = 29 genes, Log2FC up = 28, Log2FC down = 1). K) GO biological process pathway enrichment for significantly upregulated genes (padj < 0.1, log2FC > 0) in Bcl2l1 positive EAE microglia
Fig. 2
Fig. 2
Single-nucleus RNA-seq of human MS microglia demonstrate enrichment for BCL2L1 genes in chronic active lesions and dysregulation of immune genes in BCL2L1 + cells. (A) Microglia from Schirmer et al. 2019 clustered based on microglial annotation accompanying the original published manuscript across control samples (Ctl), MS tissue with chronic active lesion pathology (CA) and chronic inactive lesion pathology (CI). (B) Microglial marker gene expression in the microglia annotated cluster. (C) Expression and percent cells expressing BCL2L1 across different conditions. (D) Microglia from Absinta et al. 2022, obtained from ‘immune’ annotation cluster 7 across different lesion pathologies including chronic active lesion edge (CA), chronic inactive lesion edge (CI), lesion core (LC), control non-lesion white matter (CWM), and periplaque white matter (PPWM). (E) Microglial marker gene expression in cells from (D). (F) Expression and percent cells expressing BCL2L1 across the different lesion classifications in cells from (D). (G) Visualization of top 50 upregulated genes (padj < 0.1, log2FC > 0) ordered by log2FC in BCL2L1 + microglia from the data in (D). (H) Significantly enriched GO terms from genes upregulated (padj < 0.1, log2FC > 0) in BCL2L1 + microglia
Fig. 3
Fig. 3
Immunohistochemistry of MS lesions reveals BCL-xL + and pRB + microglia. (A) IBA1 + microglia in control white matter (tissue samples 1 and 2) do not co-label with BCL-xL. (B) IBA1 + microglia in MS chronic active lesions from two separate patients (tissue samples 3 and 4) co-label with BCL-xL in some cells. (C) IBA1 and pRB labeling in control white matter do not label the same cells. (D) IBA1 and pRB labeling in chronic active MS lesion tissue reveals overlap of the signals. Arrows drawn to indicate double positive cells. Scale bars = 20 μm
Fig. 4
Fig. 4
ABT-263 treatment decreases proportion of microglia in spinal cord. A) Experimental design demonstrating induction of EAE followed by ABT-263 treatment at symptom onset and spinal cord flow cytometry at 18 d.p.i., and at least 4 days post-treatment start. B-D) Cell gating parameters for evaluation of viable single cell population. E) Gating strategy for isolating CD45-Cd11b- cells (R1) from CD45 + cells (R2). F) Division of R2 into three cell subsets, consisting of CD45 high Cd11b positive innate immune cells (R3), CD45 mid Cd11b positive microglia (R4) and CD45 + Cd11b- lymphocytes (R5). G) Division of R3 by Ly6C and Ly6G fluorescence to differentiate monocytes/macrophages (Ly6C-Ly6G-) from other innate immune cells (Ly6C + proinflammatory monocytes, and Ly6G + neutrophils). H) Division of microglial population based on Ly6C and Ly6G positivity demonstrating most cells (> 85%) in the R4 microglial population are negative for both. I) Division of the R5 lymphocyte population by CD4 and CD8 positivity. J) Quantification of the percent of viable cells within the innate immune cell population (R3 + R4) population demonstrating a significant decrease in population in ABT-263 treated animals. K-M) Division of the R3 population (CD45 high Cd11b+) based on Ly6G (K) and Ly6C (L) positivity, and the R3 population negative for both (M), demonstrating significant decrease only in the Ly6G and Ly6C negative population. N) Evaluation of the microglial subset in vehicle treated and ABT-263 treated mice as a percent of total viable cells, demonstrating a significant decrease in treated mice in both the whole population. O-Q) Analysis of the R5 lymphocyte population (O) based on subdivision of CD4 (P) and CD8 (Q) positivity showing no change in the number of CD4 + or CD8 + lymphocytes present in the spinal cords. * < 0.05, all comparison’s conducted with one-tailed unpaired t-test, vehicle n = 3, ABT-263 n = 4
Fig. 5
Fig. 5
ABT-263 treatment from disease onset reduces severity, inflammation, promotes neuronal survival. (A) Experimental design demonstrating induction of EAE followed by ABT-263 treatment at symptom onset, optomotor testing at peak disease, and tissue collection at 18 days post induction (d.p.i.). (B) EAE score from day starting ABT-263 or vehicle treatment, data are combined numbers from two separate EAE cohorts. Bars = SEM. Two-way Anova with Sidak’s multiple comparison’s test with adjusted pvalues, * < 0.05, ** < 0.01. (C) Weight calculated as difference from baseline of day before symptom onset/treatment start (day 0). Bars = SEM. Two-way Anova with Sidak’s multiple comparison’s test with adjusted pvalues, * < 0.05. (D) Optomotor response data for right and left eyes of EAE mice at peak treated with either vehicle or ABT-263 for at least 3 days prior to evaluation. 3 stripe sizes were tested (0.3 c/d, 0.35 c/d, and 0.4 c/d) and data were binned into two groups no response (n.r.)/0.3 and 0.35/0.4. Number in pie slices represents % of responses in that category. Binomial test for observed versus expected distribution. E, F) Thresholded images of EAE optic nerves from vehicle treated (E) or ABT-263 treated (F) mice labeled with IBA1 (red) and Hoechst (white). Scale bar = 250 μm. G) Quantification of the percent area of optic nerve positive for Hoescht dye from thresholded images. Error bars = SD, two-tailed unpaired t-test. H) Quantification of the percent area of optic nerve positive for IBA1 immunostaining from thresholded images. Error bars = SD. Two-tailed unpaired t-test. I, J) Thresholded images of EAE optic nerves from vehicle treated (I) or ABT-263 treated (J) mice labeled with fluoromyelin (FM-red) and Hoechst (white). Scale bar = 250 μm. K) Quantification of the percent area of optic nerve positive for Fluoromyelin dye from thresholded images. Error bars = SD, one-tailed Welch’s t-test. L, M) Representative images of flatmount retinas labeled with RGC marker BRN3A in vehicle treated (L) and ABT-263 treated (M) EAE mice. Scale = 50 μm. N) Quantification of BRN3A positive cells per area in retinas from vehicle or ABT-263 treated mice. Bars = SD. Two-tailed unpaired t-test. O,P) Representative images of EAE optic nerves labeled with IBA1 and BCL-xL from control and ABT-263 treated animals. Scale bar = 200 μm. Q) Fluorescence intensity of BCL-xL in IBA1 + area. R) Fluorescence intensity of BCL-xL in the entire optic nerve area. Error bars = SD, two-tailed unpaired t-test performed. For E-R, * = pval < 0.05, ** = pval < 0.01, and *** = pval < 0.001
Fig. 6
Fig. 6
Hypothesis for effectiveness of ABT-263 in EAE. Initial inflammatory insult and injury induces microglia to undergo reactivity and gliosis and may induce senescence in a subset of microglia (2). Senescent microglia may secrete more proinflammatory factors like TNFα, exacerbating local inflammatory activity (3a, top). Treatment with ABT-263 may induce apoptosis in the subset of senescent, proinflammatory microglia and macrophages, reducing the secretion of inflammatory factors into the local milieu, and therefore limiting further inflammatory activity (3b, bottom)

References

    1. Filippi M, et al. Multiple sclerosis. Nat Reviews: Disease Primers. 2018;4. 10.1038/s41572-018-0041-4. - PubMed
    1. Drake SS, Zaman A, Simas T, Fournier AE. Comparing RNA-sequencing datasets from astrocytes, oligodendrocytes, and microglia in multiple sclerosis identifies novel dysregulated genes relevant to inflammation and myelination. WIREs Mech Dis. 2023;15:e1594. 10.1002/wsbm.1594. - PubMed
    1. Bagnato F, et al. Imaging chronic active lesions in multiple sclerosis: a consensus statement. Brain. 2024. 10.1093/brain/awae013. - PMC - PubMed
    1. Yong VW. Microglia in multiple sclerosis: protectors turn destroyers. Neuron. 2022;110:3534–48. 10.1016/j.neuron.2022.06.023. - PubMed
    1. Kuhlmann T, et al. Multiple sclerosis progression: time for a new mechanism-driven framework. Lancet Neurol. 2023;22:78–88. 10.1016/s1474-4422(22)00289-7. - PMC - PubMed

MeSH terms