. 2025 Jan;14(1):e2402302.
doi: 10.1002/adhm.202402302. Epub 2024 Nov 1.

Bioprinting of Aptamer-Based Programmable Bioinks to Modulate Multiscale Microvascular Morphogenesis in 4D

Affiliations

Bioprinting of Aptamer-Based Programmable Bioinks to Modulate Multiscale Microvascular Morphogenesis in 4D

Deepti Rana et al. Adv Healthc Mater. 2025 Jan.

Abstract

Dynamic growth factor presentation influences how individual endothelial cells assemble into complex vascular networks. Here, programmable bioinks are developed that facilitate dynamic vascular endothelial growth factor (VEGF) presentation to guide vascular morphogenesis within 3D-bioprinted constructs. Aptamer's high affinity is leveraged for rapid VEGF sequestration in spatially confined regions and utilized aptamer-complementary sequence (CS) hybridization to tune VEGF release kinetics temporally, days after bioprinting. It is shown that spatial resolution of programmable bioink, combined with CS-triggered VEGF release, significantly influences the alignment, organization, and morphogenesis of microvascular networks in bioprinted constructs. The presence of aptamer-tethered VEGF and the generation of instantaneous VEGF gradients upon CS-triggering restricted hierarchical network formation to the printed aptamer regions at all spatial resolutions. Network properties improved as the spatial resolution decreased, with low-resolution designs yielding the highest network properties. Specifically, CS-treated low-resolution designs exhibited significant vascular network remodeling, with an increase in vessel density(1.35-fold), branching density(1.54-fold), and average vessel length(2.19-fold) compared to non-treated samples. The results suggest that CS acts as an external trigger capable of inducing time-controlled changes in network organization and alignment on-demand within spatially localized regions of a bioprinted construct. It is envisioned that these programmable bioinks will open new opportunities for bioengineering functional, hierarchically self-organized vascular networks within engineered tissues.

Keywords: 3D‐bioprinting; aptamers; dynamic growth factors presentation; programmable bioinks; tissue engineering; vascular endothelial growth factor; vascularization.


Conflict of interest statement

The authors declare no conflict of interest.

Figures
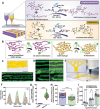
Figure 1
Figure 1
Aptamer‐functionalized Programmable Bioink. A) Schematic representation of aptamer‐functionalized programmable bioinks that leverages affinity interaction for controlling GF's triggered release, alongside pristine GelMA bioink. Upon visible‐light exposure, the bioinks with Ru/SPS photocrosslinks the bioprinted constructs. B–D) To validate aptamer retention and aptamer‐CS hybridization post‐bioprinting, the constructs were incubated with CSF at 37 °C for 24 h. The aptamers present in programmable bioink hybridize with CSF, imparting stable fluorescence, whereas, in GelMA regions, the CSF diffuses out of the matrix. (C) Top: Macroscopic photograph of 3D‐bioprinted line design. The scale bar is 5mm. Bottom: Fluorescent microscope stitched image of CSF‐incubated bioprinted design (high‐resolution) using programmable and GelMA bioinks, (D) at 10x magnification. The scale bar is 500 µm. E) Macroscopic photograph of 3D‐bioprinted vascular tree design using programmable bioink. The inset scale bar is 5mm. The CSF‐incubated high‐resolution designs after 24 hrs were analyzed using two individual samples (N1 and N2), represented as different colors within the same group, for (F, G) fluorescence intensity and (H, I) printed line width. F) Fluorescence intensity as a function of distance within bioprinted samples, confirms the design consistency. G) Fluorescence intensity and (H) printed line width among both, aptamer and GelMA regions of the printed construct. The representative microscopic images used for the analysis are shown in (D). I) 3D‐bioprinted line/region width comparison among varying spatial resolution designs (high, medium, and low). The data is represented as (G) box plot with min to max range whiskers and (H,I) as mean ± SD with scattered dot plot for two experimental replicates (N1 and N2). Statistical significance for (G) and (H) was determined using Welch's two‐tailed t‐test, with **** p < 0.0001. For (I), two‐way ANOVA with Tukey's multiple comparisons test was performed, with alpha set at 0.05. **** p < 0.0001 indicates significance while “ns” denotes not significant.
Figure 2
Figure 2
Rheological analysis of the programmable bioink. Rheological analysis of pristine GelMA, GelMA with blue microbeads, and aptamer‐based programmable bioinks. The storage modulus (filled symbols) and loss modulus (open symbols) of the respective bioinks are shown as (A) strain amplitude sweep at a fixed frequency of 1 Hz, and (B) frequency sweep within the linear viscoelastic range at fixed strain % of 0.1. C) Storage modulus of all bioinks at a fixed frequency of 1Hz. The data is represented as mean ± SD with one experimental replicate. The statistical analysis was performed using one‐way ANOVA with Dunnett's multiple comparison test, where alpha is fixed at 0.05 with **** p≤0.0001. D) Complex viscosity versus frequency plots highlights the shear thinning (decreased viscosity with continuously increasing frequency, 0–10 Hz) behavior of all bioinks. E) Time sweep measurement of the bioinks performed at room temperature (25 °C) shows the change in storage and loss modulus upon visible light exposure resulting in polymer crosslinking (indicated with an arrow). The inset graph with zoomed data plots displays the difference in storage modulus among GelMA‐ and programmable bioinks with the onset of cross‐linking.
Figure 3
Figure 3
Computational analysis of free VEGF distribution among high, medium, and low‐spatial resolution 3D‐bioprinted designs in 4D. The (A) 2D and (B) 3D surface plot of free VEGF diffusion from the high (aptamer) to low VEGF concentration regions (GelMA) upon triggered release in the presence (or absence) of CS at different timepoints (t = 0, 24 and 144 h). The dimensions of each rectangle among all designs are 400 µm (w) x 8 mm (l). C) Free VEGF concentration graph as a function of distance across the construct, displaying aptamer and GelMA regions at 0, 12, 24, and 144 h of high, medium and low‐resolution designs. D) Normalized free VEGF concentration% bar graph displaying changes in free VEGF concentrations in both regions over time.
Figure 4
Figure 4
Programmable VEGF bioavailability within bioprinted constructs selectively guides cell behavior in 4D. A,B) The concept of cell‐laden programmable bioinks, (i) where aptamer‐based programmable bioinks and GelMA bioinks are 3D‐bioprinted. (ii) Aptamers facilitate VEGF sequestration from the culture medium to the specific regions in the construct and, (iii) provide programmable VEGF release in the presence of CSF, (iv) resulting spatial VEGF gradients within the constructs that guides cell alignment selectively depending on the gradient steepness. C) F‐actin (cell cytoskeleton, red) and Hoechst (nuclei, blue) stained bioprinted samples in the presence/absence of CSF (added on day 4) on the day 5 of culture. The green color corresponds to the presence of CSF hybridized within aptamer regions. The scale bar is 500 µm(top row) and 100 µm(magnified regions), respectively. Cellular characteristics such as (D) alignment, (E)aspect ratio, and (F) cell area in aptamer and GelMA regions of the bioprinted samples on day 5 were quantified using ImageJ. D) Polar plots representing the cellular alignment (θ) and their related frequency % (r) on day 5 among both regions of bioprinted construct, binned in 30° increments in the presence/absence of CSF (added on day 4). The data in (E) and (F) is represented as box plots with min to max range whiskers, where “+” denotes mean (n = 6, technical replicates). The statistical analysis was performed using two‐way ANOVA, with Tukey's multiple comparisons tests, where alpha is fixed at 0.05 with * p = 0.0176 in (F); * p = 0.0446, and ** p = 0.0029 in (E). The term “ns” denotes not significant.
Figure 5
Figure 5
Spatial resolution of programmable bioinks, combined with CS triggering influences printed cell's characteristics and alignment in a time‐controlled manner. A) Fluorescent microscopic images of F‐actin (red)‐stained bioprinted designs (high, medium, and low spatial resolution) in the presence/absence of CS on day 5 and day 10. Blue color corresponds to the microbeads within GelMA regions. The scale bars are 500µ m and 100µm. Cell properties such as area, aspect ratio, and alignment on day 5 and day 10 for (B, C) high, (D, E) medium, and (F, G) low‐resolution designs, respectively. The cell area and AR data are presented as mean ± SD with scatter data plot. The statistical significance was calculated using two‐way ANOVA with Tukey's multiple comparison tests where * p < 0.05, ** p < 0.01, *** p < 0.001, **** p < 0.0001, and ns stands for not significant. The cell alignment data is represented as a polar plot where cell orientation angle (θ) and frequency % (r) binned in 30° increments, are shown (n = 6, technical replicates).
Figure 6
Figure 6
Spatial resolution of programmable bioink combined with CS triggering modulates vascular network self‐organization over time. A) Schematic illustrating high, medium, and low‐spatial resolution bioprinted designs. Confocal z‐stacks of all designs, in the presence/absence of CS (added on day 4) on day 5 and day 10, showing the interface between aptamer and GelMA regions. Blue color corresponds to fluorescent microbeads present within GelMA region. Immunostained samples for cytoskeletal F‐actin (red) and EC specific CD31 marker (green). The scale bar is 100 µm. (B) Normalized CD31+ fluorescence intensity over interface region (dotted line) in the presence/absence of CS at different time points denoted as D5+CS, D5‐CS, D10+CS, and D10‐CS for all designs. (C) CD31+ vascular network properties within aptamer regions of all designs over varying spatial resolutions on day 5 and day 10. High resolution corresponds to 340 µm, medium resolution to 1230 µm, and low resolution to 2014 µm of aptamer region's width. The data is represented as mean ± SD with individual data points (n = 6, technical replicates). The statistical significance was calculated using two‐way ANOVA with Tukey's multiple comparisons tests where * p < 0.05, ** p < 0.01, *** p < 0.001, **** p < 0.0001 and ns stands for not significant.
Figure 7
Figure 7
Spatiotemporal localization of aptamer‐tethered VEGF in 3D‐bioprinted programmable bioink controls endothelial cell morphogenesis confined within aptamer regions. A) Confocal z‐stacks showing cell cytoskeletal F‐actin (red) and EC specific CD31 (green) expression in 3D‐bioprinted designs (high, medium, and low‐resolution) in the presence/absence of CS (added on day 4) on day 5 and day 10. Blue color corresponds to fluorescent microbeads present in GelMA region. The scale bar is 100 µm. B) CD31+ vascular network properties in both aptamer and GelMA regions of each design (in the presence/absence of CS) on day 5 and day 10. The data is represented as box plots with min to max range whiskers, where “+” denotes mean and the line denotes median (n = 6, technical replicates). The statistical significance was calculated using two‐way ANOVA with Tukey's multiple comparisons tests where * p < 0.05, ** p < 0.01, *** p < 0.001, **** p < 0.0001, and ns stands for not significant.
Figure 8
Figure 8
3D‐bioprinted vascular tree design using programmable bioink. A) Stitched fluorescent image of 3D‐bioprinted vascular tree design using programmable bioink. The scale bar is 10mm. For comparative analysis, the design was categorized into three distinct regions depending on their printed line widths, that is, high (<430 µm), medium (800–900 µm), and low‐resolution (>1140 µm). B) Printed line width quantification using two individual bioprinted samples, which were then used for ± CS studies. C) Confocal z‐stacks stitched mosaics of design without CS treatment on day 10. The scale bars are marked in the individual mosaics. The designs were immunostained for CD31 expression (green), cell cytoskeletal F‐actin (red), and nuclei (blue). D) Confocal z‐stacks showing different spatial resolution regions among designs treated with/without CS (added on day 4) on day 10. The scale bar is 100 µm. E) Vascular network properties as a function of spatial resolution among CS treated/ non‐treated samples on day 10. The data is represented as a violin plot with a median (middle thick line) and interquartile range (horizontal lines) (n = 6, technical replicates). The statistical significance was calculated using two‐way ANOVA with Tukey's multiple comparisons test where * p < 0.05, ** p < 0.01, *** p < 0.001, **** p < 0.0001, and ns stands for not significant.

Similar articles

Cited by

References

    1. Rouwkema J., Khademhosseini A., Trends Biotechnol. 2016, 34, 733. - PubMed
    1. Margolis E. A., Friend N. E., Rolle M. W., Alsberg E., Putnam A. J., Trends Biotechnol. 2023, 41, 1400. - PMC - PubMed
    1. Mirabella T., Macarthur J. W., Cheng D., Ozaki C. K., Woo Y. J., Yang M. T., Chen C. S., Nat. Biomed. Eng. 2017, 1, 0083. - PMC - PubMed
    1. Debbi L., Zohar B., Shuhmaher M., Shandalov Y., Goldfracht I., Levenberg S., Biomaterials 2022, 280, 121286. - PubMed
    1. Szklanny A. A., Machour M., Redenski I., Chochola V., Goldfracht I., Kaplan B., Epshtein M., Simaan Yameen H., Merdler U., Feinberg A., Seliktar D., Korin N., Jaros J., Levenberg S., Adv. Mater. 2021, 33, 2102661. - PMC - PubMed

MeSH terms

Substances

LinkOut - more resources