Randomized Controlled Trial
. 2024 Nov 2;38(1):11.
doi: 10.1007/s10548-024-01088-6.

Transcutaneous Auricular Vagus Nerve Stimulation for Visually Induced Motion Sickness: An eLORETA Study

Affiliations
Randomized Controlled Trial

Transcutaneous Auricular Vagus Nerve Stimulation for Visually Induced Motion Sickness: An eLORETA Study

Emmanuel Molefi et al. Brain Topogr. .

Abstract

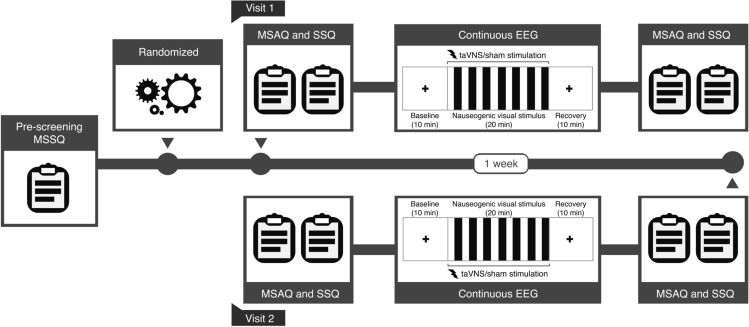
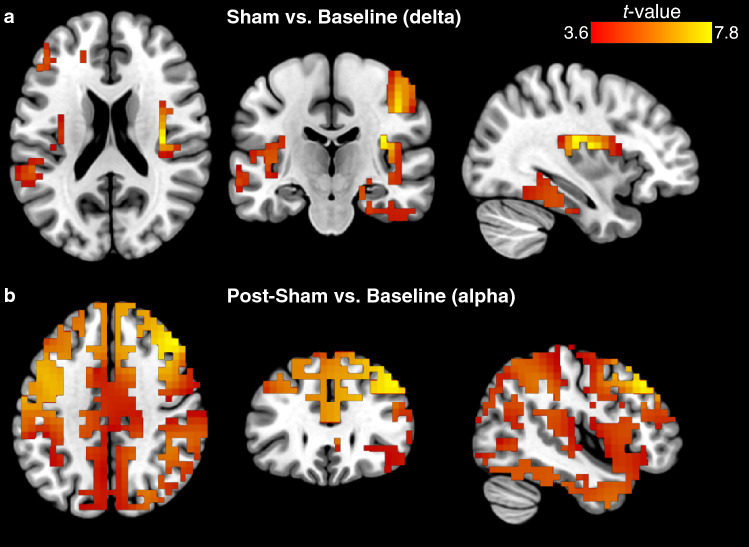
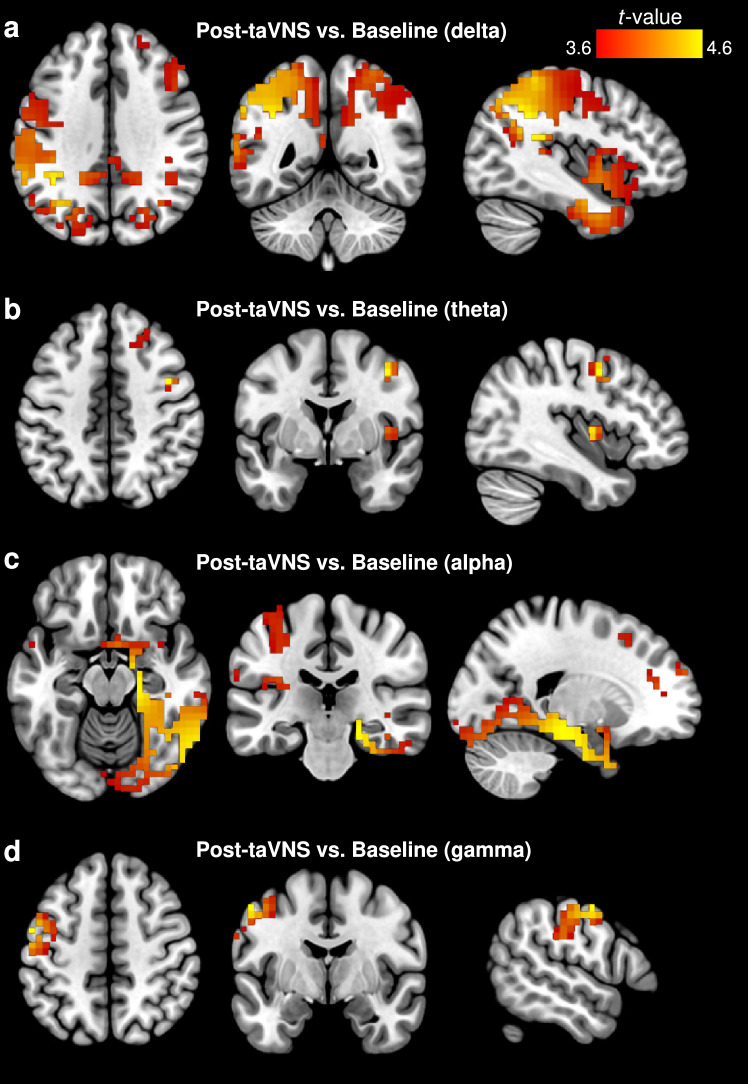
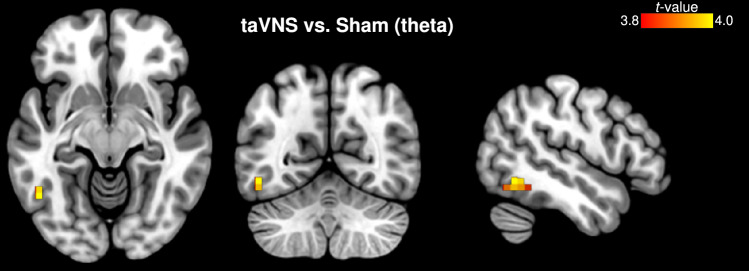
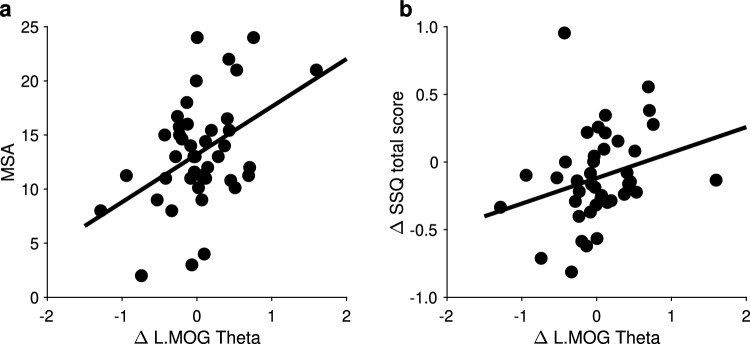
Transcutaneous auricular vagus nerve stimulation (taVNS), a non-invasive form of electrical brain stimulation, has shown potent therapeutic potential for a wide spectrum of conditions. How taVNS influences the characterization of motion sickness - a long mysterious syndrome with a polysymptomatic onset - remains unclear. Here, to examine taVNS-induced effects on brain function in response to motion-induced nausea, 64-channel electroencephalography (EEG) recordings from 42 healthy participants were analyzed; collected during nauseogenic visual stimulation concurrent with taVNS administration, in a crossover randomized sham-controlled study. Cortical neuronal generators were estimated from the obtained EEG using exact low-resolution brain electromagnetic tomography (eLORETA). While both sham and taVNS increased insula activation during electrical stimulation, compared to baseline, taVNS additionally augmented middle frontal gyrus neuronal activity. Following taVNS, brain regions including the supramarginal, parahippocampal, and precentral gyri were activated. Contrasting sham, taVNS markedly increased activity in the middle occipital gyrus during stimulation. A repeated-measures ANOVA showed that taVNS reduced motion sickness symptoms. This reduction in symptoms correlated with taVNS-induced neural activation. Our findings provide new insights into taVNS-induced brain changes, during and after nauseogenic stimuli exposure, including accompanying behavioral response. Together, these findings suggest that taVNS has promise as an effective neurostimulation tool for motion sickness management.

Keywords: Electroencephalography; Motion sickness; Source localization; Transcutaneous auricular vagus nerve stimulation; eLORETA.


Conflict of interest statement

The authors declare that they have no Conflict of interest.

Figures

Fig. 1
Fig. 1
Experimental design and timeline schematics. Participants underwent a pre-screening process which included completion of the motion sickness susceptibility questionnaire (MSSQ). Thereafter, participants were randomized to receive sham or taVNS for their first visit (Visit 1), then receive opposite treatment at 1-week follow-up (Visit 2). On the day of the experiment, participants completed a pre and post motion sickness assessment questionnaire (MSAQ) and simulator sickness questionnaire (SSQ); additionally, participants underwent a baseline period, followed by nauseogenic visual stimulation in synchrony with electrical stimulation, then a recovery period, while electroencephalogram (EEG) signals were recorded
Fig. 2
Fig. 2
(a) Box plot showing MSSQ-Short raw scores of MSA and MSB for all participants. Solid lines indicate mean; dashed lines indicate median. (b) Spearman correlation between MSA and MSB where each data point represents a participant (Spearman ρ = 0.35). MSSQ, motion sickness susceptibility questionnaire; MSA, below 12 years of age MSSQ scores; MSB, over the last 10 years MSSQ scores
Fig. 3
Fig. 3
eLORETA of Sham versus Baseline, and Post-Sham versus Baseline contrasts. (a) Changes in estimated source activity (delta) between Sham (i.e., during stimulation period) and Baseline were identified in the right insula (BA 13, peak MNIx,y,z= 35 -20 20, t = 7.83). (b) Estimated source activity (alpha) differences between Post-Sham and Baseline were identified at the right middle frontal gyrus (BA 9, peak MNIx,y,z= 45 30 40, t = 5.70). Slice views of source locations from left to right are axial, coronal, and sagittal images; viewed from top, back, and right. In all of the images, the left side of the brain is shown on the left. BA, Brodmann area
Fig. 4
Fig. 4
eLORETA of taVNS versus Baseline contrast. (a) Differential estimated source activity (delta) at the right insula (BA 13, peak MNIx,y,z= 35 -20 15, t = 5.96). (b) Changes in source activity (theta) observed at the left middle frontal gyrus (BA 46, peak MNIx,y,z= -45 35 20, t = 5.47). Slice views of source locations from left to right are axial, coronal, and sagittal images; viewed from top, back, and right. In all of the images, the left side of the brain is shown on the left. BA, Brodmann area
Fig. 5
Fig. 5
eLORETA of active Post-taVNS versus Baseline contrast. (a) Following taVNS, increased estimated source activity was observed at the supramarginal gyrus (BA 40, peak MNIx,y,z= -40 -50 35, t = 4.53) for delta, (b) the middle frontal gyrus (BA 6, peak MNIx,y,z= 40 0 45, t = 3.84) for theta, (c) the parahippocampal gyrus (BA 35, peak MNIx,y,z= 20 -25 -15, t = 4.62) for alpha, (d) and the precentral gyrus (BA 6, peak MNIx,y,z= -55 -5 50, t = 3.98) for gamma. Slice views of source locations from left to right are axial, coronal, and sagittal images; viewed from top, back, and right. In all of the images, the left side of the brain is shown on the left. taVNS, transcutaneous auricular vagus nerve stimulation; BA, Brodmann area
Fig. 6
Fig. 6
eLORETA of active taVNS versus Sham contrast. Differential source activity of theta oscillation was observed at the left middle occipital gyrus (BA 19, peak MNIx,y,z= -50 -60 -10, t = 3.97). Slice views of source locations from left to right are axial, coronal, and sagittal images; viewed from top, back, and right. In all of the images, the left side of the brain is shown on the left. taVNS, transcutaneous auricular vagus nerve stimulation; BA, Brodmann area
Fig. 7
Fig. 7
(a) Scatter plots show that the change in activation of the left middle occipital gyrus (L.MOG) between sham and taVNS stimulation was positively associated with MSA responses (Pearson r =0.43), (b) and correlated with the change in SSQ total scores (Spearman ρ =0.35). MSSQ, motion sickness susceptibility questionnaire; MSA, below 12 years of age MSSQ scores; SSQ, simulator sickness questionnaire

References

    1. Angelaki DE, Cullen KE (2008) Vestibular System: The Many Facets of a Multimodal Sense. Annu. Rev. Neurosci. 31(1):125–150 - PubMed
    1. Adelhöfer N, Gohil K, Passow S, Beste C, Li S-C (2019) Lateral prefrontal anodal transcranial direct current stimulation augments resolution of auditory perceptual-attentional conflicts. NeuroImage 199:217–227 - PubMed
    1. Astafiev SV, Stanley CM, Shulman GL, Corbetta M (2004) Extrastriate body area in human occipital cortex responds to the performance of motor actions. Nature Neuroscience 7(5):542–548 - PubMed
    1. Butt MF, Albusoda A, Farmer AD, Aziz Q (2020) The anatomical basis for transcutaneous auricular vagus nerve stimulation. Journal of Anatomy 236(4):588–611 - PMC - PubMed
    1. Bos JE, Bles W (2004) Motion sickness induced by optokinetic drums. Aviation, Space, and Environmental Medicine 75(2):172–174 - PubMed

Publication types

LinkOut - more resources