

The 2024 report of the Lancet Countdown on health and climate change: facing record-breaking threats from delayed action
- PMID: 39488222
- PMCID: PMC7616816
- DOI: 10.1016/S0140-6736(24)01822-1
The 2024 report of the Lancet Countdown on health and climate change: facing record-breaking threats from delayed action
Abstract
Despite the initial hope inspired by the 2015 Paris Agreement, the world is now dangerously close to breaching its target of limiting global multiyear mean heating to 1·5°C. Annual mean surface temperature reached a record high of 1·45°C above the pre-industrial baseline in 2023, and new temperature highs were recorded throughout 2024. The resulting climatic extremes are increasingly claiming lives and livelihoods worldwide.
The Lancet Countdown: tracking progress on health and climate change was established the same year the Paris Agreement entered into force, to monitor the health impacts and opportunities of the world’s response to this landmark agreement. Supported through strategic core funding from Wellcome, the collaboration brings together over 300 multidisciplinary researchers and health professionals from around the world to take stock annually of the evolving links between health and climate change at global, regional, and national levels.
The 2024 report of the Lancet Countdown, building on the expertise of 122 leading researchers from UN agencies and academic institutions worldwide, reveals the most concerning findings yet in the collaboration’s 8 years of monitoring.
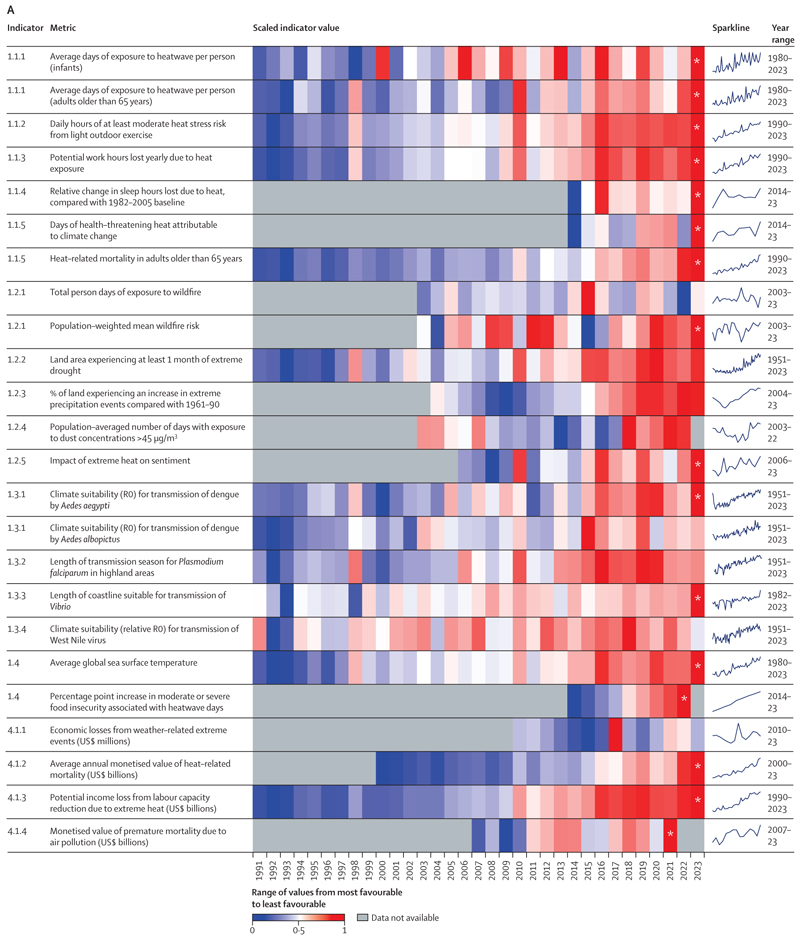
The record-breaking human costs of climate change: Data in this year’s report show that people all around the world are facing record-breaking threats to their wellbeing, health, and survival from the rapidly changing climate. Of the 15 indicators monitoring climate change-related health hazards, exposures, and impacts, ten reached concerning new records in their most recent year of data.
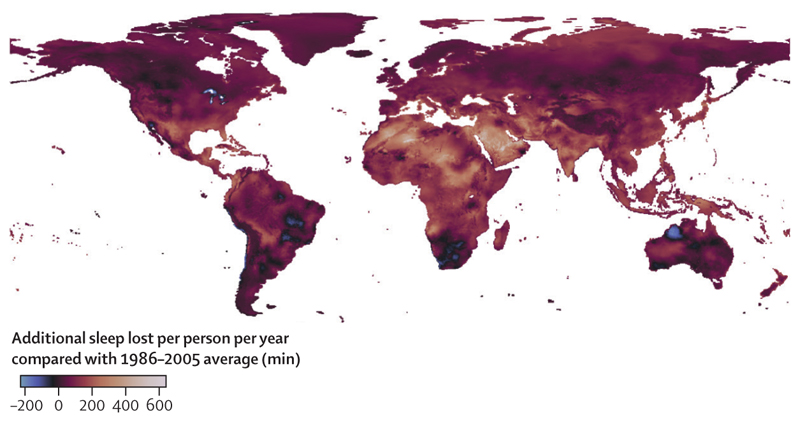
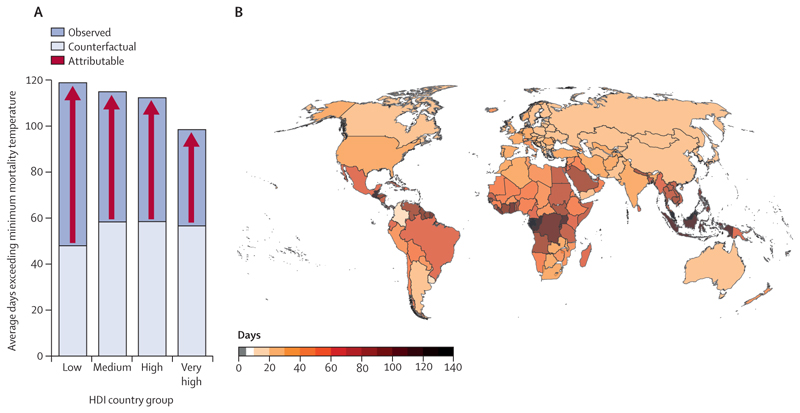
Heat-related mortality of people older than 65 years increased by a record-breaking 167%, compared with the 1990s, 102 percentage points higher than the 65% that would have been expected without temperature rise (indicator 1.1.5). Heat exposure is also increasingly affecting physical activity and sleep quality, in turn affecting physical and mental health. In 2023, heat exposure put people engaging in outdoor physical activity at risk of heat stress (moderate or higher) for a record high of 27·7% more hours than on average in the 1990s (indicator 1.1.2) and led to a record 6% more hours of sleep lost in 2023 than the average during 1986–2005 (indicator 1.1.4).
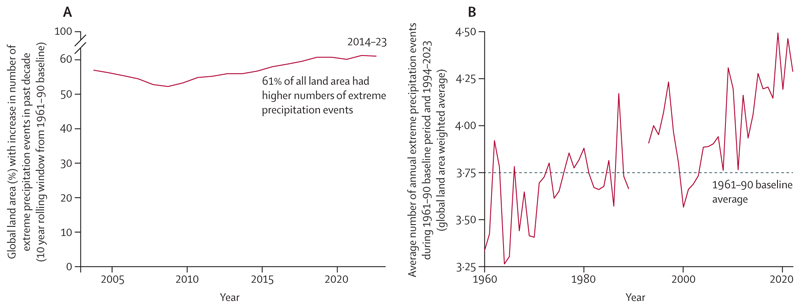
People worldwide are also increasingly at risk from life-threatening extreme weather events. Between 1961–90 and 2014–23, 61% of the global land area saw an increase in the number of days of extreme precipitation (indicator 1.2.3), which in turn increases the risk of flooding, infectious disease spread, and water contamination. In parallel, 48% of the global land area was affected by at least 1 month of extreme drought in 2023, the second largest affected area since 1951 (indicator 1.2.2). The increase in drought and heatwave events since 1981–2010 was, in turn, associated with 151 million more people experiencing moderate or severe food insecurity across 124 countries assessed in 2022, the highest recorded value (indicator 1.4.2).
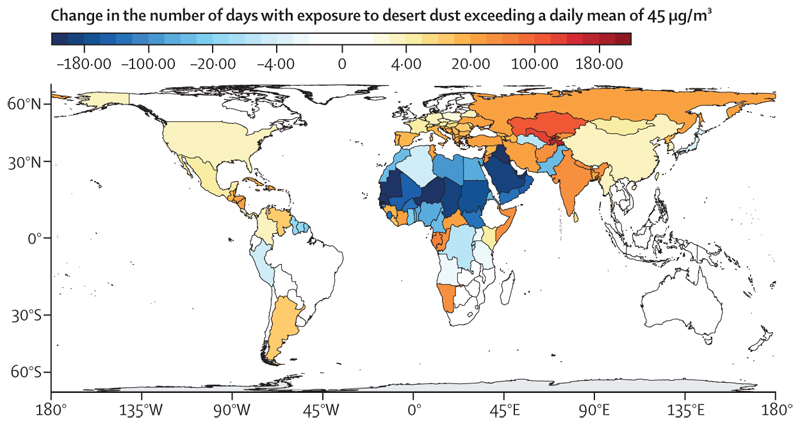
The hotter and drier weather conditions are increasingly favouring the occurrence of sand and dust storms. This weather-environmental phenomenon contributed to a 31% increase in the number of people exposed to dangerously high particulate matter concentrations between 2003–07 and 2018–22 (indicator 1.2.4). Meanwhile, changing precipitation patterns and rising temperatures are favouring the transmission of deadly infectious diseases such as dengue, malaria, West Nile virus-related illness, and vibriosis, putting people at risk of transmission in previously unaffected locations (indicators 1.3.1–1.3.4).
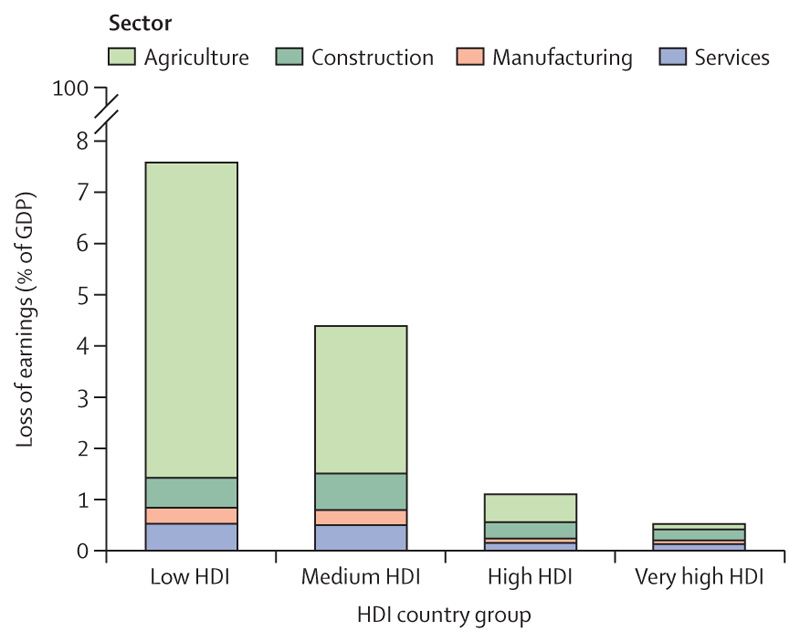
Compounding these impacts, climate change is affecting the social and economic conditions on which health and wellbeing depend. The average annual economic losses from weather-related extreme events increased by 23% from 2010–14 to 2019–23, to US$227 billion (a value exceeding the gross domestic product [GDP] of about 60% of the world’s economies; indicator 4.1.1). Although 60·5% of losses in very high Human Development Index (HDI) countries were covered by insurance, the vast majority of those in countries with lower HDI levels were uninsured, with local communities bearing the brunt of the physical and economic losses (indicator 4.1.1). Extreme weather and climate change-related health impacts are also affecting labour productivity, with heat exposure leading to a record high loss of 512 billion potential labour hours in 2023, worth $835 billion in potential income losses (indicators 1.1.3 and 4.1.3). Low and medium HDI countries were most affected by these losses, which amounted to 7·6% and 4·4% of their GDP, respectively (indicator 4.1.3). With the most underserved communities most affected, these economic impacts further reduce their capacity to cope with and recover from the growing impacts of climate change, thereby amplifying global inequities.
Concerningly, multiple hazards revealed by individual indicators are likely to have simultaneous compounding and cascading impacts on the complex and inter-connected human systems that sustain good health, disproportionately threatening people’s health and survival with every fraction of a degree of increase in global mean temperature.
Despite years of monitoring exposing the imminent health threats of climate inaction, the health risks people face have been exacerbated by years of delays in adaptation, which have left people ill-protected from the growing threats of climate change. Only 68% of countries reported high-to-very-high implementation of legally mandated health emergency management capacities in 2023, of which just 11% were low HDI countries (indicator 2.2.5). Moreover, only 35% of countries reported having health early warning systems for heat-related illness, whereas 10% did so for mental and psychosocial conditions (indicator 2.2.1). Scarcity of financial resources was identified as a key barrier to adaptation, including by 50% of the cities that reported they were not planning to undertake climate change and health risk assessments (indicator 2.1.3). Indeed, adaptation projects with potential health benefits represented just 27% of all the Green Climate Fund’s adaptation funding in 2023, despite a 137% increase since 2021 (indicator 2.2.4). With universal health coverage still unattained in most countries, financial support is needed to strengthen health systems and ensure that they can protect people from growing climate change-related health hazards. The unequal distribution of financial resources and technical capacity is leaving the most vulnerable populations further unprotected from the growing health risks.
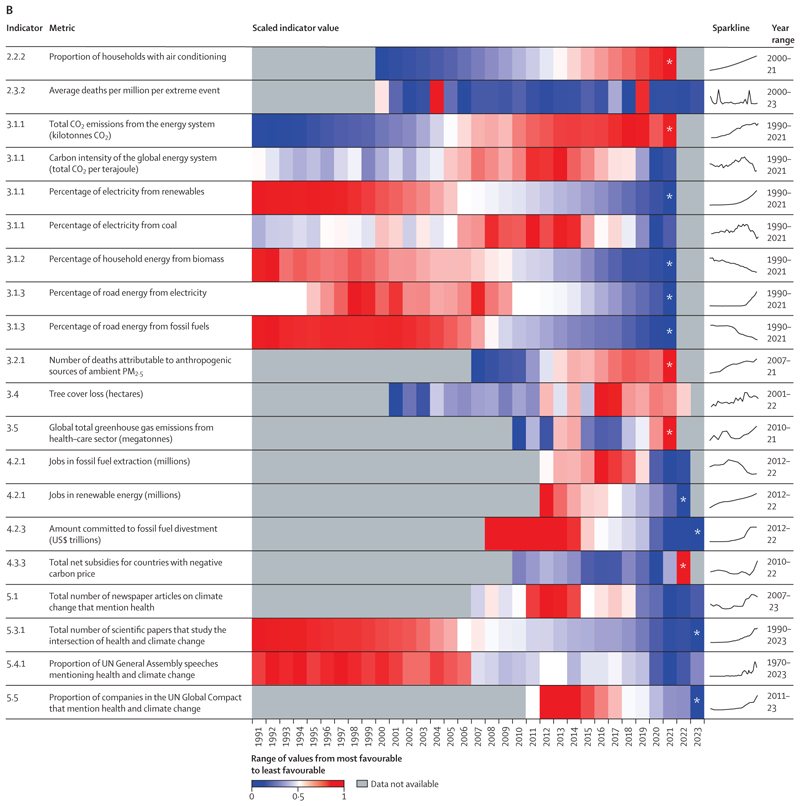
Fuelling the fire: As well as exposing the inadequacy of adaptation efforts to date, this year’s report reveals a world veering away from the goal of limiting temperature rise to 1·5°C, with concerning new records broken across indicators monitoring greenhouse gas emissions and the conditions that enable them.
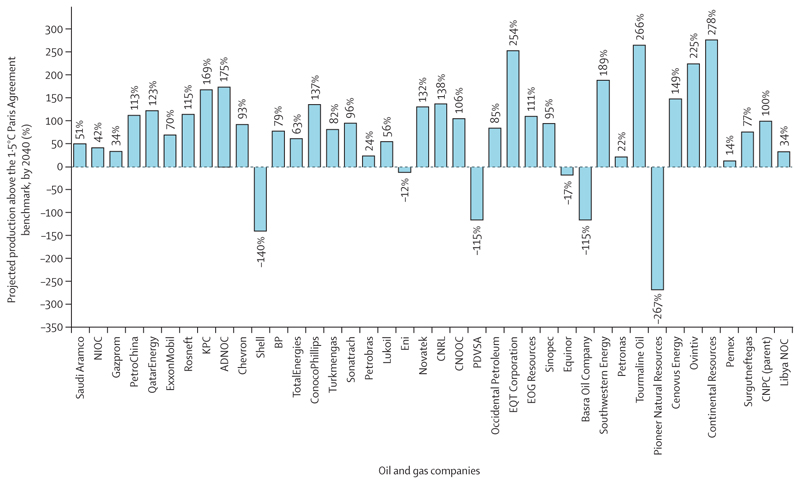
Far from declining, global energy-related CO2 emissions reached an all-time high in 2023 (indicator 3.1.1). Oil and gas companies are reinforcing the global dependence on fossil fuels and—partly fuelled by the high energy prices and windfall profits of the global energy crisis—most are further expanding their fossil fuel production plans. As of March, 2024, the 114 largest oil and gas companies were on track to exceed emissions consistent with 1·5°C of heating by 189% in 2040, up from 173% 1 year before (indicator 4.2.2). As a result, their strategies are pushing the world further off track from meeting the goals of the Paris Agreement, further threatening people’s health and survival.
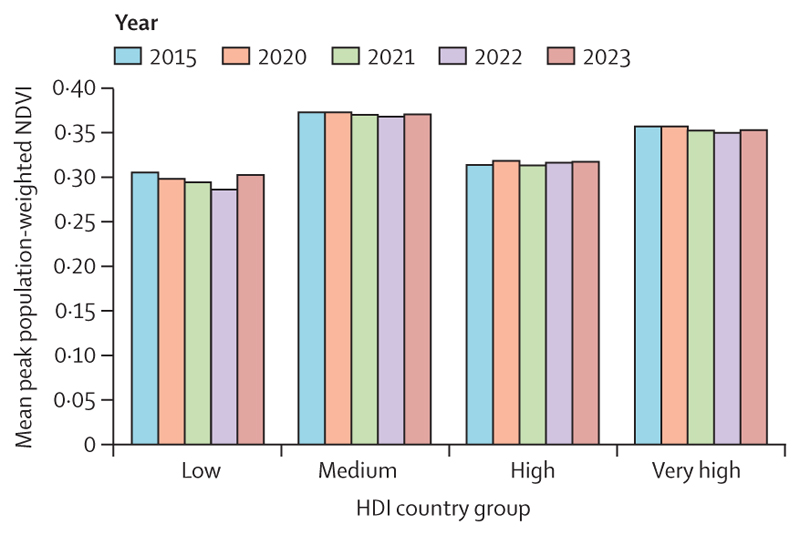
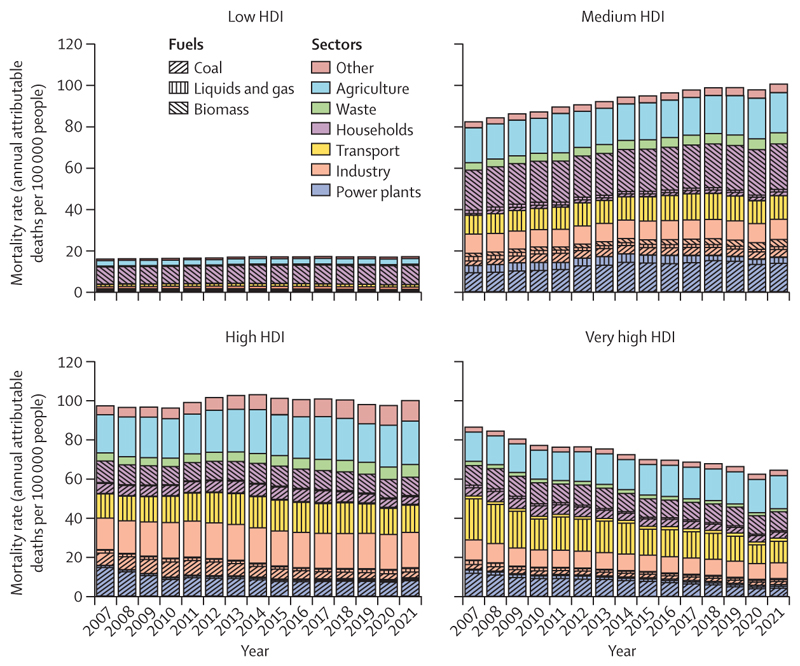
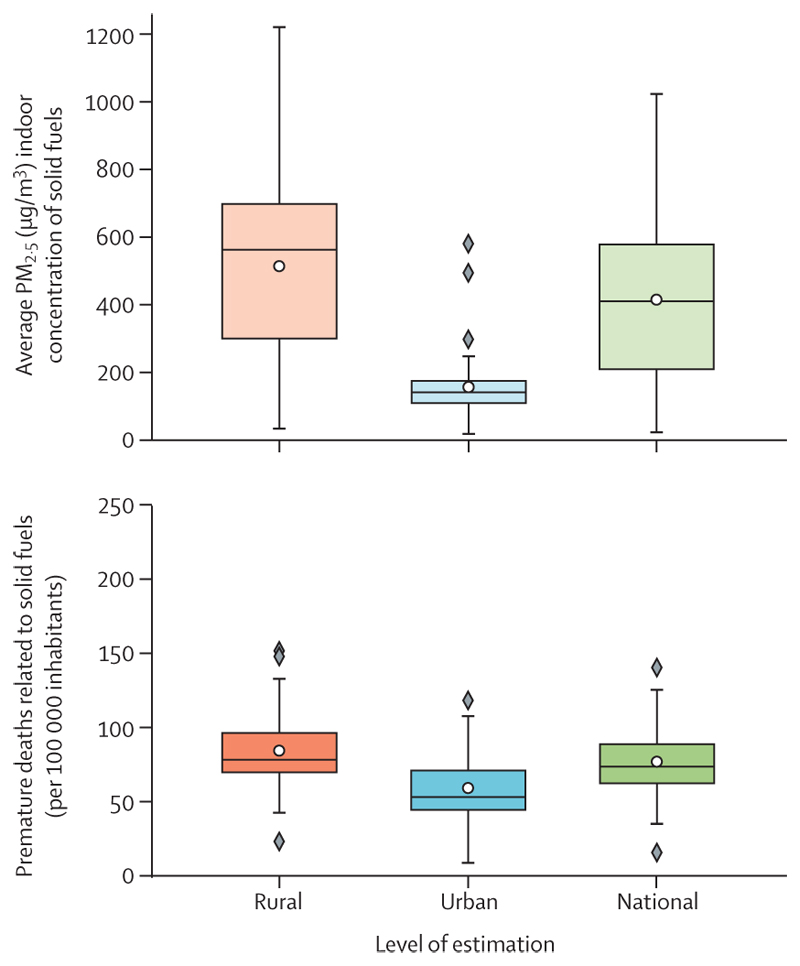
Although renewable energy could provide power to remote locations, its adoption is lagging, particularly in the most vulnerable countries. The consequences of this delay reflect the human impacts of an unjust transition. Globally, 745 million people still lack access to electricity and are facing the harms of energy poverty on health and wellbeing. The burning of polluting biomass (eg, wood or dung) still accounts for 92% of the energy used in the home by people in low HDI countries (indicator 3.1.2), and only 2·3% of electricity in these countries comes from clean renewables, compared with 11·6% in very high HDI countries (indicators 3.1.1). This persistent burning of fossil fuel and biomass led to at least 3·33 million deaths from outdoor fine particulate matter (PM2·5) air pollution globally in 2021 alone (indicator 3.2.1), and the domestic use of dirty solid fuels caused 2·3 million deaths from indoor air pollution in 2020 across 65 countries analysed (indicator 3.2.2).
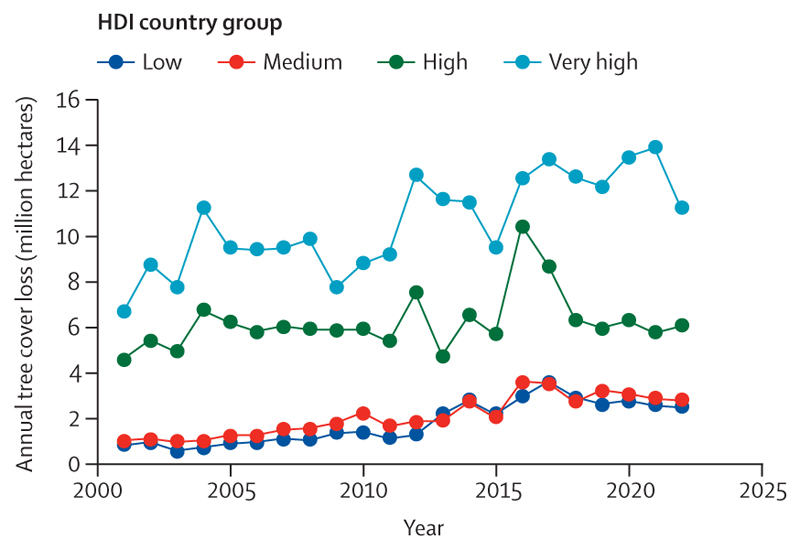
Compounding the growth in energy-related greenhouse gas emissions, almost 182 million hectares of forests were lost between 2016 and 2022 (indicator 3.4), reducing the world’s natural capacity to capture atmospheric CO2. In parallel, the consumption of red meat and dairy products, which contributed to 11·2 million deaths attributable to unhealthy diets in 2021 (indicator 3.3.2), has led to a 2·9% increase in agricultural greenhouse gas emissions since 2016 (indicator 3.3.1).
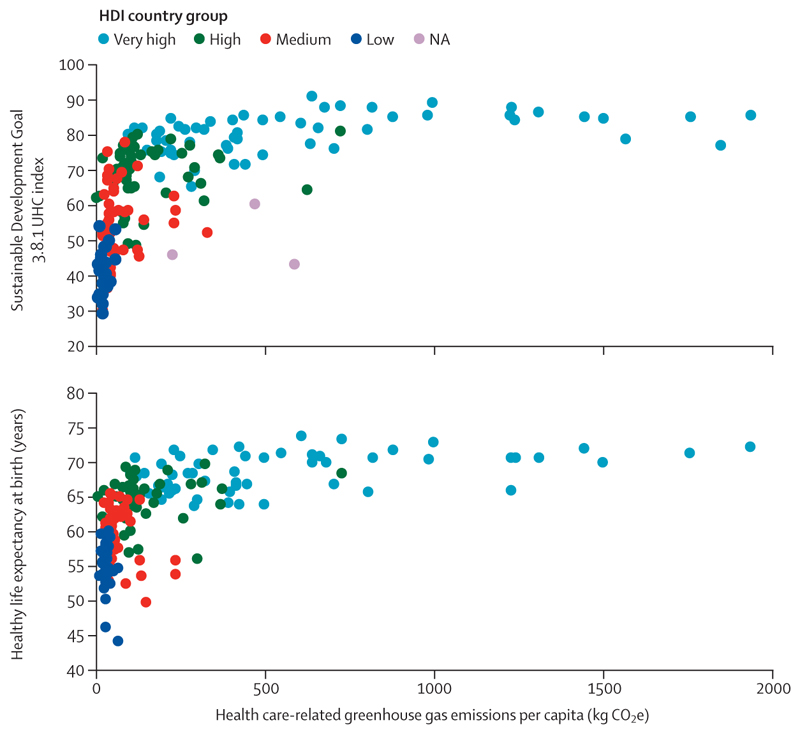
Health systems themselves, although essential to protect people’s health, are also increasingly contributing to the problem. Greenhouse gas emissions from health care have increased by 36% since 2016, making health systems increasingly unprepared to operate in a net zero emissions future and pushing health care further from its guiding principle of doing no harm (indicator 3.5).
The growing accumulation of greenhouse gases in the atmosphere is pushing the world to a future of increasingly dangerous health hazards and reducing the chances of survival of vulnerable people all around the globe.
Health-threatening financial flows: With the availability of financial resources a key barrier to tackling climate change, a rapid growth in predictable and equitable investment is urgently needed to avoid the most dangerous impacts of climate change. A growing body of literature shows that the economic benefits of a transition to net zero greenhouse gas emissions will far exceed the costs of inaction. Healthier, more resilient populations will further support more prosperous and sustainable economies (indicators 4.1.2–4.1.4).
However, although funding to enable potentially life-saving climate change adaptation and mitigation activities remains scarce, substantial financial resources are being allocated to activities that harm health and perpetuate a fossil fuel-based economy. The resulting reliance on fossil fuel energy has meant many countries faced sharp increases in energy prices following Russia’s invasion of Ukraine and the resulting disruption of fossil fuel supplies. To keep energy affordable to local populations, many governments resorted to increasing their explicit fossil fuel subsidies. Consequently, 84% of countries studied still operated net negative carbon prices (explicit net fossil fuel subsidies) in 2022, for a record high net total of $1·4 trillion (indicator 4.3.3), with the sums involved often comparable to countries’ total health budgets. In addition, although clean energy investment grew by 10% globally in 2023—exceeding fossil fuel investment by 73%—considerable regional disparities exist. Clean energy investment is 38% lower than fossil fuel spending in emerging market and developing economies outside China. Clean energy spending in these countries only accounted for 17·4% of the global total. Moreover, investment in energy efficiency and end use, essential for a just transition, decreased by 1·3% in 2023 (indicator 4.3.1).
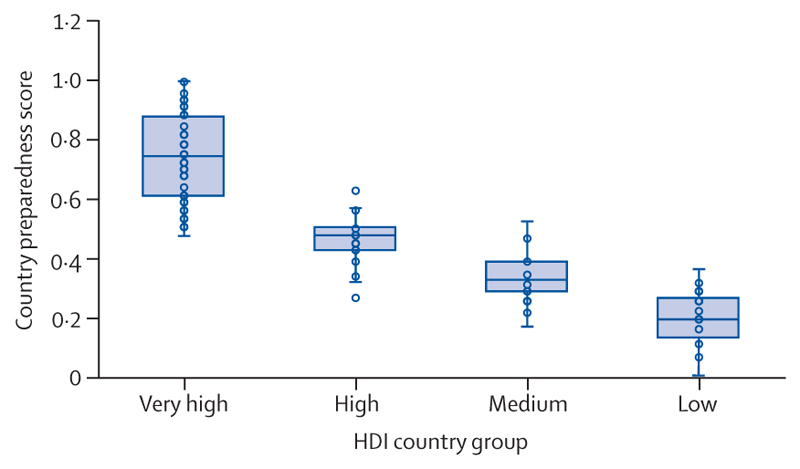
The resulting expansion of fossil fuel assets is increasingly jeopardising the economies on which people’s livelihoods depend. On the current trajectory, the world already faces potential global income losses ranging from 11% to 29% by 2050. The number of fossil fuel industry employees reached 11·8 million in 2022, increasing the size of a workforce whose employment cannot be sustained in a world that avoids the most catastrophic human impacts of climate change (indicator 4.2.1). Meanwhile, ongoing investments in coal power have pushed the value of coal-fired power generation assets that risk becoming stranded within 10 years (between 2025 and 2034) in a 1·5°C trajectory to a cumulative total of $164·5 billion—a value that will increase if coal investments persist (indicator 4.2.3). The prioritisation of fossil fuel-based systems means most countries remain ill-prepared for the vital transition to zero greenhouse gas emission economies. As a result of an unjust transition, the risk is unequally distributed: preparedness scores for the transition to a net zero greenhouse gas economy were below the global average in all countries with a low HDI, 96% of those with a medium HDI, and 84% of those with a high HDI, compared with just 7% of very high HDI countries (indicator 4.2.4).
Defining the health profile of people worldwide: Following decades of delays in climate change action, avoiding the most severe health impacts of climate change now requires aligned, structural, and sustained changes across most human systems, including energy, transportation, agriculture, food, and health care. Importantly, a global transformation of financial systems is required, shifting resources away from the fossil fuel-based economy towards a zero emissions future. Putting people’s health at the centre of climate change policy making is key to ensuring this transition protects wellbeing, reduces health inequities, and maximises health gains. Some indicators reveal incipient progress and important opportunities for delivering this health-centred transformation.
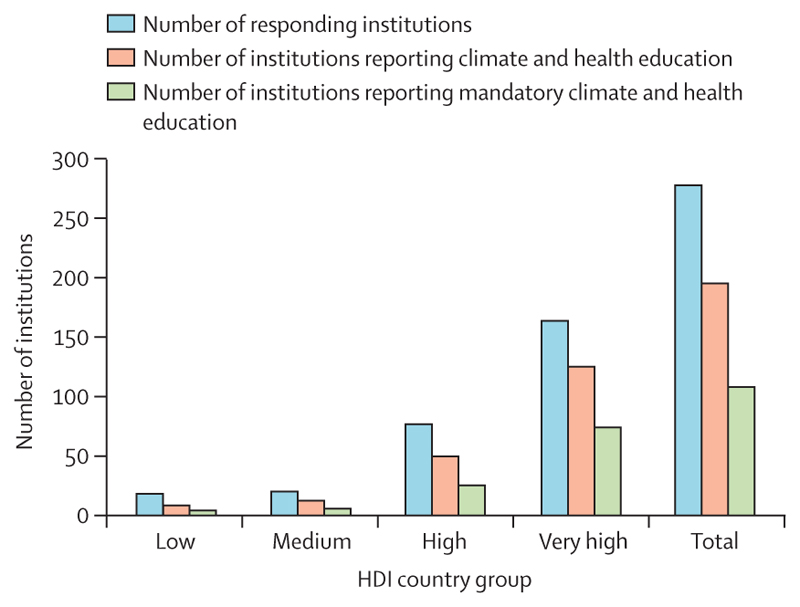
As of December, 2023, 50 countries reported having formally assessed their health vulnerabilities and adaptation needs, up from 11 the previous year, and the number of countries that reported having a Health National Adaptation Plan increased from four in 2022 to 43 in 2023 (indicators 2.1.1 and 2.1.2). Additionally, 70% of 279 public health education institutions worldwide reported providing education in climate and health in 2023, essential to build capacities for health professionals to help shape this transition (indicator 2.2.6). Regarding the energy sector, the global share of electricity from clean modern renewables reached a record high of 10·5% in 2021 (indicator 3.1.1); clean energy investment exceeded fossil fuel investment by 73% in 2023 (indicator 4.3.1); and renewable energy-related employment has grown 35·6% since 2016, providing healthier and more sustainable employment opportunities than those in the fossil fuel industry (indicator 4.2.1). Importantly, mostly as a result of coal phase-down in high and very high HDI countries, deaths attributable to outdoor PM2·5 from fossil fuel combustion decreased by 6·9% between 2016 and 2021 (indicator 3.2.1), showing the life-saving potential of coal phase-out.
Important progress was made within international negotiations, which opened new opportunities to protect health in the face of climate change. After years of leadership from WHO on climate change and health, its Fourteenth General Programme of Work, adopted in May, 2024, made responding to climate change its first strategic priority. Within climate negotiations themselves, the 28th Conference of the Parties (COP28) of the United Nations Framework Convention on Climate Change (UNFCCC) featured the first health thematic day in 2023: 151 countries endorsed the COP28 United Arab Emirates Declaration on Climate and Health, and the Global Goal on Adaptation set a specific health target. The outcome of the first Global Stocktake of the Paris Agreement also recognised the right to health and a healthy environment, urging parties to take further health adaptation efforts, and opened a new opportunity for human survival, health, and wellbeing to be prioritised in the updated Nationally Determined Contributions (NDCs) due in 2025. The pending decision of how the Loss and Damage fund will be governed and the definition of the New Collective Quantified Goal on Climate Finance during COP29 provide further opportunities to secure the financial support crucial for a healthy net zero transition.
Although still insufficient to protect people’s health from climate change, these emerging signs of progress help open new opportunities to deliver a healthy, prosperous future. However, much remains to be done.
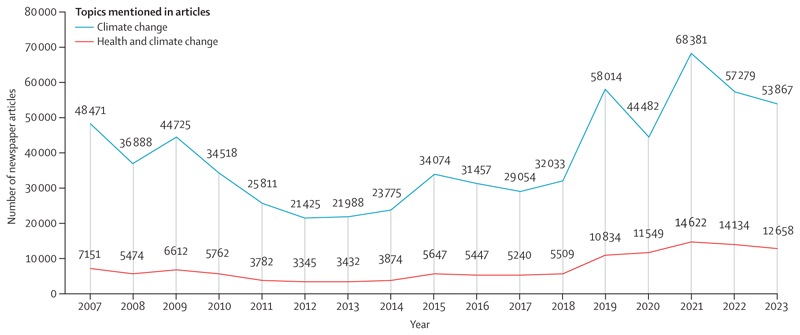
Hanging in the balance: With climate change breaking dangerous new records and emissions persistently rising, preventing the most catastrophic consequences on human development, health, and survival now requires the support and will of all actors in society. However, data suggest that engagement with health and climate change could be declining across key sectors: the number of governments mentioning health and climate change in their annual UN General Debate statements fell from 50% in 2022 to 35% in 2023, and only 47% of the 58 NDCs updated as of February, 2024, referred to health (indicator 5.4.1). Media engagement also dropped, with the proportion of newspaper climate change articles mentioning health falling 10% between 2022 and 2023 (indicator 5.1).
The powerful and trusted leadership of the health community could hold the key to reversing these concerning trends and making people’s wellbeing, health, and survival a central priority of political and financial agendas. The engagement of health professionals at all levels of climate change decision making will be pivotal in informing the redirection of efforts and financial resources away from activities that jeopardise people’s health towards supporting healthy populations, prosperous economies, and a safer future. As concerning records continue to be broken and people face unprecedented risks from climate change, the wellbeing, health, and survival of individuals in every country now hang in the balance.
Conflict of interest statement
Declaration of interests Thirteen of the authors (ZA, S-CH, LJ, AM, CO, MO, JP, YP-S, DS, LB-V, MRo, MW, and HW) were compensated for their time while drafting and developing the Lancet Countdown's report. LC was supported by a grant from the National Heart, Lung, and Blood Institute of the National Institutes of Health. CD received funding from the European Research Council (FLORA, grant number 101039402). RD was supported by a grant from the High Tide Foundation and subcontracts on funds from the Wellcome Trust and US Centers for Disease Control and Prevention. GG-S received funding from the UK National Institute for Health and Care Research for the Global Health Research Group on Diet and Activity (NIHR133205, with sub-award contract number G109900-SJ1/171 with the University of Cambridge). SHG's research was supported by the National Research Foundation, Prime Minister's Office, Singapore, under its Campus for Research Excellence and Technological Enterprise programme (grant number NRF2019-THE001-0006). JJH was supported by two grants from the Wellcome Trust and a grant from the US National Science Foundation. RH, RK, and MSo acknowledge funding from Academy of Finland projects HEATCOST (grant 334798) and VFSP-WASE (grant 359421), together with EU Horizon projects FirEUrisk (grant number 101003890) and EXHAUSTION (grant number 820655). OJ was supported by grants from the National Health Medical Research Council (Heat and Health: building resilience to extreme heat in a warming world, GNT1147789); Wellcome Trust (Heat stress in ready-made garment factories in Bangladesh and the Heat inform pregnant study); and Resilience New South Wales (A new heat stress scale for general public); holds a patent for the Environmental Measurement Unit; and has received consulting fees from the National Institutes of Health. HM received funding from the Oak Foundation to support work on climate change through RealZero, is partly funded by the National Institute for Health Research's Comprehensive Biomedical Research Centre at University College London Hospitals, and received fees from Bayer Pharmaceuticals and Chiesl for sustainability consulting. JM-U was supported by grants PID2021-127107NB-I00 from Ministerio de Ciencia e Innovación (Spain) and 2021 SGR 00526 from Generalitat de Catalunya (Spain). JRo's work is supported by the Alexander von Humboldt foundation. RL, JRo, and MRo were supported by Horizon Europe through the IDAlert project (101057554) and UK Research and Innovation (reference number 10056533). RNS reports a contract with Massachusetts General Hospital. MSo and AU were supported by the Finnish Foreign Ministry project IBA-ILMA (grant number VN/13798/2023). MSp was supported by funding from the Wellcome Trust, through Our Planet Our Health (Livestock, Environment and People, award number 205212/Z/16/Z) and a Wellcome Career Development Award (Towards the full cost of diets, award number 225318/Z/22/Z). JDSh was supported by the Canadian Institutes of Health Research, the Commonwealth Fund, and the Emergency Care Research Institute and has received consulting fees from the Institute for Healthcare Research. JT was supported by the Research Council of Finland (T-Winning Spaces 2035 project), the UK Medical Research Council (PICNIC project), and the Finnish Ministry of the Environment (SEASON project). JB is employed as a consultant by the Global Climate and Health Alliance. ML received consulting fees from YarCom for advisory services and was supported by general use gifts awarded to the Center on Global Energy Policy at Columbia University, USA. JMil acknowledges consulting fees from the C40 Climate Leadership Group. CZ-C received a consultancy from the University of Alberta and was supported by contracts with her university (Universidad Peruana Cayetano Heredia), University of Leeds, WHO, and the Wellcome Trust; she was also supported by a letter of agreement between her university and the Food and Agriculture Organization's Indigenous Peoples Unit. MD was supported by the Wellcome Trust via the Complex Urban Systems for Sustainability and Health project (grants 205207/Z/16/Z and 209387/Z/17/Z). IH, S-CH, MRo, CT, and RL were supported by the Horizon Europe CATALYSE project (CATALYSE grant number 101057131, HORIZON-HLTH-2021-ENVHLTH-02, with UK Research and Innovation reference number 10041512). The work of YH, YL, DT, and QZ was supported by the National Aeronautics and Space Administration's Earth Action programme (grant number 80NSSC21K0507). AJP was supported by the Bezos Earth Fund and the Schmidt Family Foundation. ER and SD were supported by a Process-based models for climate impact attribution across sectors (PROCLIAS) grant (COST Action PROCLIAS grant CA19139), funded by European Cooperation in Science and Technology. All other authors declare no competing interests.
Figures
References
-
- Copernicus Climate Change Service. Copernicus: global temperature record streak continues—April 2024 was the hottest on record. [accessed May 8, 2024]. https://climate.copernicus.eu/copernicus-global-temperature-record-strea... .
-
- World Metereological Organization. Climate change indicators reached record levels in 2023. WMO; 2024. Mar 19, [accessed May 20, 2024]. https://wmo.int/news/media-centre/climate-change-indicators-reached-reco... .
-
- Zachariah M, Kotroni V, Kostas L, et al. Interplay of climate change-exacerbated rainfall, exposure and vulnerability led to widespread impacts in the Mediterranean region. 2023. Sept 18, [accessed April 19, 2024]. http://spiral.imperial.ac.uk/handle/10044/1/106501 .
-
- Kimutai J, Barnes C, Zachariah M, et al. Compounding natural hazards and high vulnerability led to severe impacts from Horn of Africa flooding exacerbated by climate change and Indian Ocean Dipole. 2023. Dec 7, [accessed April 19, 2024]. http://spiral.imperial.ac.uk/handle/10044/1/108015 .
-
- Zachariah M, Philip S, Pinto I, et al. Extreme heat in North America, Europe and China in July 2023 made much more likely by climate change. 2023. Jul 25, [accessed April 19, 2024]. http://spiral.imperial.ac.uk/handle/10044/1/105549 .
Publication types
Grants and funding
LinkOut - more resources
Full Text Sources
Research Materials
