

doi: 10.1038/s41467-024-53581-y.
Non-Amontons frictional behaviors of grain boundaries at layered material interfaces
Affiliations
- PMID: 39488520
- PMCID: PMC11531579
- DOI: 10.1038/s41467-024-53581-y
Item in Clipboard
Non-Amontons frictional behaviors of grain boundaries at layered material interfaces
Nat Commun.
.
Abstract
Against conventional wisdom, corrugated grain boundaries in polycrystalline graphene, grown on Pt(111) surfaces, are shown to exhibit negative friction coefficients and non-monotonic velocity dependence. Using combined experimental, simulation, and modeling efforts, the underlying energy dissipation mechanism is found to be dominated by dynamic buckling of grain boundary dislocation protrusions. The revealed mechanism is expected to appear in a wide range of polycrystalline two-dimensional material interfaces, thus supporting the design of large-scale dry superlubric contacts.
© 2024. The Author(s).
Conflict of interest statement
The Authors declare no competing interests.
Figures

a Schematic diagram of the experimental set-up to characterize PolyGr grain boundaries (GBs). b Topography and (c) torsional frequency shift maps of a GB of misfit angle over a scan area of 10×10 nm2 obtained at the second flexural frequency shift of . d-e Vertical and torsional energy dissipation maps corresponding to panels b and c, respectively. The inset of panel e shows a cross-section of the energy dissipation map along the scan-line marked by the dashed blue line. In these measurements, the amplitudes of the second flexural and the torsional modes were and , respectively.
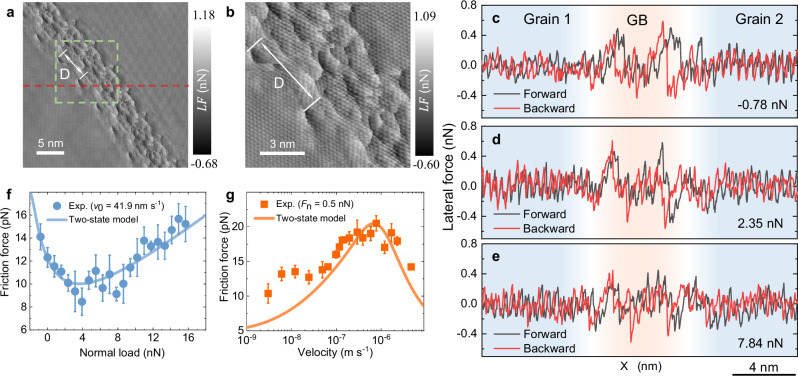
a Lateral force map for a GB with a misfit angle of , measured under a normal load of 3.1 nN with a sliding velocity of 73.2 . D denotes the distance between neighboring GB dislocations. b Zoom-in on the area marked by the green dashed square in panel (a) showing atomically resolved lateral force patterns. c-e Lateral force loops taken across the red dashed line appearing in panel (a) under normal loads of (c) −0.78 nN, (d) 2.35 nN, and (e) 7.84 nN, where forward and backward traces are marked in black and red, respectively, and the GB region is marked by the light-red background. f Load dependence of the friction force (blue circles) averaged over 3–5 independent scans of an area of 30 × 30 nm2 at a sliding velocity of 41.9 . The error bars represent the corresponding standard deviations. g Velocity dependence of the average friction force (orange rectangles) measured under a normal load of 0.5 nN. The full lines in panels f and g represent the results of the two-state phenomenological model with the following parameters: K, eV, eV, Å,
, , eV, , kHz, pN, . Here, the effective protrusion stiffness is calculated as , reflecting the fact that the maximum elastic energy stored by the spring , cannot exceed .

a Lateral force map of a flat graphene GB with a misfit angle of ˚, measured under a normal load of 5.7 nN and a sliding velocity of 146.5 . b, c Load dependence of the frictional force measured at sliding velocities of 30.5 and 244.1 , respectively. d Velocity dependence of the friction force measured under a normal load of 1.0 nN. The green squares represent the friction force. The error bars in panels (b−d) designate the corresponding standard deviations obtained by performing 5 to 6 independent scans. The solid lines are linear fits against the experimental data.

a, b Simulation setup for sliding over (a) a corrugated GB and (b) a flat GB. The gray and orange spheres represent the diamond tip and the Pt(111) substrate, respectively. The PolyGr atoms are colored according to their height above the average surface (see false color bars to the right of each panel). The lateral dimensions of the Pt(111) substrate are 41.6 × 40.8 nm2. c, d Lateral force trace loops obtained under normal loads of 0 and 12.2 nN for (c) the corrugated and (d) flat GBs. e, f GB atom height and vertical velocity () trajectories for the (e) corrugated and (f) flat GBs. g The averaged GB friction as a function of normal load for the corrugated (orange) and flat (blue) GBs.
Similar articles
-
Superlubric polycrystalline graphene interfaces.Nat Commun. 2021 Sep 28;12(1):5694. doi: 10.1038/s41467-021-25750-w. Nat Commun. 2021. PMID: 34584082 Free PMC article.
-
Stick-Slip Dynamics of Moiré Superstructures in Polycrystalline 2D Material Interfaces.Phys Rev Lett. 2022 Dec 30;129(27):276101. doi: 10.1103/PhysRevLett.129.276101. Phys Rev Lett. 2022. PMID: 36638291
-
Grain size and hydroxyl-coverage dependent tribology of polycrystalline graphene.Nanotechnology. 2019 Sep 20;30(38):385701. doi: 10.1088/1361-6528/ab2a87. Epub 2019 Jun 18. Nanotechnology. 2019. PMID: 31212265
-
Tuning friction to a superlubric state via in-plane straining.Proc Natl Acad Sci U S A. 2019 Dec 3;116(49):24452-24456. doi: 10.1073/pnas.1907947116. Epub 2019 Oct 28. Proc Natl Acad Sci U S A. 2019. PMID: 31659028 Free PMC article.
-
The Electrical Behaviors of Grain Boundaries in Polycrystalline Optoelectronic Materials.Adv Mater. 2024 Jan;36(4):e2304855. doi: 10.1002/adma.202304855. Epub 2023 Nov 27. Adv Mater. 2024. PMID: 37572037 Review.
Cited by
-
Frictional Dissipation and Scaling Laws at van der Waals Interfaces: The Role of Edge and Corner Elastic Moiré Pinning.ACS Nano. 2025 Aug 19;19(32):29255-29264. doi: 10.1021/acsnano.5c04617. Epub 2025 Aug 10. ACS Nano. 2025. PMID: 40785113 Free PMC article.
References
-
- Hod, O., Meyer, E., Zheng, Q. & Urbakh, M. Structural superlubricity and ultralow friction across the length scales. Nature563, 485–492 (2018). - PubMed
-
- Berman, D., Erdemir, A. & Sumant, A. V. Approaches for achieving superlubricity in two-dimensional materials. ACS Nano12, 2122–2137 (2018). - PubMed
-
- Dienwiebel, M. et al. Superlubricity of graphite. Phys. Rev. Lett.92, 126101 (2004). - PubMed
-
- Liu, Z. et al. Observation of microscale superlubricity in graphite. Phys. Rev. Lett.108, 205503 (2012). - PubMed
-
- Song, Y. et al. Robust microscale superlubricity in graphite/hexagonal boron nitride layered heterojunctions. Nat. Mater.17, 894 (2018). - PubMed
Grants and funding
LinkOut - more resources
Full Text Sources
