. 2024 Nov 2;15(1):9473.
doi: 10.1038/s41467-024-53451-7.

Oncogenic EML4-ALK assemblies suppress growth factor perception and modulate drug tolerance

Affiliations

Oncogenic EML4-ALK assemblies suppress growth factor perception and modulate drug tolerance

David Gonzalez-Martinez et al. Nat Commun. .

Abstract

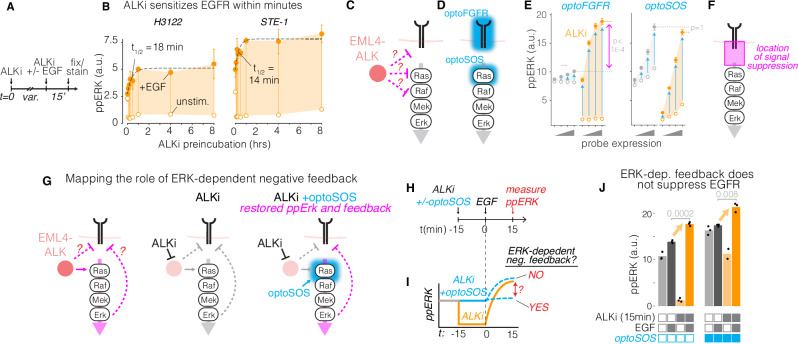
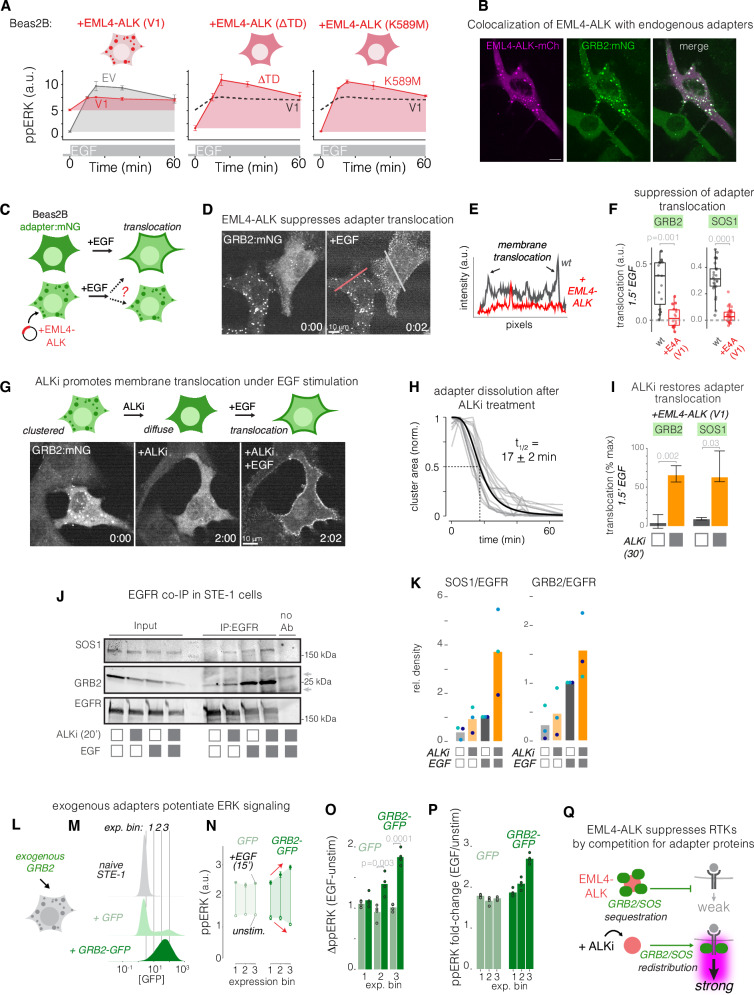
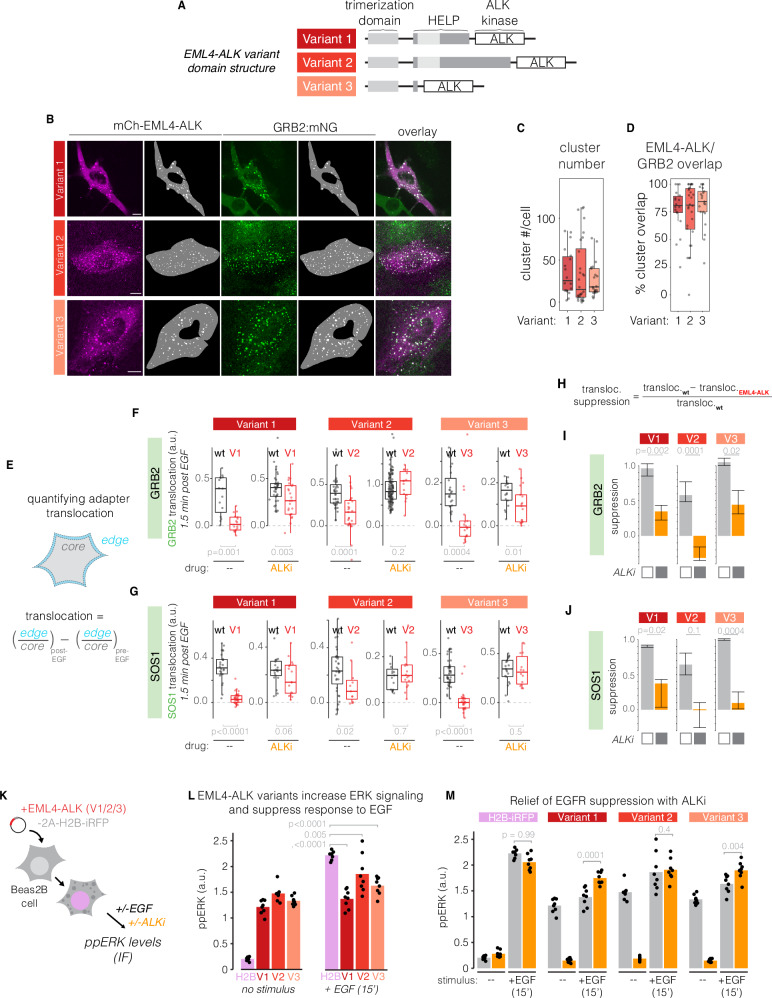
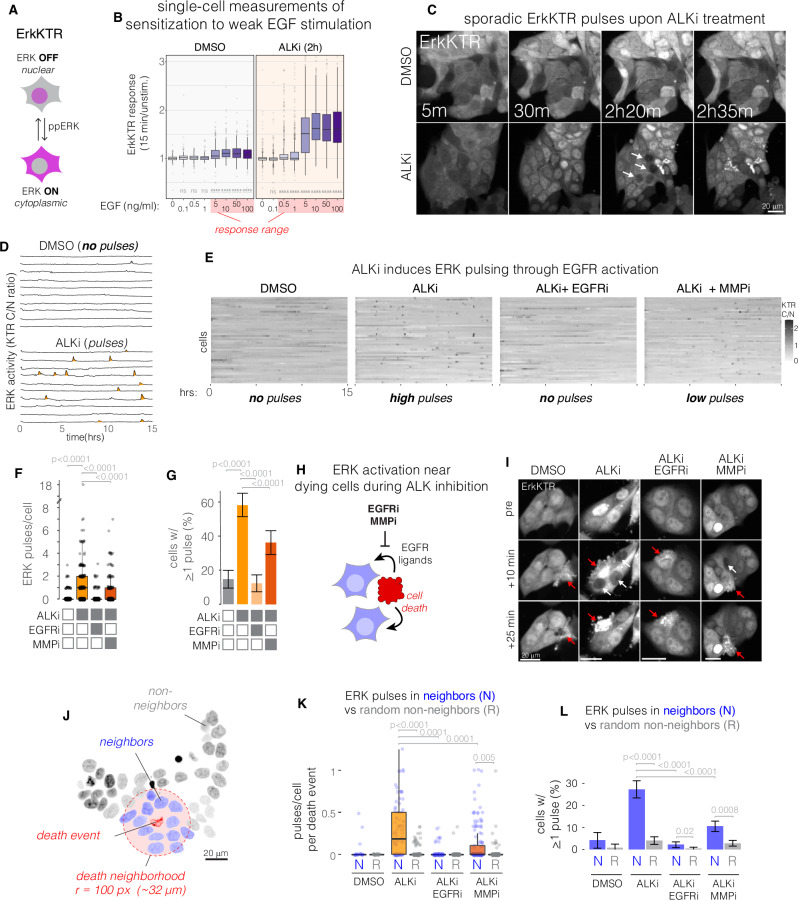
Drug resistance remains a challenge for targeted therapy of cancers driven by EML4-ALK and related fusion oncogenes. EML4-ALK forms cytoplasmic protein condensates, which result from networks of interactions between oncogene and adapter protein multimers. While these assemblies are associated with oncogenic signaling, their role in drug response is unclear. Here, we use optogenetics and live-cell imaging to find that EML4-ALK assemblies suppress transmembrane receptor tyrosine kinase (RTK) signaling by sequestering RTK adapter proteins including GRB2 and SOS1. Furthermore, ALK inhibition, while suppressing oncogenic signaling, simultaneously releases the sequestered adapters and thereby resensitizes RTK signaling. Resensitized RTKs promote rapid and pulsatile ERK reactivation that originates from paracrine ligands shed by dying cells. Reactivated ERK signaling promotes cell survival, which can be counteracted by combination therapies that block paracrine signaling. Our results identify a regulatory role for RTK fusion assemblies and uncover a mechanism of tolerance to targeted therapies.


Conflict of interest statement

D.G.M. and L.J.B. have filed a provisional patent based on the findings in this work. T.G.B. is an advisor to Novartis, AstraZeneca, Revolution Medicines, Array/Pfizer, Springworks, Strategia, Relay, Jazz, Rain, Engine, Scorpion and receives research funding from Strategia, Kinnate, Verastem, and Revolution Medicines. A.T. is an advisor to Faze Medicines. R.C.D. is an employee and shareholder of Rain Oncology Inc. and has received licensing fees from Takeda, ThermoFisher, Voronoi, Loxo, Histocyte, and Black Diamond. The remaining authors declare no competing interests.

Figures

Fig. 1
Fig. 1. Optogenetic probing of EML4-ALK+ cancer cells reveals suppression of RTK signaling.
A EML4-ALK+ cancer cells treated with ALK inhibitors (ALKi) can persist through therapy and acquire stable drug resistance. B Immunofluorescence shows punctate expression of ALK in two EML4-ALK+ cancer cell lines. Scale = 10 µm. C Understanding functional interactions between EML4-ALK and transmembrane RTKs. D Functional profiling of RTK signaling in EML4-ALK+ cancer cells. E OptoFGFR allows blue-light-induced stimulation RTK/ERK signaling. F Single-cell immunofluorescence of ppERK levels in STE-1 cells stimulated with light (optoFGFR) in the presence (orange) or absence (gray) of ALK inhibitor crizotinib (ALKi, 1 µM). Significance assessed using one-sided KS test for difference of two distributions. G ppERK fold-change in response to 5 min of blue light stimulation over the range of the indicated stimulus intensities. Data points show the ratio of ppERK from stimulated and unstimulated cells. Each data point in (G) shows the mean of 3000–5000 cells. Error bars = 95% CI. See Supplementary Table 1 for biological and experimental replicate numbers for all experiments.
Fig. 2
Fig. 2. EML4-ALK suppresses EGFR signaling.
A EGF stimulates EGFR and downstream RAS/ERK signaling. B ppERK levels in response to EGF (100 ng/mL) in the presence of 1 µM ALKi (orange) or DMSO (gray) in STE-1 and H3122 cancer cells. Data points represent mean of 1000–2800 cells for STE-1 and 800–3000 cells for H3122. Error bars = 95% CI. ****p < 0.0001, ***p = 0.0007, *p = 0.02 by one-sided T-test comparing ALKi vs DMSO. n = 3 biological replicates. C Representative images of ALKi-dependent potentiation of ERK response to EGF (B). D Fold-change increase over a range of EGF concentrations. Data represent ratio of mean ppERK from EGF-stimulated (15 min) vs unstimulated cells. Significance assessed using one-sided T-test, n = 3 biological replicates. E, F Representative single-cell (top) and average (bottom) ERK responses to EGF (50 ng/mL, 15 min) and ALKi (crizotinib, 1 μm, 2 h pretreatment) in two primary patient-derived cell lines, CUTO-8 and CUTO-9, that harbor EML4-ALK(V1) (E), or in cell lines driven by a constitutively active, full-length ALK mutant (F). Data points in (E, F) (bottom) represent mean ppERK normalized to mean ppERK of ALKi-treated cells for 900–2100 STE-1, 900–1500 CUTO-8, 200–300 CUTO-9, 200–600 Kelly cells and 1700–2700 SY5Y cells. Significance assessed by one-sided T-test, n = 3 biological replicates for STE-1, CUTO-8, Kelly, and SY5Y; n = 6 biological replicates for CUTO-9. G EML4-ALK(V1) (EML4-ALK-2A-H2B-miRFP) or a control construct (H2B-miRFP) were transiently expressed in lung epithelial Beas2B cells. H Time course of ppERK immunofluorescence levels in response to EGF stimulation (50 ng/mL). Data points represent mean ± SEM of 120–300 cells for untransfected Beas2B and 80–160 cells for Beas2B expressing EML4-ALK. **p = 0.003, *p = 0.04, by one-sided T-test for ppERK in transfected vs untransfected cells, n = 3 biological replicates. I Dynamic range of ppERK in EML4-ALK-expressing Beas2B in response to EGF in the presence or absence of ALKi (1 µM) pretreatment. Significance assessed using one-sided T-test, n = 3 biological replicates.
Fig. 3
Fig. 3. Mapping RTK feedback suppression using optogenetics.
A Time course of EGFR sensitization was obtained by pre-incubating cancer cells with 1 µM crizotinib for a variable period before stimulation with EGF (50 ng/mL) for 15 min, followed by fixation and immunostaining for ppERK. B ppERK induction as a function of ALKi pre-incubation time. Open circles: unstimulated; closed circles: EGF-stimulated. Data points represent mean of three biological replicates, each representing 1200–2700 cells for STE-1 and 2000–3300 cells for H3122. Error bars = 95% CI. C Pinpointing the location of EML4-ALK interaction with RTK/ERK signaling. D OptoFGFR and optoSOS permit optogenetic stimulation at successive nodes of the pathway. E Quantification of ppERK levels in response to optoFGFR or optoSOS in the presence (orange) or absence (gray) of ALKi (1 µM crizotinib). X-axis represents optoFGFR or optoSOS expression quartiles. Data points represent mean ± SEM of three biological replicates, each representing 200–1100 cells. Significance assessed using one-sided T-test, n = 3 biological replicates. Open circles: unstimulated; closed circles: light stimulated. F ALK-dependent suppression is observed only with optoFGFR, suggesting that suppression happens upstream of RAS but downstream of RTK activation. G Testing the role of ERK-dependent negative feedback on RTK suppression. Light stimulation of optoSOS drives elevated levels of ppERK during ALKi treatment and sustains any potential ERK-dependent negative feedback that would otherwise be lost during ALK inhibition. H STE-1 cells were treated with either ALKi or ALKi and optoSOS stimulation, and the response to EGF was assessed. I Predicted results and implications for ERK-dependent feedback. J optoSOS did not suppress ALKi-induced potentiation of EGF response, suggesting that ERK-dependent negative feedback does not account for EGFR suppression. Data points represent means of 150–900 cells per condition. Significance assessed using one-sided T-test, n = 3 biological replicates.
Fig. 4
Fig. 4. EML4-ALK assemblies suppress EGFR through sequestration of RTK effectors.
A Quantification of ppERK response to EGF (50 ng/mL) in Beas2B cells that were transfected with EML4-ALK (V1), EML4-ALK (∆TD), or kinase-dead EML4-ALK (K589M), or with an empty vector (EV). Data points represent mean ± SEM of three biological replicates, each representing 200–400 EV cells, 130-270-EML4-ALK (V1) cells, 55–160 EML4-ALK (∆TD) cells, or 260–450 EML4-ALK (K589M) cells. B Colocalization of EML4-ALK condensates with endogenously tagged GRB2 (GRB2:mNG2). See Fig. 5 for quantitation. Scale = 10 µm. C GRB2:mNG2 Beas2B cells were transiently transfected with EML4-ALK and stimulated with EGF (50 ng/mL) to visualize GRB2 translocation in the presence and absence of EML4-ALK (V1). D Impaired membrane translocation of GRB2 in the presence of EML4-ALK condensates. Time in mm:sec. See Supplementary Movie 1. E Line scan of GRB2 intensity distribution in the presence (red) or absence (gray) of EML4-ALK expression, as depicted in (C). F Quantitation of translocation of endogenous GRB2 or SOS1 in the presence (red) or absence (gray) of EML4-ALK. Boxplot indicates the median and upper/lower quartiles, and whiskers extend to 1.5*IQR. See Fig. 5 for full quantitation. G GRB2 localization and translocation were visualized upon treatment with 1 µM ALKi and subsequent stimulation with EGF (50 ng/mL). Time in hh:mm. H Quantification of kinetics of GRB2 dissociation from condensates after ALKi treatment. I ALKi restores GRB2 and SOS translocation. Plot shows median translocation of endogenous adapters in cells expressing EML4-ALK(V1) represented as a fraction of translocation in the absence of EML4-ALK (V1). Data represent medians, error bars show 1st and 3rd quartiles of 1000 bootstrapped samples (distributions found in Fig. 5F, G). Significance assessed by one-sided bootstrap test for comparison of medians. See Fig. 5F, G for underlying data and quantitation. J Immunoprecipitation of EGFR shows enhanced co-precipitation of GRB2 and SOS1 in the presence of both ALKi pretreatment and EGF in STE-1 cells. gray arrows: non-specific bands. K Densitometry quantification of three independent pulldowns. L Testing effect of GRB2 overexpression on ERK response. M Expression levels of GRB2-GFP or GFP analyzed in (N, O). N ppERK levels in the absence (open circles) or presence (closed circles) of EGF stimulation (50 ng/mL) as a function of expression levels of GFP or GRB2-GFP. Data represent mean ± SEM of three biological replicates, each representing the mean of 100–300 cells. O Absolute magnitude of ppERK increase for each expression bin from data shown in (N). Significance assessed by one-sided T-test, n = 3 biological replicates. P Fold-change of response calculated from data in (N). Q Conceptual model of how EML4-ALK suppresses transmembrane RTKs. EML4-ALK sequesters adapters like GRB2/SOS1 and prohibits their translocation to activated RTKs. ALK inhibition releases adapter sequestration and restores cellular response to RTK stimulation.
Fig. 5
Fig. 5. Condensation and suppression of RTK signaling are common properties among EML4-ALK variants.
A Three common oncogenic variants of EML4-ALK (Variants 1–3) share a common ALK fragment but differ in the lengths of the EML4 domain. B Expression of mCh-EML4-ALK(V1/2/3) in GRB2:mNG2 Beas2B cells showed condensation of each variant as well as the propensity of the condensates to colocalize with GRB2. Scale = 10 µm. C Quantification of puncta per cell for each variant. D Quantification of the percent of EML4-ALK puncta that overlap with GRB2 puncta in each cell. Boxplots in (C, D) show median and upper/lower quartile, and whiskers extend to 1.5*IQR. C, D Data points represent 18 (V1), 28 (V2), and 21 (V3) cells. E Translocation was quantified by identifying the cell edge and defining a 10 pixel ring into the cytoplasm (“edge”). The remaining cell pixels beyond this ring wire designated as the cell “core”. Membrane localization was defined as the ratio of mean edge fluorescence to mean core fluorescence. Translocation was defined as the difference in adapter membrane localization after 1.5 min of EGF stimulation vs pre-stimulation. F, G Quantitation of translocation of GRB2 (F) or SOS (G) for cells transfected with one of the 3 EML4-ALK variants or for neighboring untransfected cells (wt). Due to small variations in imaging plane between acquisitions, the absolute magnitude of translocation differed between variants and drug conditions (note the differences in untransfected Beas2B responses, which are equivalent conditions between panels). However, cells with or without EML4-ALK (black vs. red in the same panel) were imaged in the same field of view and thus can be compared directly. Data points represent individual cells. For (F), n = 57(WT)/40(V1), 170(WT)/42(V2), 24(WT)/34(V3) cells. For (G), n = 46(WT)/50(V1), 50(WT)/27(V2), 67(WT)/40(V3) cells. Boxplots show median and upper/lower quartile, and whiskers extend to 1.5*IQR. H Definition of the magnitude of translocation. I, J Comparison of translocation suppression of GRB2 (F) or SOS1 (G) for each of the three variants. Data represent median translocation suppression from resampling of 1000 bootstrapped samples. Error bars show lower and upper quartiles. Significance determined by either one-sided T-test (panels F, G) or one-sided bootstrap test (panels I, J). Data for Variant 1 in (FJ) is reproduced from Fig. 4F, I. K Beas2B cells were transfected with EML4-ALK-2A-H2B-miRFP constructs for one of 3 EML4-ALK variants (V1, V2, V3), or with an H2B-iRFP control, and ppERK levels were assessed after stimulation with EGF (15 min, 50 ng/mL) in the presence or absence of ALKi (1 µM crizotinib, 2 h), through immunofluorescence. L Quantification of ppERK immunostaining after EGF stimulation of Beas2B transiently expressing EML4-ALK in the presence or absence of ALKi. Significance assessed by Hsu MCB test. n = 8 biological replicates. M ppERK response in the presence and absence of ALKi pretreatment. Data points represent the mean ppErk intensity of 20–60 cells. Significance assessed by one-sided T-test. n = 8 biological replicates. Gray bars in (M) are reproduced from (L) for direct comparison to between non-treated and ALKi-treated cells.
Fig. 6
Fig. 6. ALK inhibition hypersensitizes cancer cells to paracrine growth factors secreted from dying neighbor cells.
A The ErkKTR reporter indicates ERK activity through nuclear-cytoplasmic translocation of a fluorescent protein. B Sensitivity of single cells (STE-1) to 15 min EGF stimulation. Plot shows fold change of ERK activity in single cells upon stimulation with the indicated amount of EGF in the presence or absence of ALKi (crizotinib, 1 µM). Boxplot shows median and upper/lower quartiles, and whiskers extend to 1.5*IQR. Significance tests indicate increased response above 0 ng/mL EGF. ****p < 0.0001 by Hsu multiple comparison with the best (MCB) test. n = 316, 384, 421, 285, 307, 256, 294, 421 cells respectively for DMSO and 473, 727, 536, 595, 541, 425, 439, 415 cells respectively for ALKi. See Supplementary Movie 3. C Live-cell imaging of STE-1 cells expressing ErkKTR in the presence or absence of ALKi (1 µM crizotinib). See Supplementary Movie 4. D Representative single-cell traces of cytoplasmic/nuclear ErkKTR intensity ratio from conditions shown in (C). E Quantification of ErkKTR activity in the presence of ALKi or its combination with EGFRi (1 µM erlotinib) or MMPi (10 µM marimastat). F Quantification of ERK activity pulses. Boxplot shows median and upper/lower quartiles, whiskers show 1.5*IQR. Significance assessed by Hsu MCB test. n = 177 (control), 198 (ALKi), 170 (ALKi/EGFRi), and 182 (ALKi/MMPi) single cells. G Percent of cells that exhibited any pulses over 22 h of imaging. Error bars indicate 95% CI. Significance assessed by the Hsu MCB test. n = 200 cells per condition. H Apoptotic cells secrete paracrine EGFR ligands to their neighbors. Paracrine signaling can be blocked by inhibiting either EGFR or the MMPs that mediate shedding of EGFR ligands from the surface of the sender cell. I ErkKTR activity pulses are primarily observed surrounding a dying cell during ALK inhibition but not in the absence of drug or in the added presence of EGFR or MMP inhibitors. J Definition of neighbors and non-neighbors of a death event. K Quantification of pulses per cell for each death event in neighbors or in equal number of randomly chosen subset of cells not near a death event (see “Methods” for more details), n = 91, 103, 149, 20 events for ALKi, ALKi/EGFRi, ALKi/MMPi and DMSO, respectively. Boxplot shows median and upper/lower quartiles, whiskers show 1.5*IQR. L Fraction of total neighbor vs random non-neighbor cells that show any pulsing. Cell numbers as in (F). Error bars show 95% CI. Significance in (K, L) determined by independent T-tests (within treatment conditions) or by ANOVA followed by the Hsu MCB test (across treatment conditions).
Fig. 7
Fig. 7. Resensitization to paracrine signals drives gene expression and promotes drug tolerance.
A Signaling through EGFR activates RAS/ERK and stimulates transcription, including of the immediate early gene EGR1. B Quantification of single-cell IF of EGR1 in STE-1 cells under the conditions indicated. C Overlay of EGR1 expression at the 6 h time point in (B). D Testing whether restored perception of paracrine signals can promote survival during ALKi treatment. E Quantification of pulses per cell in cells that died (D) or survived (S) through 22 h of imaging in the conditions where ERK pulsing could be observed. Boxplot shows median and upper/lower quartiles, whiskers show 1.5*IQR. Significance assessed by one-sided T-tests. n = 88 ALKi(D), 110 ALK(S), 136 ALKi/MMPi(D), and 46 ALKi/MMPi(S) cells. F Caspase-3 activation was assessed using the NucView reporter after 24 h treatment with the indicated drugs. Data points show proportion of 2300–3500 STE-1 cells and 3500–4500 H3122 cells. Significance assessed by one-sided T-test, n = 3 biological replicates. G, H DAPI imaging (left) and cell counts (right) of cell survival after 17 days of the indicated treatments in both H3122 (G) and STE-1 (H) cell lines. Significance assessed using one-sided T-test. n = 3 (H3122) and n = 4 (STE1) biological replicates. I Summary of the effects of drug-induced RTK resensitization.

References

    1. Wang, T. et al. Landscape of potentially targetable receptor tyrosine kinase fusions in diverse cancers by DNA-based profiling. NPJ Precis. Oncol.6, 84 (2022). - PMC - PubMed
    1. Takeuchi, K. et al. RET, ROS1 and ALK fusions in lung cancer. Nat. Med.18, 378–381 (2012). - PubMed
    1. Siegel, R. L., Miller, K. D., Fuchs, H. E. & Jemal, A. Cancer statistics, 2021. CA Cancer J. Clin.71, 7–33 (2021). - PubMed
    1. Shaw, A. T. et al. Clinical features and outcome of patients with non-small-cell lung cancer who harbor EML4-ALK. J. Clin. Oncol.27, 4247–4253 (2009). - PMC - PubMed
    1. Weinstein, I. B. Addiction to oncogenes—the Achilles heal of cancer. Science297, 63–64 (2002). - PubMed

Publication types

MeSH terms

Substances

LinkOut - more resources