. 2024 Nov 2;15(1):9471.
doi: 10.1038/s41467-024-53914-x.

Charge-assisted stabilization of lipid nanoparticles enables inhaled mRNA delivery for mucosal vaccination

Affiliations

Charge-assisted stabilization of lipid nanoparticles enables inhaled mRNA delivery for mucosal vaccination

Shuai Liu et al. Nat Commun. .

Abstract

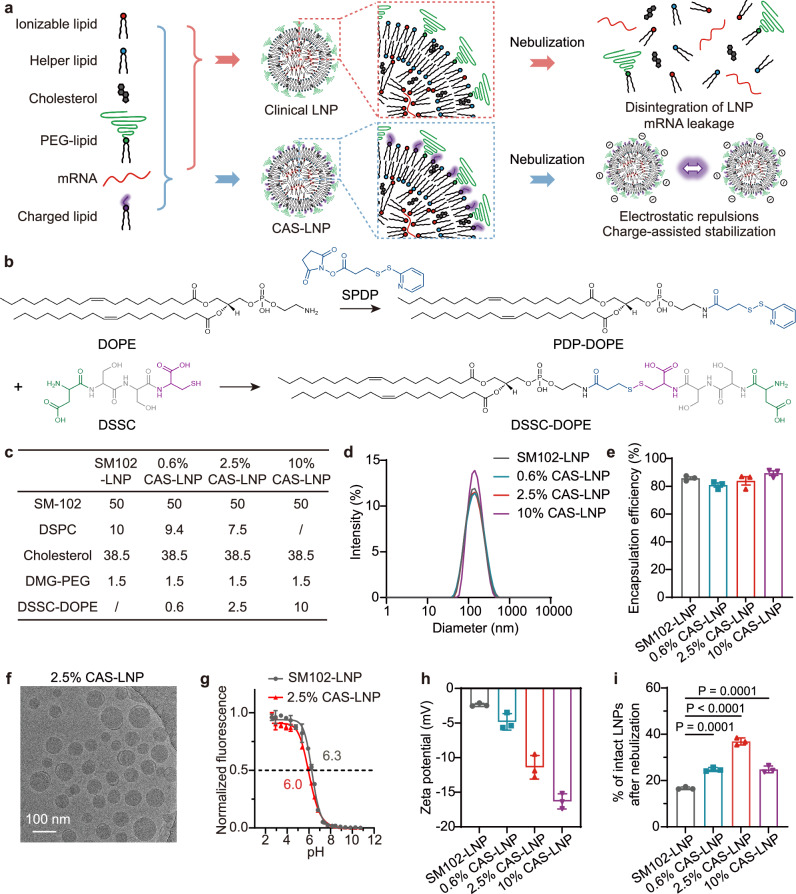
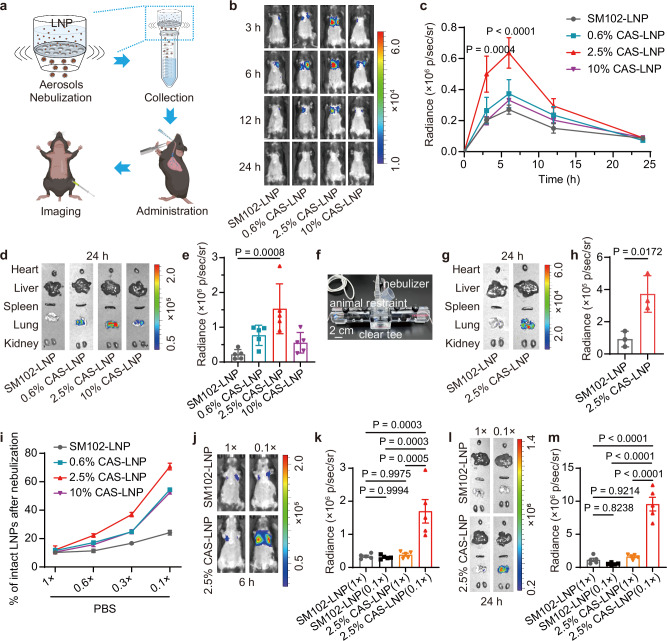
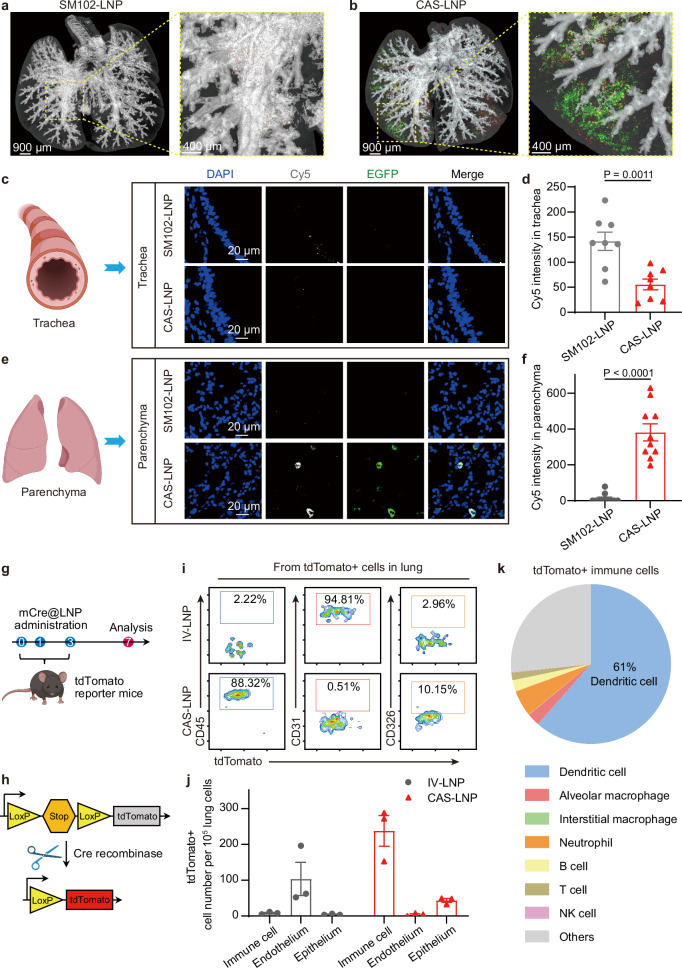
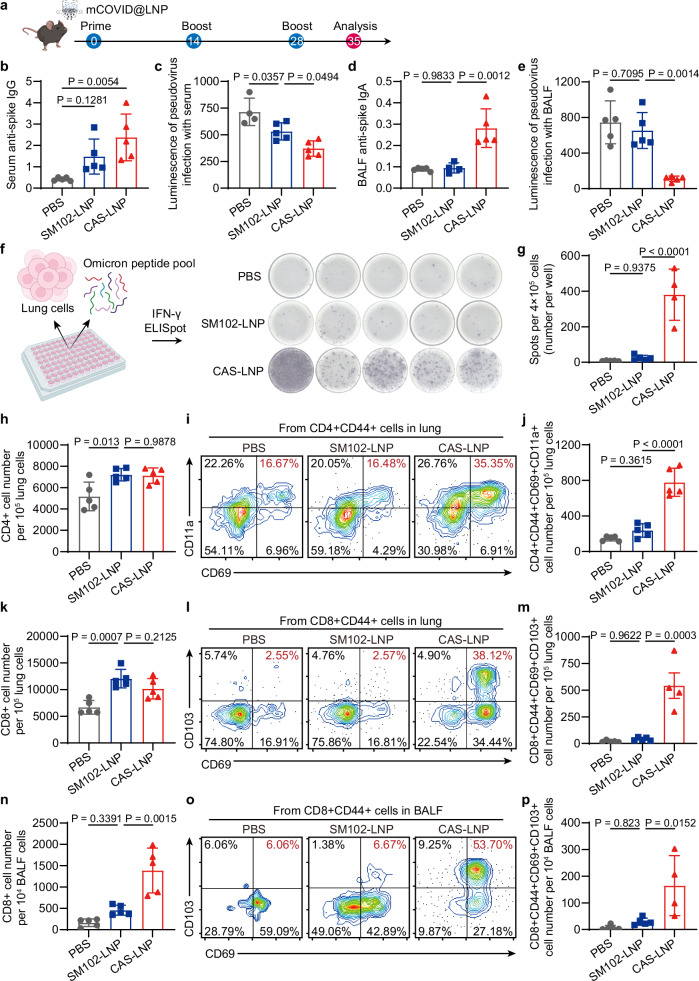
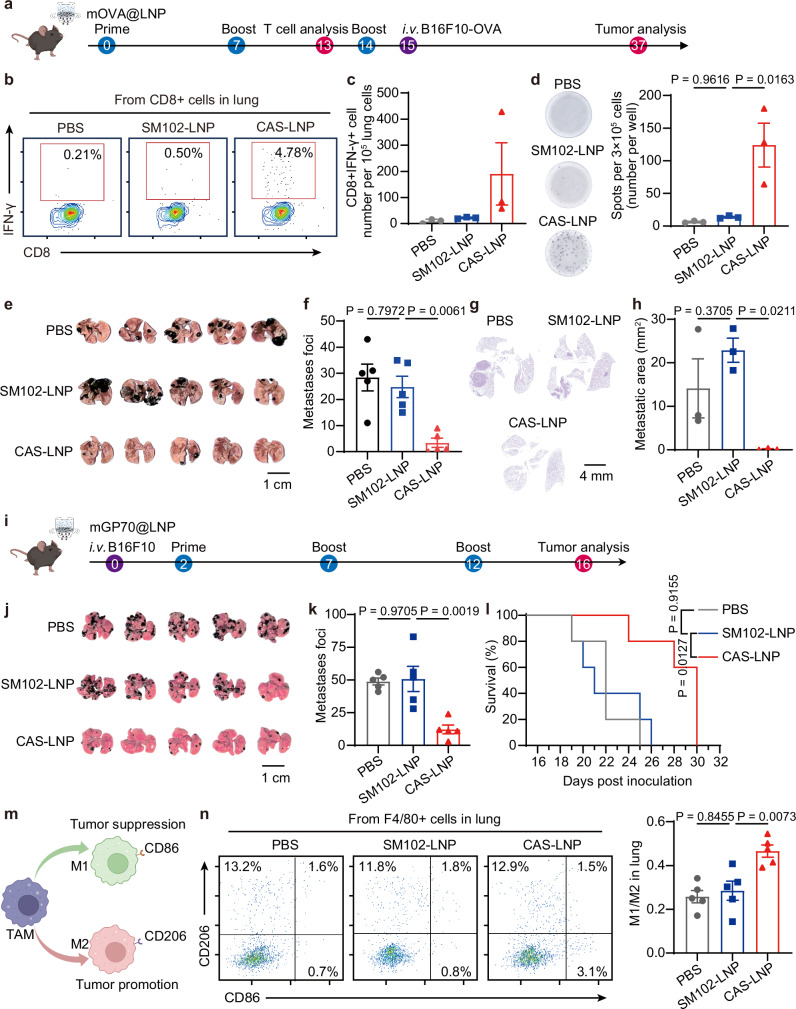
Inhaled delivery of messenger RNA (mRNA) using lipid nanoparticle (LNP) holds immense promise for treating pulmonary diseases or serving as a mucosal vaccine. However, the unsatisfactory delivery efficacy caused by the disintegration and aggregation of LNP during nebulization represents a major obstacle. To address this, we develop a charge-assisted stabilization (CAS) strategy aimed at inducing electrostatic repulsions among LNPs to enhance their colloidal stability. By optimizing the surface charges using a peptide-lipid conjugate, the leading CAS-LNP demonstrates exceptional stability during nebulization, resulting in efficient pulmonary mRNA delivery in mouse, dog, and pig. Inhaled CAS-LNP primarily transfect dendritic cells, triggering robust mucosal and systemic immune responses. We demonstrate the efficacy of inhaled CAS-LNP as a vaccine for SARS-CoV-2 Omicron variant and as a cancer vaccine to inhibit lung metastasis. Our findings illustrate the design principles of nebulized LNPs, paving the way of developing inhaled mRNA vaccines and therapeutics.


Conflict of interest statement

X.L. and S.L. are inventors on a patent application (No. PCT/CN2023/130743) held by the Institute of Chemistry Chinese Academy of Sciences that covers the design and applications of CAS-LNP reported in this study. The remaining authors declare no competing interests.

Figures

Fig. 1
Fig. 1. Synthesis and characterization of CAS-LNP.
a Schematic illustrating the preparation and mechanism of CAS-LNP. By incorporating charged lipids into clinical LNP formulation, the increased electrostatic repulsions among CAS-LNPs enhance LNP stability during nebulization. b Synthetic scheme of DSSC-DOPE. c Formulations of SM102-LNP and CAS-LNPs. d Representative size distribution of LNPs measured by DLS. e The mRNA encapsulation efficiency of LNPs. f A representative Cryo-TEM image of 2.5% CAS-LNP. g pKa of SM102-LNP and 2.5% CAS-LNP measured by 2-(p-toluidino)−6-napthalene sulfonic acid (TNS) assay. h Zeta potentials of SM102-LNP and CAS-LNPs. i Percentage of intact LNPs after nebulization in 0.3×PBS. Data are shown as mean ± standard deviation (SD) (n = 3 technical replicates). Statistical significance was analyzed by one-way analysis of variance (ANOVA) and Tukey’s multiple comparisons test. Source data are provided as a Source Data file.
Fig. 2
Fig. 2. Stability and mRNA delivery efficiency of CAS-LNP after nebulization.
a Workflow for evaluating mRNA expression of nebulized LNPs in mice. b Representative IVIS images and (c) quantitative analysis of luminescence in mice treated with SM102-LNP or CAS-LNPs in 0.3 × PBS at different time points. d Representative IVIS images of major organs (heart, liver, spleen, lung, and kidney) and (e) quantitative analysis of lungs at 24 h post-administration. Each dose contains 1 µg of mFluc per mouse (n = 5 biologically independent samples). Data are shown as mean ± standard error of the mean (SEM). Statistical significance was analyzed by two-way (c) or one-way (e) ANOVA and Tukey’s multiple comparisons test. f Photograph of custom apparatus for inhaled administration to three mice simultaneously. g Representative IVIS images of major organs and (h) quantitative analysis of lungs treated with SM102-LNP or 2.5% CAS-LNP in 0.3 × PBS at 24 h post-administration (n = 3 biologically independent samples). Data are shown as mean ± SD. Statistical significance was analyzed by unpaired two-tailed Student’s t test. i Percentage of intact LNPs after nebulization in PBS of varying ionic strength (n = 3 technical replicates). Data are shown as mean ± SD. j Representative IVIS images and (k) quantitative analysis of luminescence in mice treated with SM102-LNP or 2.5% CAS-LNP in 1 × or 0.1 × PBS at 6 h post-administration. l Representative IVIS images of major organs and (m) quantitative analysis of lungs at 24 h post-administration (n = 5 biologically independent samples). Data are shown as mean ± SEM. Statistical significance was analyzed by one-way ANOVA and Tukey’s multiple comparisons test. Figure 2a was created in BioRender. Lu, X. (2024) BioRender.com/y08x203. Source data are provided as a Source Data file.
Fig. 3
Fig. 3. Mechanism study of CAS-LNP.
a Chemical structures of DOPA, HA, and HA-DSSC (b). c Zeta potentials of SM102-LNP, 2.5% DOPA-LNP, 2.5% HA-LNP, and 2.5% HA-DSSC-LNP (n = 3 technical replicates). Data are shown as mean ± SD. d Percentage of intact LNPs after nebulization in 0.1 × PBS (n = 3 technical replicates). Data are shown as mean ± SD. e Representative IVIS images and (f) quantitative analysis of luminescence in mice at 6 h post-administration (n = 3 biologically independent samples). Data are shown as mean ± SEM. Statistical significance was analyzed by one-way ANOVA and Tukey’s multiple comparisons test. g Chemical structures of DSSC, SSSC, DDSC, and DDDC. h Isoelectric points of DSSC, SSSC, DDSC, and DDDC. i Zeta potentials of CAS-LNP, SSSC-LNP, DDSC-LNP, and DDDC-LNP (n = 3 technical replicates). Data are shown as mean ± SD. j Percentage of intact LNPs after nebulization in 0.1 × PBS (n = 3 technical replicates). Data are shown as mean ± SD. k Representative IVIS images of lungs and (l) quantitative analysis at 24 h post-administration (n = 5 biologically independent samples). Data are shown as mean ± SEM. m Chemical structures of DESSC-DOPE and DESSCE-DOPE. Either one or both carboxyl groups of DSSC were converted to methyl esters. n Zeta potentials of CAS-LNP, DESSC-LNP, and DESSCE-LNP (n = 3 technical replicates). Data are shown as mean ± SD. o Percentage of intact LNPs after nebulization in 0.1 × PBS (n = 3 technical replicates). Data are shown as mean ± SD. p Representative IVIS images and (q) quantitative analysis of luminescence in mice treated with CAS-LNP, DESSC-LNP, or DESSCE-LNP at 6 h post-administration (n = 5 biologically independent samples). Data are shown as mean ± SEM. r Representative IVIS images of major organs and (s) quantitative analysis of lungs at 24 h post-administration (n = 5 biologically independent samples). Data are shown as mean ± SEM. The statistical significance of this figure was analyzed by one-way ANOVA and Tukey’s multiple comparisons test. Source data are provided as a Source Data file.
Fig. 4
Fig. 4. Universality of CAS-LNP.
a Representative aqueous AFM amplitude images and (b) force curves of SM102-LNP and CAS-LNP. c Young’s modulus and (d) the maximum force required to break LNP calculated from the force curves of individual LNP (n = 23 technical replicates). Data are shown as mean ± SD. Statistical significance was analyzed by unpaired two-tailed Student’s t test. e Zeta potentials of MC3-LNP, MC3-CAS-LNP, ALC0315-LNP, and ALC0315-CAS-LNP (n = 3 technical replicates). Data are shown as mean ± SD (f) Percentage of intact LNPs after nebulization (n = 3 technical replicates). Data are shown as mean ± SD. The statistical significance was analyzed by one-way ANOVA and Tukey’s multiple comparisons test. g Representative IVIS images of major organs and (h) quantitative analysis of lungs at 24 h post-administration (n = 4 biologically independent samples). Data are shown as mean ± SEM. The statistical significance was analyzed by one-way ANOVA and Tukey’s multiple comparisons test. i IVIS images of tracheas and lungs of dog and pig (j) at 3 h post-administration. Dog and pig were administered with 0.3 mg/kg of mFluc through the Aerogen Solo nebulizer with a custom nose cone. Figure 4i and j were created in BioRender. Lu, X. (2024) BioRender.com/s18b330. Source data are provided as a Source Data file.
Fig. 5
Fig. 5. Inhaled CAS-LNP delivers mRNA to specific cells of mice.
Three-dimensional fluorescent imaging of lungs in mice treated with inhaled SM102-LNP (a) or CAS-LNP (b) encapsulating Cy5-mEGFP at 30 min post-administration. Green and red signals represent EGFP and Cy5, respectively. Representative confocal microscopy images of excised tracheas (c) and lungs (e). Quantitative analysis of Cy5 fluorescence intensity in trachea (d) (n = 8 technical replicates) and pulmonary parenchyma (f) (n = 10 technical replicates). Data are shown as mean ± SD. Statistical significance was analyzed by unpaired two-tailed Student’s t test. g Treatment scheme for evaluating the mRNA expression in different cell types of inhaled CAS-LNP or intravenously injected IV-LNP. Each mouse received 5 µg of mCre per dose. h Schematic illustrating that the expression of Cre recombinase deletes the stop cassette and activates the expression of tdTomato in C57BL/6-Rosa26-CAG-LSL-tdTomato mice. i Representative flow cytometry measurements and quantitative analysis (j) of immune cells (CD45), endothelial cells (CD31), and epithelial cells (CD326) expressing tdTomato in the lungs after different treatments (n = 3 biologically independent samples). Data are shown as mean ± SEM. k The percentage of tdTomato + dendritic cell, alveolar macrophage, interstitial macrophage, neutrophil, B cell, T cell, and NK cell among immune cells of CAS-LNP treated lungs (n = 4 biologically independent samples). Figure 5c and e were created in BioRender. Lu, X. (2024) BioRender.com/m16g625. Figure 5g was created in BioRender. Lu, X. (2024) BioRender.com/j51w648. Figure 5h was created in BioRender. Lu, X. (2024) BioRender.com/m96i222. Source data are provided as a Source Data file.
Fig. 6
Fig. 6. CAS-LNP induces potent systemic and mucosal immune responses as a COVID-19 vaccine.
a Vaccination regimen in mice. CAS-LNP or SM102-LNP containing mCOVID were nebulized and administered to mice on days 0, 14, and 28. Each dose contains 5 µg of mCOVID per mouse. b ELISA analysis of Omicron spike protein-specific IgG in serum and IgA in BALF (d) from mice treated with PBS, SM102-LNP, or CAS-LNP. The virus-neutralizing ability of serum (c) and BALF (e) was measured using an Omicron pseudovirus assay in ACE2-expressing HEK-293T cells (n = 5 biologically independent samples). Data are shown as mean ± SD. f Optical images and (g) quantitative analysis of IFN-γ-spot-forming cells via ELISpot assay. Lung cells of mice were plated and stimulated with an Omicron peptide pool (n = 5 biologically independent samples). Data are shown as mean ± SD. Number of CD4 + (h) and CD8 + (k) T cells in the lung of mice (n = 5 biologically independent samples). Representative flow cytometry plots and quantitative analysis of CD4 + (i, j) (n = 5 biologically independent samples) and CD8 + (l, m) (n = 5 biologically independent samples for PBS and SM102-LNP treated groups, n = 4 biologically independent samples in CAS-LNP treated group) TRM cells among cells in the lung of mice. Flow cytometry analysis showing the number of CD8 + T cells (n) (n = 5 biologically independent samples) and CD8 + TRM cells (o, p) (n = 5 biologically independent samples for PBS and SM102-LNP treated groups, n = 4 biologically independent samples for CAS-LNP treated group) in BALF. Data are shown as mean ± SD. Statistical significance was analyzed by one-way ANOVA and Tukey’s multiple comparisons test. Figure 6a was created in BioRender. Lu, X. (2024) BioRender.com/c71w817. Figure 6f was created in BioRender. Lu, X. (2024) BioRender.com/a39t997. Source data are provided as a Source Data file.
Fig. 7
Fig. 7. CAS-LNP as cancer vaccines.
a Schematic of treatment regimen on a metastatic B16F10-OVA tumor model. CAS-LNP or SM102-LNP containing mOVA were nebulized and administered to mice on days 0, 7, and 14. Each dose contains 5 µg of mOVA per mouse. b Representative flow cytometry plots and (c) quantitative analysis of IFN-γ + CD8 + T cells among lung cells on day 13 post-prime (n = 3 biologically independent samples). Data are shown as mean ± SEM. d Optical images and quantitative analysis of IFN-γ-spot-forming cells among splenocytes on day 13 post-prime via ELISpot assay. Splenocytes of mice were stimulated with SIINFEKL peptide (n = 3 biologically independent samples). Data are shown as mean ± SEM. e Photographs of lungs bearing metastatic tumors from treated mice. Scale bar is 1 cm. f Number of metastatic foci on the lung of treated mice (n = 5 biologically independent samples). Data are shown as mean ± SEM. g Representative images of H&E-stained lung sections following treatments. h Quantitative analysis of metastatic tumor area among the overall lung area (n = 3 biologically independent samples). Data are shown as mean ± SEM. i Schematic of treatment regimen on a metastatic B16F10 tumor model. CAS-LNP or SM102-LNP containing mGP70 were nebulized and administered to mice on days 2, 7, and 12. Each dose contains 5 µg of mGP70 per mouse. j Photographs of lungs bearing metastatic tumors from treated mice. Scale bar is 1 cm. k Number of metastatic foci on the lung and (l) Survival analysis of treated mice (n = 5 biologically independent samples). Data are shown as mean ± SEM. m Schematic showing the polarization of tumor-associated macrophages (TAMs). n Representative flow cytometry plots and quantitative analysis of M1 and M2 macrophages (n = 5 biologically independent samples). Data are shown as mean ± SEM. Statistical significance was analyzed by one-way ANOVA and Tukey’s multiple comparisons test. Figure 7a was created in BioRender. Lu, X. (2024) BioRender.com/n34x441. Figure 7i was created in BioRender. Lu, X. (2024) BioRender.com/h65g080. Figure 7m was created in BioRender. Lu, X. (2024) BioRender.com/m806034. Source data are provided as a Source Data file.

References

    1. Barbier, A. J., Jiang, A. Y., Zhang, P., Wooster, R. & Anderson, D. G. The clinical progress of mRNA vaccines and immunotherapies. Nat. Biotechnol.40, 840–854 (2022). - PubMed
    1. Chow, M. Y. T., Qiu, Y. & Lam, J. K. W. Inhaled RNA therapy: From promise to reality. Trends Pharmacol. Sci.41, 715–729 (2020). - PMC - PubMed
    1. Neutra, M. R. & Kozlowski, P. A. Mucosal vaccines: The promise and the challenge. Nat. Rev. Immunol.6, 148–158 (2006). - PubMed
    1. Shaffer, C. Mist begins to clear for lung delivery of RNA. Nat. Biotechnol.38, 1110–1112 (2020). - PubMed
    1. Patel, A. K. et al. Inhaled nanoformulated mRNA polyplexes for protein production in lung epithelium. Adv. Mater.31, 1805116 (2019). - PMC - PubMed

Publication types

MeSH terms

Supplementary concepts